
Abstract
Mobile phone technology makes use of radio frequency (RF) electromagnetic fields transmitted through a dense network of base stations in Europe. Possible harmful effects of RF fields on humans and animals are discussed, but their effect on plants has received little attention. In search for physiological processes of plant cells sensitive to RF fields, cell suspension cultures of Arabidopsis thaliana were exposed for 24 h to a RF field protocol representing typical microwave exposition in an urban environment. mRNA of exposed cultures and controls was used to hybridize Affymetrix-ATH1 whole genome microarrays. Differential expression analysis revealed significant changes in transcription of 10 genes, but they did not exceed a fold change of 2.5. Besides that 3 of them are dark-inducible, their functions do not point to any known responses of plants to environmental stimuli. The changes in transcription of these genes were compared with published microarray datasets and revealed a weak similarity of the microwave to light treatment experiments. Considering the large changes described in published experiments, it is questionable if the small alterations caused by a 24 h continuous microwave exposure would have any impact on the growth and reproduction of whole plants.
Supplementary Figures
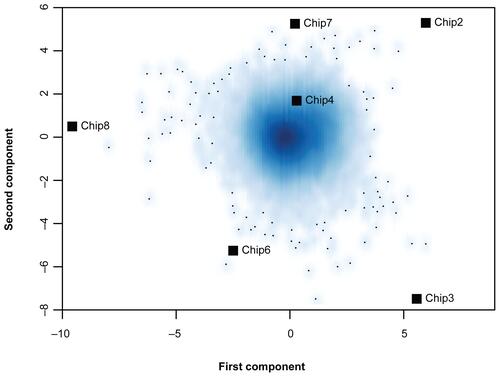
Supplementary Figure 1 Correspondence analysis of expression signals of all genes on the 6 ATH1 microarrays of the microwave dataset. Smoothed color density representation of genes. Dark blue areas reflect high densities of genes and light blue areas represent low gene densities. Single genes in the outer area are marked by small black points. Single microarrays are marked with black squares. There is no clustering of two groups of arrays along the first or second component axis (Array 1 and 5 were left out, since these were hybridized later).
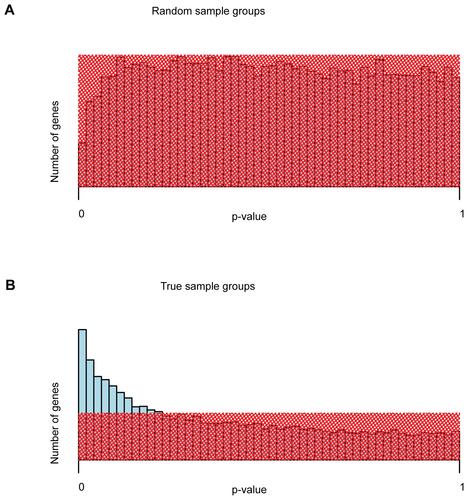
Supplementary Figure 2 Distribution of unadjusted p-values of differential gene expression. (A) Unadjusted p-values for a sample grouping irrespective of microwave treatment. (B) Unadjusted p-values for true sample grouping: microwave treated vs. untreated samples. Shaded red areas represent the uniform distribution of p-values of no differential expression. For the true grouping, blue bars reaching out of the shaded area represent differentially expressed genes. Naturally, after multiple testing correction of p-values, the number of genes with significant p-values () is substantially lower than what could be estimated from the distribution of unadjusted p-values.
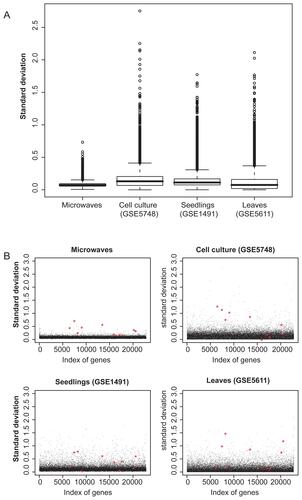
Supplementary Figure 3 Comparison of gene expression variability of the microwave dataset with untreated control microarrays from publicly available datasets. (A) Box-plots of standard deviations of all genes on the ATH1 microarray. The microwave dataset, the controls of a cell culture dataset (GSE5748), those of seedlings (GSE1491), and of leaves (GSE5611) are shown. (B) Scatter-plots of standard deviations of all genes on the ATH1 microarray. The 10 differentially expressed genes of the microwave dataset are highlighted with red stars in each of the datasets. The controls of the cell culture, seedlings and leaves dataset are accessible at NCBI GEO database, (http://www.ncbi.nlm.nih.gov/geo) with their GSE identifier. Raw data of the microarray hybridizations were normalized with the same methods as the microwave microarrays, as described in the Methods section.
Acknowledgments
We thank K. Neuwinger, J. Arnold, N. Hong and U. Taggeselle for technical assistance and are grateful to K. Philippar, Department of Biology I, Ludwig-Maximilians-University of Munich (Germany) for carrying out the microarray hybridizations. The work was supported by E-plus (Germany), BMBF project FUNCRYPTA (FKZ 0313838B), the state of Bavaria (IZKF B-36) and by technical equipment and a grant from Swisscom Innovations (Switzerland).