Abstract
Objectives:
To compare the short-term mortality rates of gastrointestinal (GI) bleeding to those of acute myocardial infarction (AMI) by estimating the 30-, 60-, and 90-day mortality among hospitalized patients.
Methods:
United States national health plan claims data (1999–2003) were used to identify patients hospitalized with a GI bleeding event. Patients were propensity-matched to AMI patients with no evidence of GI bleed from the same US health plan.
Results:
12,437 upper GI-bleed patients and 22,847 AMI patients were identified. Propensity score matching yielded 6,923 matched pairs. Matched cohorts were found to have a similar Charlson Comorbidity Index score and to be similar on nearly all utilization and cost measures (excepting emergency room costs). A comparison of outcomes among the matched cohorts found that AMI patients had higher rates of 30-day mortality (4.35% vs 2.54%; p < 0.0001) and rehospitalization (2.56% vs 1.79%; p = 0.002), while GI bleed patients were more likely to have a repeat procedure (72.38% vs 44.95%; p < 0.001) following their initial hospitalization. The majority of the difference in overall 30-day mortality between GI bleed and AMI patients was accounted for by mortality during the initial hospitalization (1.91% vs 3.58%).
Conclusions:
GI bleeding events result in significant mortality similar to that of an AMI after adjusting for the initial hospitalization.
Introduction
Upper gastrointestinal (GI) bleeding is a common medical condition that may lead to substantial morbidity and mortality. The incidence rate of GI bleeding events has varied substantially in the published literature, in part due to the broad definitions used to examine GI bleeds. One systematic review of 40 publications of serious upper GI bleeds, perforations, and other complications found an incidence rate of one per 1,000 person-years among nonusers of prescription nonsteroidal anti-inflammatory drugs (NSAIDs).Citation1 A recently published retrospective claims data study found an incidence rate of GI bleeding events among NSAID users of 18 per 1,000 person-years.Citation2 Other studies report the incidence of acute upper GI bleed at approximately one case per 1,000 adults in the general population each year.Citation3,Citation4 GI bleeding results in 250,000 to 300,000 hospitalizations and 15,000 to 30,000 deaths per year in the United States.Citation5,Citation6 Some studies point to a 30-day mortality rate due to GI bleeding events as high as 14%,Citation7,Citation8 while others report a range between 6% and 10% per year, with rates increasing in patients with advancing age and increasing number of associated underlying comorbidities.Citation9–Citation11 More than $2.5 billion is spent annually for inpatient care of this problem.Citation6
Along with malignant neoplasms, cerebrovascular diseases, and chronic lower respiratory diseases, acute myo-cardial infarction (AMI) belongs to a category of disease (diseases of the heart) associated with the greatest mortality and morbidity.Citation12 AMI was chosen as a comparison because it is easily recognized by physicians as a cause of mortality. Unlike mortality caused by GI bleeds, the degree of mortality associated with AMI has been better documented. AMI is a medical emergency, and the leading cause of death for both men and women worldwide.Citation13 It is estimated that 1,200,000 people suffer a (new or recurrent) coronary attack every year. Thirty-day risk-standardized mortality from AMI among patients aged 30–64 is reported as 7%, while among patients aged 65 years or older, a 15.9% to 23.5% risk was recently reported.Citation14–Citation16 In 2004, MI resulted in 732,000 to 896,000 hospitalizations in the United States (US). The estimated total (direct and indirect) cost of coronary heart disease in the US for 2007 is $151.6 billion.Citation13
Despite the high mortality rate of GI bleeding events and the well known factors associated with the risk of bleeds, more research is required to assess mortality rates of GI bleeding events. Published US mortality data is outdated with no new studies evaluating GI mortality published after the year 2000. Understanding how mortality among patient with GI bleeding events compares to the mortality associated with an AMI may be valuable in providing context for assessing the impact of the costs and consequences of GI bleeding among patients enrolled in a large managed care organization. The main objective of this study was to examine the 30-, 60-, and 90-day mortality among patients hospitalized for upper GI bleeds compared to a propensity-matched control cohort of patients with acute AMI.
Methods
Data source
This was a retrospective cohort analysis using medical and pharmacy claims data and enrollment information from a large managed health care plan in the United States. Claims are submitted by physicians, facilities, and pharmacies for payment of services provided to covered health plan members. The administrative claims database included data for approximately 14 million covered lives with both medical and pharmacy benefits. The health plan comprises discounted fee-for-service independent practice association plans spanning the US, with the largest concentration in the southern and midwestern regions. All study data were de-identified and accessed with protocols compliant with the Health Insurance Portability and Accountability Act.
GI bleeding study subject identification
Patients at least 18 years of age with evidence of a hospitalization for an upper GI bleeding event during the period from January 1st, 2000 through December 31st, 2003 were identified from the claims data and were selected for inclusion if they had not been hospitalized for GI bleeding or for GI surgery in the six-month pre-index period and had no evidence of a hospitalization for AMI in the six-month pre-index period. The admission date of the first occurring hospitalization for a GI bleeding event, without evidence of trauma, was defined as the index date. Patients who were not continuously enrolled with both medical and pharmacy benefits for at least six months prior to the index date (“baseline” period) and at least 30 days (or until date of death if patient died within the first 30 days) following the index date (“follow-up” period) were excluded from the study sample.
Patients were considered to have been hospitalized for an upper GI bleeding event if they had at least one medical claim with any of the following International Classification of Diseases, Ninth Revision, Clinical Modification (ICD-9-CM) diagnosis codes listed in the primary position of an inpatient hospitalization (456.0, 456.20, 530.7, 530.82, 531.0x, 531.2x, 531.4x, 531.6x, 532.0x, 532.2x, 532.4x, 532.6x, 533.0x, 533.2x, 533.4x, 533.6x, 534.0x, 534.2x, 534.4x, 534.6x). In addition, other hemorrhages attributable to the GI tract: 578.x or 459.0 (unspecified hemorrhage) plus any upper GI diagnosis other than those appearing above, ie, 459.0 or 578.x plus any of [530.xx–537.xx, 558.x, 564.2–564.3] would classify a patient as having GI bleeding. For patients who had a GI bleeding event code listed above in a secondary position of an inpatient hospitalization AND the absence of a primary diagnosis code that would indicate a non-GI bleeding reason for the hospitalization (eg, cardiac), a physician would review all primary diagnoses to verify the hospitalizations as for GI bleeding.
AMI study subject identification
A second cohort of patients at least 18 years of age with evidence of an inpatient hospitalization for AMI during the period from January 1st, 2000 through December 31st, 2003 was identified from the claims data. These patients were selected for inclusion if they had not been hospitalized for AMI or for GI bleeding or for GI surgery in the six-month pre-index period. The service date of the first occurring hospitalization for AMI, without evidence of trauma, was defined as the index date. Hospitalizations for AMI were defined as any hospitalization where AMI is listed as the primary diagnosis code (ICD-9-CM code 410.xx).
To avoid situations where a patient had both GI bleeding and AMI during the initial inpatient stay, patients with both diagnoses during the initial hospitalization were removed from the study sample.
Matching
In this study, a critical task was to develop comparable cohorts of GI bleed and AMI patients. Because patients experiencing GI bleed and AMI patients may have different characteristics, matching was used to create two balanced cohorts. To create two balanced cohorts, the GI sample was matched to the corresponding AMI sample by hard-matching on year/quarter (eg, 2005 Q1) of study entry; age ± 2 years; gender; Charlson Comorbidity Index (CCI) score, and propensity score ± 0.01.
Propensity score model
The propensity score is the conditional probability of GI bleed given observed covariates. In a cohort study, matching the propensity score can be used to balance all of the observed covariates (which may be too numerous to independently hard-match on).Citation17,Citation18 For a given covariate pattern, the propensity score is the predicted the probability of being a member of the GI bleed sample given a set of observed covariates. A logistic regression model was estimated to predict the probability of a hospitalization for GI bleed versus hospitalization for AMI for each patient. Factors considered for use in the propensity score model included patient demographics (age, gender), medication use, factors associated with mortality (eg, comorbid conditions), resource utilization and costs, and time of cohort entry (month/year).
Study measures
Variables used in matching
Patient demographic variables, age, gender, and geographic location were captured from the enrollment data. Age was defined as of the year of the index date. Filled prescriptions in the pre-index period were examined for medications of interest. Medications included were those associated with cardiovascular diseases (eg, ACE inhibitors, angiotensin receptor blockers [ARBs], beta-blockers, alpha-blockers, calcium channel blockers [CCBs], nitrates, and lipid-lowering agents) as well as those that were associated with GI disorders (eg, H2 blockers, NSAIDs, and proton pump inhibitors). Comorbidities, an important confounding factor, were measured during the baseline period using the CCI,Citation19,Citation20 a clinical index that incorporates 19 categories of comorbidity which are primarily defined using ICD-9-CM diagnoses codes (a few procedure codes are also employed). Each category is assigned a weight to indicate relative comorbidity, which is based on the adjusted risk of one-year mortality. Patients’ CCI score is the weighted sum of the conditions. The overall comorbidity score reflects the cumulative increased likelihood of one-year mortality; the higher the score, the more severe the burden of comorbidity. presents the baseline CCI components.
Table 1 Pre-match: baseline Charlson Comorbidity Index components
Outcome variables
The main outcome variable evaluated in this study was mortality during initial hospitalization and mortality after discharge from the initial hospitalization thru 30-, 60-, and 90-days. The National Death Index (NDI) database was used to compile mortality information. The NDI is a computerized list of death records in the US compiled by the National Center for Health Statistics through contractual agreements with state vital statistics offices. The database includes deaths reported since 1979 and is updated with approximately two million deaths annually from all 50 US states, the District of Columbia, Puerto Rico, and the Virgin Islands. All data for a given calendar year are added to the NDI approximately one year later. At the time of this study, the NDI death records were complete through the end of 2005. NDI users submit information on as many as 12 potential matching variables, from which returned records are ranked on the basis of a probabilistic scoring mechanism to determine the likelihood of a true match. The user then must decide which NDI records may be associated with the subjects in question.Citation21
Procedures and rehospitalizations were also evaluated 30 days following the index date. Inpatient and outpatient claims were used to identify cardiac revascularization for the AMI sample and GI endoscopy for the GI bleed sample. GI endoscopy was chosen as patients are likely to undergo an endoscopy to follow up on a lesion or if re-bleeding is suspected. Cardiac revascularization was chosen as many patients following an AMI have coronary disease requiring subsequent revascularization by either stent or surgery. In addition, pre-index health care costs from medical and pharmacy claims for services delivered in the six-month pre-index period were calculated as a function of health plan and patient liability. Reported costs reflect the total amounts paid by the health plan and the patient.
Analysis
The study outcomes (mortality, rehospitalization, and select procedures) were compared between the matched cohorts using a Chi-squared test. Comparison of all continuous variables was based on two-sample t-tests and Chi-squared test for dichotomous variables. All analyses were conducted using the SAS software program (version 9.0; SAS Institute, Inc., Cary, NC, USA). Matching and propensity score models were performed using Stata statistical software (version 9.0; Stata Corporation, College Station, TX, USA).
Results
Patient characteristics
A total of 12,437 patients met the study criteria for inclusion into the GI bleed sample and 22,847 for inclusion into the AMI sample. Prior to matching, patients in the GI bleed and AMI samples differed significantly with regard to patient characteristics, medication use, CCI score, and health care utilization and costs, as shown in and . Patients in the AMI sample were generally older, and a significantly higher proportion of the AMI cohort was male. A comparison of baseline medication use revealed several significant differences between the cohorts. Patients in the AMI sample were significantly more likely to have taken most cardiovascular medications, including ACE inhibitors, ARBs, beta-blockers, alpha-blockers, CCBs, nitrates, and lipid-lowering agents. By contrast, patients in the GI bleed sample had higher use of both GI medications (ie, proton pump inhibitors, H2 antagonists, and sucralfate) and medications known to increase risk for GI bleeding (ie, anticoagulants, corticosteroids, bisphosphonates, COX-2 inhibitors, and other NSAIDs). The GI bleed sample also had a higher mean CCI score than the AMI sample. Similarly, a comparison of baseline utilization and costs by patients in each sample found that the GI bleed sample had significantly higher values on nearly every measure. reports prematch mortality outcomes.
Figure 1 Pre-matched mortality for gastrointestinal (GI) bleed and acute myocardial infarction (AMI) during and following initial hospitalization.
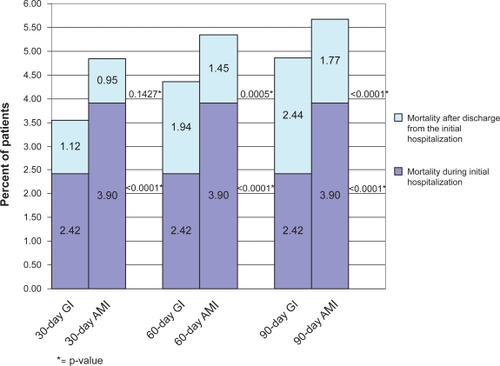
Table 2 Pre-match and post-match: Patient characteristics
Table 3 Pre-match and post-match health care costs and utilization
Following the matching procedure, 6,923 matched pairs were identified and included in the analytic dataset. The goal of the matching process was to create two cohorts that were balanced on observable demographics and clinical characteristics. After matching, demographic and clinical characteristics of the GI bleed and AMI cohorts appeared very similar ( and ). Despite a relatively large sample size, formal statistical tests showed no evidence of statistically significant differences between cohorts. Of note, baseline medication use was not factored into the propensity score model because many medications were found to be too strongly correlated with the cohort. Clinically, this is a reasonable assumption as one would expect differential use of specific medications between cohorts (eg, use of nitrates is more than two times greater in the AMI cohort while H2 antagonists are more commonly used among the GI bleed patients). Emergency room (ER) costs were the only expenditures that differed between the GI bleed and AMI cohorts in the health care costs/utilization category after matching during the six-month period prior to the index date: lower ER costs were seen in the GI bleed cohort ($102 vs $130; p = 0.002). Total health care, medical, and pharmacy costs were all similar during the baseline period ().
Post-matched outcomes
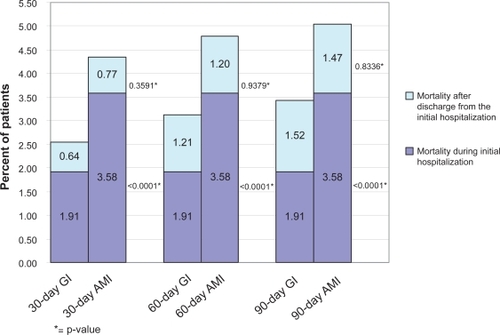
The overall 30-, 60-, and 90-day mortality rates for the GI cohort were 2.54%, 3.12%, and 3.42%, respectively. These overall mortality rates were lower than the corresponding mortality rates of the matched cohort of AMI patients (4.35%, 4.78%, and 5.06%, respectively), as shown in . The majority of the difference in overall 30-day mortality between GI bleed and AMI patients (2.54% vs 4.35%) was accounted for by mortality during the initial hospital stay (1.91% vs 3.58%). The 30-day mortality excluding those within the initial hospitalization did not differ between the cohorts (0.64% vs 0.77%). When mortality during the initial hospitalization was removed from the 60- and 90-day mortality rates, results between cohorts were similar. The “adjusted” 60-day mortality rates in the GI bleed and AMI cohorts were 1.21% and 1.20%, respectively, while the 90-day rates were 1.52% and 1.47%, respectively.
Figure 2 Post-matched mortality for gastrointestinal (GI) bleed and acute myocardial infarction (AMI) during and following initial hospitalization.
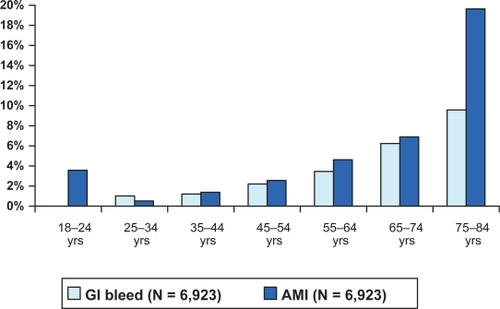
Age was also found to be an important variable in patient mortality in both cohorts of patients. A stratification of mortality by age found that the mortality rate increased with every decade of a patient’s age. For the GI bleed population, 30-day mortality for patients under age 35 was 0%–2% and increased to close to 6% in patients 75 years and older. With the exception of patients 18–24 years of age, similar trends were observed for the AMI cohort. shows the 90-day mortality stratified by age.
Figure 3 90-Day mortality rates for gastrointestinal (GI) bleed and acute myocardial infarction (AMI) by age (post-match).
A comparison in the rate of change of mortality over time between the GI bleed and AMI cohorts demonstrated a faster growth rate in the GI bleed cohort. Mortality due to GI bleed increased by 35% between day 30 and day 90 post-index date (absolute value = 0.88%), while the AMI group saw a 16% mortality increase during the same time period (absolute value = 0.71%).
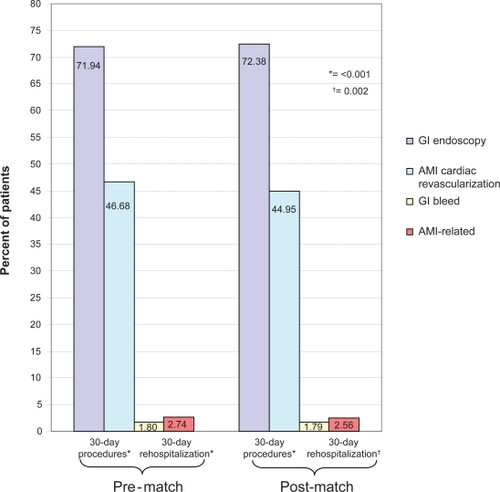
A comparison of procedures and rehospitalizations among the matched cohorts found that AMI patients had higher rates of rehospitalization (2.56% vs 1.79%; p = 0.002), while GI bleed patients were more likely to have a procedure within 30 days following their initial hospitalization admission (72.38% vs 44.95%; p < 0.001) ().
Figure 4 30-Day procedures and rehospitalizations among the matched cohorts.
Discussion
The main objective of this analysis was to compare the short-term clinical outcomes of an upper GI bleeding event with those of an AMI. To that end, we identified samples of individuals with a GI bleeding event or an AMI and matched them to each other on a number of specific patient characteristics and their propensity scores.
Prior to matching, the GI bleed sample had a higher mean CCI score than the AMI sample. Similarly, a comparison of baseline utilization and costs by patients in each sample found that the GI bleed sample had significantly higher values on nearly every measure. These results may suggest that patients in the GI bleed sample had a higher burden of disease than did those in the AMI sample, which is not what would be expected. Alternatively, it is possible that the higher proportion of females in the GI bleed sample may have driven this difference, as females are known to utilize health care at a greater level than males.Citation22
Patients in the GI bleed and AMI samples were matched to one another to create two cohorts that were balanced on observable demographics and baseline characteristics. After matching, the resultant GI bleed and AMI cohorts each included 6,923 patients. The cohorts did not differ with regard to age or gender. However, many differences with regard to medication use remained because we did not match on these as the medication used by the patients would not alter the mortality rate. The matched cohorts were found to have similar CCI scores and to be similar on nearly all utilization and cost measures (excepting ER costs). Of note is that the matched cohorts appeared to have lower CCI scores, as well as lower utilization rates and incurred costs, compared with the initial GI bleed and AMI samples. It appears, therefore, that patients in the matched cohorts had lower disease burden than the underlying GI bleed and AMI patient populations. It is possible that the magnitude of the study outcomes (eg, mortality) will be underestimated as a result, although the comparison of the GI bleed and AMI cohorts should still be valid.
A comparison of outcomes among the matched cohorts found that AMI patients had higher rates of mortality and rehospitalization, while GI bleed patients were more likely to have a procedure following their initial hospital admission. A closer examination of the 30-day mortality for the study cohorts found that the majority of the difference in overall 30-day mortality between GI bleed and AMI patients (2.54% vs 4.35%) was accounted for by mortality during the initial hospital stay. Once mortality during the initial hospitalization was removed from the 60- and 90-day mortality rates, we found similar results. This may be expected, as the cohorts were matched on a number of characteristics, including CCI score, a validated measure for predicting mortality.
We found mortality among hospitalized AMI patients to be significantly lower than in the published literature. Rasmussen and colleaguesCitation15 estimated AMI mortality 30 days after hospital admission to be 7% for 30- to 64-year-olds and 15.9% for 65- to 74-year-olds. The current study found 30-day mortality to be 4.85% among unmatched AMI patients and 4.35% among matched AMI patients. A number of reasons may help explain the difference in 30-day mortality. First, the populations differ in that the current study examines US managed care enrollees, while the Rasmussen study uses Denmark’s National Patient Registry containing administrative data for hospitalizations. A closer look at the Rasmussen study reveals that among the 30- to 64-year-old AMI patients, mortality of high- and medium-income level patients was 5.1% and 6.5%, respectively.Citation15 Presumably, the current study’s population would be skewed toward an under 65 age group with moderate to high incomes. Although not conclusive,Citation23,Citation24 there is considerable evidence that, at least within the United States, income inequality is associated with poorer population health.Citation25–Citation27 More specifically, the relationship between income inequality and mortality has also come into question in many studies and many have concluded that income inequality remained a significant correlate of mortality, particularly in the United States.Citation28–Citation31 An examination of the current study’s mortality by age strata illustrates that mortality does increase with age, but this increase may be tempered by the income effect. Furthermore, the Rasmussen study data are from 1995–2002, whereas the current study examines AMI patients during the period from 2000–2003. As treatment options have evolved, mortality may be decreasing, if only slightly.
Mortality rates among hospitalized upper GI bleed patients also appear lower than estimates found in the literature. Thirty-day mortality rates for GI bleeding have been reported to be between 5% and 15% (the lower rates being for patients under 65 years of age).Citation32–Citation36 The current study found lower 30-day mortality (3.54% among unmatched patients and 2.54% among matched patients). Christensen and colleaguesCitation37 estimated 30-day mortality to be 4.3% in an under 65 population, 10.2% in those aged 65–79, and 17.0% in those aged 80+. However, Christensen examined only 30-day mortality after peptic ulcer bleeding, whereas the current study uses a much broader definition of upper GI bleed, encompassing some patients who may have a lower risk of mortality. An examination of mortality by age strata reveals that although mortality increases with age in our study, this increase may be tempered by the inclusion of other types of GI bleed (besides peptic ulcer). Yavorski and colleaguesCitation10 conducted a retrospective study that evaluated 3,294 cases of upper GI bleeding in US military medical facilities. The mean age of the population was 52 years, which was similar to the mean age of the matched population in our study of 55 years. The overall mortality rate was 7.0% and also slightly lower than in most previous studies.Citation10 The mortality rate observed in this and other studies reporting lower mortality rates may be more reflective of the average mortality in the community at large.Citation10
Mortality also varies depending upon the cause of the bleeding. Wilcox and colleaguesCitation9 prospectively evaluated 796 patients from the gastroenterology consultative service at a large inner-city hospital over a 50-month period. Although the overall mortality rate was 8.8%, significant differences were detected according to the cause of bleeding. The mortality was 2.4% among patients with Mallory–Weiss tear and 4.3% among those with peptic ulcer bleeding, including gastric ulcer (4.2%) and duodenal ulcer (4.3%). By contrast, the mortality associated with portal hypertension-related bleeding was 32% (esophageal varices, 32%; gastric varices, 50%; portal hypertensive gastropathy, 23%).Citation9 Our study also evaluated patients with upper GI bleeds due to a broad number of causes, some of which are associated with lower rates of mortality. When evaluating the cause of the GI bleed hospitalization in our study, we found that our study population had a low number of hospitalizations caused by variceal bleeding, a condition that is usually associated with a high mortality rate. In our study, only 4.62% of the hospitalizations were due to variceal bleeding in the matched cohort. This further explains the lower mortality rate seen in this study as compared with some other published studies.
Limitations
While claims data are extremely valuable for the efficient and effective examination of health care outcomes, treatment patterns, health care resource utilization and costs, claims data are collected for the purpose of payment and not research. Therefore, there are certain limitations associated with the use of claims data. First, presence of a claim for a filled prescription does not indicate that the medication was consumed, nor does it indicate that it was taken as prescribed. Second, medications filled over-the-counter or provided as samples by the physician will not be observed in the claims data. Third, presence of a diagnosis code on a medical claim is not positive proof of the presence of disease, as the diagnosis may be incorrectly coded or included as a rule-out criterion rather than representing actual disease.
Conclusion
GI bleeding events result in significant mortality similar to that of an AMI after adjusting for the initial hospitalization. In this study, we identified a lower overall mortality among patients with upper GI bleeding compared to other published studies. This favorable mortality could be a reflection of the average mortality in the community at large. It could also be due to improved techniques of diagnosis and more frequent use of effective endoscopic therapy in this patient population. This research can help physicians weigh the risks of GI bleeding against the benefits of therapies that may contribute to GI bleeds. Future study will need to evaluate the cost and resource utilization associated with GI bleeding events leading to mortality.
Acknowledgements
Gergana Zlateva, PhD, works for Pfizer, Inc., which provided the financial support to sponsor the research for this study. Drs C Mel Wilcox and Byron Cryer received honorarium from Pfizer for consulting services on the study and development of this manuscript.
References
- Hernandez-DiazSRodriguezLAIncidence of serious upper gastrointestinal bleeding/perforation in the general population: review of epidemiologic studiesJ Clin Epidemiol20025515716311809354
- StocklKCyprienLChangeEYGastrointestinal bleeding rates among managed care patients newly started on Cox-2 inhibitors or nonselective NSAIDsJ Manag Care Pharm2005155055816137212
- LongstrethGFEpidemiology of hospitalization for acute upper gastrointestinal hemorrhage: a population-based studyAm J Gastroenterol1995902062107847286
- RockallTALoganRFADevlinHBIncidence of and mortality from acute upper gastrointestinal haemorrhage in the United KingdomBMJ19953112222267627034
- GilbertDAEpidemiology of upper gastrointestinal bleedingGastrointest Endosc199036supplS8S132242816
- JohansonJFCurbing the costs of GI bleedingAm J Gastroenterol199893138413859707078
- RodriguezLAGRuigomezAHasselgrenGComparison of mortality from peptic ulcer bleed between patients with or without peptic ulcer antecedentsEpidemiology199894524569647912
- LimCHHeatleyRVProspective study of acute gastrointestinal bleeding attributable to anti-inflammatory drug ingestion in the Yorkshire region of the United KingdomPostgrad Med J20058125225415811890
- WilcoxCMClarkWSCauses and outcome of upper and lower gastrointestinal bleeding: the Grady Hospital experienceSouth Med J19999244509932826
- YavorskiRTWongRKMaydonovitchCAnalysis of 3,294 cases of upper gastrointestinal bleeding in military medical facilitiesAm J Gastroenterol1995905685737717312
- VreeburgEMSnelPde BruijneJWAcute upper gastrointestinal bleeding in the Amsterdam area: incidence, diagnosis, and clinical outcomeAm J Gastroenterol1997922362439040198
- KungHCHoyertDLXuJQMurphySLDeaths: Final data for 2005 National Vital Statistics Reports; 56(10)Hyattsville, MDNational Center for Health Statistics2008
- American Heart AssociationHeart Disease and Stroke Statistics – 2007 UpdateDallas, TXAmerican Heart Association2007
- BradleyBHHerrinJElbelBHospital quality for acute myocardial infarction. Correlation among process measures and relationship with short-term mortalityJAMA2006296727816820549
- RasmussenJNRasmussenSGislasonGHMortality after acute myocardial infarction according to income and educationJ Epidemiol Community Health20066035135616537354
- SkinnerJChandraAStaigerDMortality after acute myocardial infarction in hospitals that disproportionately treat black patientsCirculation20051122634264116246963
- RosenbaumPRubinDBThe central role of the propensity score matching in observational studies for causal effectsBiometrika1983704155
- DehejiaRHWahbaSPropensity score-matching methods for nonexperimental causal studiesThe Review of Economics and Statistics200284151161
- CharlsonMEPompeiPAlesKLA new method of classifying prognostic comorbidity in longitudinal studies: development and validationJ Chron Dis1987403733833558716
- DeyoRACherkinDCCiolMAAdapting a clinical comorbidity index for use with ICD-9-CM administrative databasesJ Clin Epidemiol1992456136191607900
- National Center for Health StatisticsNational Death Index User’s GuideHyattsville, MDUS Department of Health and Human Services and Centers for Disease Control2006
- National Center for Health Statistics HealthUnited States, 2007, With Chartbook on Trends in the Health of AmericansHyattsville, MDUS Department of Health and Human Services and Centers for Disease Control2007
- CinkoJAShiLStarfieldBIncome inequality and health: a critical review of the literatureMed Care Res200360407452
- LynchJHarperSKaplanGAAssociations between income inequality and mortality among US states: the importance of time period and source of income dataAm J Public Health2005951424143016006417
- LynchJSmithGDHillemeierMIncome inequality, the psychosocial environment, and health: comparisons of wealthy countriesLancet200135819420011476836
- KennedyBPKawachiIGlassRIncome distribution, socioeconomic status, and self rated health in the United States: multilevel analysisBMJ19983179179219756809
- BlakelyTALochnerKKawachiIMetropolitan area income inequality and self-rated health – a multi-level studySoc Sci Med200254657711820682
- KennedyBPKawachiIProthrow-StithDIncome distribution and mortality: cross sectional ecological study of the Robin Hood index in the United StatesBMJ1996312100410078616345
- LochnerKPamukEMakucDState-level income inequality and individual mortality risk: a prospective, multilevel studyAm J Public Health20019138539111236402
- ShiLMacinkoJStarfieldBThe relationship between primary care, income inequality, and mortality in US States, 1980–1995J Am Board Fam Pract20031641242214645332
- RossNADorlingDDunnJRMetropolitan income inequality and working-age mortality: a cross-sectional analysis using comparable data from five countriesJ Urban Health20058210111015738331
- GralnekIMJensenDMKovacsTOGAn economic analysis of patients with active arterial peptic ulcer hemorrhage treated with endoscopic heater probe, injection sclerosis, or surgery in a prospective, randomized trialGastrointest Endosc1997461051129283858
- GralnekIMJensenDMGornbeinJClinical and economic outcomes of individuals with severe peptic ulcer hemorrhage and non-bleeding visible vessel: an analysis of two prospective clinical trialsAm J Gastroenterol199893204720569820371
- QuirkDMBarryMJAserkoffBPhysician specialty and variations in the cost of treating patients with acute upper gastrointestinal bleedingGastroenterology1997113443448
- MarshallJKCollinsSMGafniAPrediction of resource utilization and case cost for acute nonvariceal upper gastrointestinal hemorrhage at a Canadian community hospitalAm J Gastroenterol1999941841184610406245
- LeeJGTurnipseedSRomanoPSEndoscopy-based triage significantly reduces hospitalization rates and costs of treating upper GI bleeding: a randomized controlled trialGastrointest Endosc19995075576110570332
- ChristensenSRiisANorgaardMShort-term mortality after perforated or bleeding peptic ulcer among elderly patients: a population-based cohort studyBMC Geriatrics20077817439661