Abstract
In chronic obstructive pulmonary disease (COPD) patients tiotropium bromide has been shown to improve forced expiratory volume in one second (FEV1) and inspiratory capacity (IC). We investigated whether the mechanism leading to these improvements is related to small airways ventilation heterogeneity, assessed by multiple breath washout tests. Forty stable tiotropium-free COPD patients (FEV1: 27%–78% predicted) were studied before and 90 min after administration of tiotropium bromide on visit0, and following 3 and 6 weeks of tiotropium bromide treatment (visit3wks, visit6wks). After study completion, COPD patients were classified into two subgroups according to degree of hyperinflation at visit0 (Hyp−, Hyp+). The Hyp+ group showed significant increases in trough (ie, pre-dose) FEV1 and IC after 3 and 6 weeks of tiotropium bromide, and the 90 min tiotropium bromide responses of FEV1 and IC were significant at visit0 (p ≤ 0.001 for both) but not during subsequent visits. The Hyp- group showed significant FEV1 increases 90 min after tiotropium bromide on all three visits (all p < 0.005) but no sustained increase in trough values. In both COPD subgroups, the grossly abnormal ventilation heterogeneity barely showed any significant improvements with tiotropium bromide in the conductive airways (without changes in trough value) and no changes at all in the acinar airways. We conclude that the sustained improvements in trough IC and FEV1 with tiotropium bromide predominantly observed in COPD patients with considerable hyperinflation, are unrelated to small airways ventilation heterogeneity.
Introduction
Several clinical trials have investigated the effect of the long-acting anticholinergic bronchodilator, tiotropium bromide (CitationBarnes et al 1995), on lung function and dyspnea at rest (Citationvan Noord et al 2000; CitationVincken et al 2002; CitationCasaburi et al 2002; CitationCelli et al 2003; CitationBrusasco et al 2003; CitationVerkindre et al 2006) and during exercise (CitationO’Donnell et al 2004; CitationCasaburi et al 2005; CitationMaltais et al 2005), and assessed its influence on quality of life (CitationVincken et al 2002; CitationCasaburi et al 2002; CitationBrusasco et al 2003; CitationCasaburi et al 2005; CitationVerkindre et al 2006) or on the occurrence of exacerbations (CitationVincken et al 2002; CitationNiewoehner et al 2005; CitationDusser et al 2006) in chronic obstructive pulmonary disease (COPD). Most of these studies indicated significant and sustained improvements of the primary outcome parameters, and consistently reported improvements in forced expiratory volume in one second (FEV1) and/or inspiratory capacity (IC) after different tiotropium bromide treatment periods up to one year. Given that tiotropium bromide is thought to act through its selective and prolonged binding to M3 receptors (CitationGross 2004), which are predominantly located in the large and medium-sized airways (CitationBarnes 2004), it could a priori be expected that the improvement in airway function would be mainly located in these larger conductive airways. While the observed FEV1 improvements could be brought in agreement with this proposition, the IC improvements have prompted several authors to hint at the implication of small airways in this anticholinergic bronchodilation process (Citationvan Noord et al 2000; CitationVerkindre et al 2006).
We have recently shown that COPD patients are characterized by a combination of both large and small conductive airways ventilation heterogeneity, as opposed to smokers with similar smoking history but without COPD in whom only small airways are affected (CitationVerbanck et al 2004). This was measured with a model-based analysis of the multiple breath washout test which delivers independent phase III slope-derived indices of ventilation heterogeneity originating in the conductive and acinar lung zone (Scond and Sacin, respectively) (CitationVerbanck et al 1997, Citation1998). In an earlier study, COPD patients have shown no significant response of Scond or Sacin to 400 μg of salbutamol with a small spacer inhalation aid (CitationVerbanck et al 1999). In the present study, we use Scond and Sacin measurements to test the hypothesis that the small airways situated in the conductive and/or proximal acinar lung zones could participate to some degree in the tiotropium bromide response and thus affect inspiratory capacity, which is linked to dyspnea and exercise limitation in COPD patients (CitationO’Donnell et al 2004). In particular, this mechanistic study aims to investigate whether the reported beneficial effects on pre-dose (trough) and peak values of FEV1 and IC are paralleled by improvements in small air-ways heterogeneity. In order to assess whether any potential improvement in small airways ventilation heterogeneity was specifically linked to improvement in hyperinflation, we deliberately included COPD patients with varying degrees of hyperinflation at baseline (which is also representative of a real-life clinical situation).
Material and methods
Patients and procedures
The study protocol was approved by the local ethics committee. Forty patients with a clinical diagnosis of COPD for at least 2 years were recruited if they fulfilled the following inclusion criteria: aged over 40 years, smoking history of at least 15 packyears, FEV1/forced vital capacity (FVC) < 70% and post bronchodilator FEV1 < 80%pred. Patients with a history of concomitant asthma or atopy or patients requiring supplemental oxygen therapy were excluded. None of the patients had suffered any exacerbation in the six month period prior to the study, nor any recent upper respiratory tract infection. The COPD patients already on tiotropium bromide treatment were asked to discontinue tiotropium for at least 4 weeks before the screening visit. A written informed consent was obtained from all participating patients. Patients had been requested not to take any short- or long-acting bronchodilator medication for at least 8 h and 24 h, respectively, before each visit. There was 1 screening visit and 3 visits further referred to as study visits, ie, a baseline visit (visit0) and two visits after respectively 3 and 6 weeks (visit3wks and visit6wks) of tiotropium bromide therapy (18 μg dry powder inhaled via the HandiHalerR device once daily in the morning). On visit3wks and visit6wks, the last tiotropium bromide intake was on the morning preceding the study day.
On the screening visit, patients underwent lung function and ventilation distribution testing according to standardized procedures. Lung function included spirometry and plethysmographic measurement of specific airway conductance (sGaw) and IC (ICpl). Given the potential problems with plethysmographic volume determination in the case of obstructed patients (CitationRodenstein and Stanescu 1982), we also used the preferred method of IC computation (ie, the difference between open circuit functional residual and total lung capacity volume levels). For the computation and interpretation of ventilation heterogeneity indices Scond and Sacin, we refer to a previous description (CitationVerbanck et al 1997), which is briefly summarized in the Appendix. The screening visit served to characterize patients in terms of lung function and ventilation heterogeneity, and to assess their room for reversibility by the combination of a short-acting anticholinergic and a fast-acting β2-agonist drug. Sixty minutes after inhalation of 80 μg of ipratropium bromide, an intermediate spirometry was performed, and additional bronchodilation was elicited by inhaling 400 μg of salbutamol. After another 30 min (ie, cumulative post-bronchodilator time: 90 min),lung function and ventilation distribution testing was repeated.
On the baseline study visit (visit0), patients first underwent lung function and ventilation distribution testing, and were then instructed to inhale 18 μg of tiotropium bromide dry powder via the HandiHaler® device for the first time. After 60 min, intermediate spirometry was performed, and after 90 min, the study visit was concluded with lung function and ventilation distribution testing. The next two study visits (visit3wks and visit6wks), after respectively 3 and 6 weeks of daily tiotropium bromide treatment, involved exactly the same procedure as that on visit0. Given that for these two study visits, the last tiotropium bromide intake had been on the morning preceding the study day, the 90 min effect of tiotropium bromide could be assessed on trough values of lung function and ventilation heterogeneity in the laboratory.
On each visit, patients rated their dyspnea on a visual analogue scale (VAS) and by means of the Medical Research Council (MRC) scale (ranging 1–5). Finally, patients also filled out a symptom score sheet for wheezing, shortness of breath, cough, and chest tightness ranging “not present”,“mild”,”moderate”,“severe” (scored 0–3 and summed to a total symptom score ranging 0–12).
Statistical analysis
Two-way repeated measures analysis of variance (ANOVA) (Statistica5.5, StatSoft, Tulsa, OK) was used to detect any differences between the 3 study visits prior to and 90 min after tiotropium bromide administration (2 factors: inter-visit and intra-visit tiotropium bromide effect). One-way repeated measures ANOVA was used to detect any inter-visit differences on the symptom scores. Bonferroni adjustment was used to test for post-hoc differences. Spearman rank correlations were performed between changes in symptom or dyspnea scores and changes in lung function indices.
Results
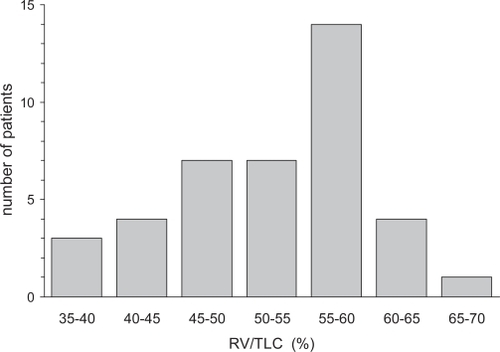
The 40 patients (36M/4F) participating in this study were stable COPD patients on maintenance treatment mostly involving inhaled steroids (37/40) in combination with long-acting β2-agonists (37/40). All patients were also on a combination of short-acting β2-agonists and ipratropium bromide, but at study entry, ipratropium bromide was discontinued. Eight out of 40 patients were current smokers. shows a histogram of the residual volume over total lung capacity ratio (RV/TLC) measured at the screening visit before bronchodilator administration, in the patient group under study (n = 40). The median RV/TLC being 54.8%, the group was split into a subgroup with a high degree of hyperinflation if RV/TLC ≥ 55% (Hyp+; n = 20) and a subgroup with a low degree of hyperinflation if RV/TLC < 55% (Hyp− ; n = 20).
Figure 1 Histogram of the distribution of the residual volume (RV) over total lung capacity (TLC) ratio in the COPD group under study (n = 40). The 4 left-most bars constitute the Hyp– group (n = 20) and the 3 right-most bars constitute the Hyp+ group (n = 20).
shows lung function, ventilation heterogeneity and symptom scores prior to tiotropium bromide administration on the study visits visit0, visit3wks and visit6wks. For each parameter in , change from baseline (Δ) was computed as the difference between the value of visit6wks and that of baseline visit0 in order to test for correlations of change. In the Hyp− group, none of the correlations between changes in symptom or dyspnea scores and changes in lung function parameters were significant (p > 0.1 for all). In the Hyp+ group, changes in total symptom or MRC score did not correlate with any lung function or ventilation heterogeneity changes (p > 0.1 for all). However, ΔVAS did correlate with ΔIC (r = −0.54; p = 0.016) and also with ΔsGaw (r = 0.49; p = 0.03) (). clearly identifies an outlier at ΔsGaw = 0.055 cm−1H2O • s−1 (open circle); upon detailed inspection, this was due to the plethysmographic determination of lung volume but there was no objective reason for exclusion.
Table 1 Characteristics of COPD subgroups with RV/TLC ≥ 55% (Hyp+) OR <55% (Hyp−) and the effect of tiotropium
Figure 2 A: Scatterplot of the individual change in IC (ΔIC) versus the corresponding change in visual analog dyspnea score (ΔVAS) in the Hyp+ group where ΔIC and ΔVAS are computed as the VAS or pre-tiotropium IC value at the 6 weeks tiotropium visit minus the VAS or pre-tiotropium IC value at the baseline study visit. B: Scatter-plot of the individual change in sGaw (ΔsGaw) versus the corresponding change in visual analog score (ΔVAS) in the Hyp+ group; same representation as in A.
Panels A in – illustrate, for the Hyp+ group, inter- and intra-visit changes in FEV1, IC, Scond, or sGaw, ie, those parameters of showing any significant inter- or intra-visit change in this subgroup. Panels B in – display the corresponding data for the Hyp− group.
Figure 3 A: Forced expiratory volume in one second (FEV1) as %predicted obtained from the Hyp+ group on the screening visit (dotted line connecting open triangles; pre- and 90 min post-dilation with a combination of salbutamol and ipratropium bromide) and during the three study visits (solid lines connecting open circles (pre-) and closed circles (90 min post-) tiotropium); the crosses refer to intermediate FEV1measures after 60 min. On the first study visit, patients were tiotropium-free, while the other two study visits followed 3 and 6 weeks of tiotropium once-daily treatment with the last tiotropium intake on the day prior to the study visit; asterisks indicate any significant change 90 min after tiotropium (2-way ANOVA with Bonferroni; p < 0.05). B: FEV1obtained from the Hyp− group.
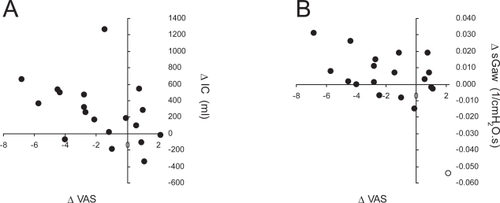
Figure 4 A: Inspiratory capacity measured in an open circuit (IC) obtained from the Hyp+ group on the screening visit (dotted line connecting open triangles; pre- and 90 min post-dilation with a combination of salbutamol and ipratropium bromide) and during the three study visits (solid lines connecting open circles (pre-) and closed circles (90 min post-) tiotropium). On the first study visit, patients were tiotropium-free, while the other two study visits followed 3 and 6 weeks of tiotropium once-daily treatment with the last tiotropium intake on the day prior to the study visit; asterisks indicate any significant change 90 min after tiotropium (2-way ANOVA with Bonferroni; p < 0.05); the dotted line represents the predicted IC value for this subgroup. B: IC obtained from the Hyp− group.
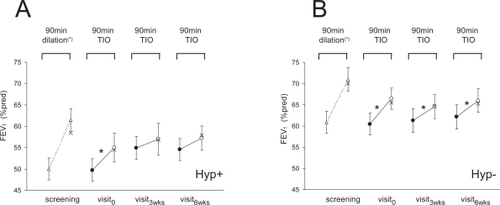
Figure 5 A: Specific conductance (sGaw) obtained from the Hyp+ group on the screening visit (dotted line connecting open triangles; pre- and 90 min post-dilation with a combination of salbutamol and ipratropium bromide) and during the three study visits (solid lines connecting open circles (pre-) and closed circles (90 min post-) tiotropium). On the first study visit, patients were tiotropium-free, while the other two study visits followed 3 and 6 weeks of tiotropium once-daily treatment with the last tiotropium intake on the day prior to the study visit; asterisks indicate any significant change 90 min after tiotropium (2-way ANOVA with Bonferroni; p < 0.05). B: sGaw obtained from the Hyp− group.

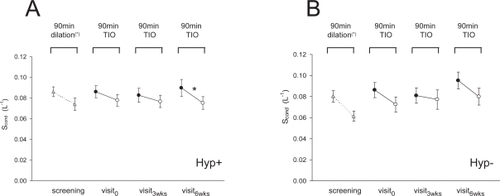
In the Hyp+ group, FEV1 () and IC () significantly increased 90 min after the first 18 μg tiotropium bromide dose on visit0 (p ≤ 0.001 for both), while no such intra-visit increases occurred during visit3wks and visit6wks (p > 0.1 for both). Intra-visit changes in sGaw () showed a similarity with FEV1 and IC behavior, in that sGaw also increased significantly during the baseline visit0 (p < 0.001) but not during visit3wks or visit6wks (p > 0.1). While suggests an increase in trough sGaw value, this was not significant (p > 0.05 for both), yet, when excluding the abovementioned outlier (; open circle), trough sGaw did increase significantly from 0.038 cm−1H2O • s−1 (visit0) to 0.045 cm−1H2O • s−1 (visit3wks; p = 0.007) and 0.044 cm−1H2O • s−1 (visit6wks; p = 0.04). While indicates tendencies for intra-visit Scond decreases (ie, improvements) of the same order as that observed on the screening visit, averaging an 11% decrease over the three study visits, the Scond decrease only reached statistical significance on the last visit (p = 0.02). The complementary indicators of small airway function, end-expiratory flow after 75% of forced expired vital capacity (FEF75) and Sacin, did not present any inter- or intra-visit effect in this subgroup (p > 0.1 for all).
Figure 6 A: Conductive ventilation heterogeneity (Scond) obtained from the Hyp+ group on the screening visit (dotted line connecting open triangles; pre- and 90 min post-dilation with a combination of salbutamol and ipratropium bromide) and during the three study visits (solid lines connecting open circles (pre-) and closed circles (90 min post-) tiotropium). On the first study visit, patients were tiotropium-free, while the other two study visits followed 3 and 6 weeks of tiotropium once-daily treatment with the last tiotropium intake on the day prior to the study visit; asterisks indicate any significant change 90 min after tiotropium (2-way ANOVA with Bonferroni; p < 0.05). B: Scond obtained from the Hyp− group.
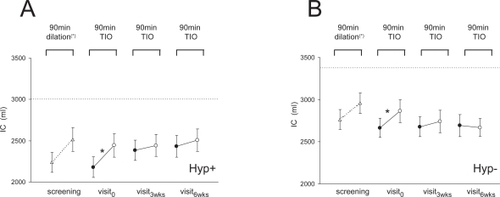
The Hyp− group showed no improvements in trough values of any parameter after 3 or 6 weeks of tiotropium bromide treatment. Another striking difference of the Hyp− with respect to the Hyp+ group is that FEV1 () and sGaw () showed highly significant intra-visit increases (p < 0.01 for both) on all study visits. By contrast, IC () only increased significantly (p = 0.03) on the baseline visit (p > 0.1 on visit3wks and visit6wks. While there were tendencies for intra-visit Scond decreases (ie, improvements) of the same order as that observed at the screening visit, averaging a 12% decrease over the three study visits, the Scond decrease failed to reach statistical significance (visit6wks: p = 0.053). As in the Hyp+ group, FEF75 and Sacin did not present any inter- or intra-visit effect of tiotropium bromide in the Hyp− subgroup (p > 0.1 for all).
Two supplementary analyses were performed to verify whether the observed patterns, that appear to be specifically linked to the presence of hyperinflation, were not a consequence of (a) the expected difference in disease severity (in terms of FEV1) between Hyp+ and Hyp− subgroups, and (b) the arbitrary choice of the median RV/TLC as a cut-off (in casu: RV/TLC = 55%) for the classification into Hyp+ and Hyp− subgroups. Hence we repeated the analysis of , but by considering FEV1 matched Hyp+ and Hyp− subgroups (n = 15; ), and by considering Hyp+ and Hyp− subgroups (n = 10; ) with only those patients corresponding to the 10 lowermost RV/TLC (<46%) and 10 uppermost RV/TLC (>59%) values. Despite some differences, the outcome of both supplementary analyses of and was very similar to that observed for the entire COPD population in .
Table 2 Characteristics of FEV1 matched subgroups with RV/TLC ≥ 55% (Hyp+) OR < 55% (Hyp−) and the effect of tiotropium
Table 3 Characteristics of COPD subgroups with RV/TLC > 59% (Hyp+) or <46% (Hyp−) and the effect of tiotropium
Discussion
This study shows a very distinct pattern of tiotropium bromide-induced improvement of airflow (FEV1) and IC between COPD patients with a high degree of hyperinflation (Hyp+) and COPD patients with low degree of hyperinflation (Hyp−), in that only the Hyp+ group showed significant increases in trough FEV1 and IC values. No such sustained improvement was observed for ventilation heterogeneity in either group. In fact, reduction in ventilation heterogeneity was confined to the conductive airway compartment, was of limited magnitude, and followed a very similar pattern across both COPD groups. The discrepancy between the behavior of IC and ventilation heterogeneity in the hyperinflated COPD subgroup, makes it unlikely that small airways are implicated in the sustained improvements of IC observed by us and others. The modest intra-visit Scond decreases (reaching p = 0.05 significance on only one occasion) imply that tiotropium bromide action is either affecting heterogeneity of the larger conductive airways (thus not affecting small airways heterogeneity) or acting in a very homogeneous way at the level of the small conductive airways (thus not affecting small airways heterogeneity). However, the absence of any FEF75 change with tiotropium bromide makes the latter possibility highly unlikely. Rather, the difference in patterns of sGaw improvements between Hyp− and Hyp+ groups, similar to that observed for IC and FEV1, suggests that larger airways or large lung units subtended by these large airways play a major role in the short- and long-term effect of tiotropium bromide.
The sustained improvement of FEV1 and IC after 3 and 6weeks of tiotropium bromide treatment only occurred in COPD patients with considerable hyperinflation (Hyp+). Nevertheless, while the Hyp− patients showed no long-term FEV1 or IC effects, their short-term FEV1 increases (90 min after tiotropium bromide) on each study visit were of the same magnitude as those obtained at baseline visit in Hyp+ patients. No such similarity between short-term improvements across both COPD subgroups was observed for IC. This indicates that the mechanism and site of bronchodilatation of tiotropium bromide (reflected in FEV1) are essentially the same in both COPD groups, but that when considerable hyperinflation is present, a continued bronchodilating action has the additional benefit of relieving hyperinflation (reflected in an IC improvement). The similar degree of bronchodilation in both groups suggests that any potential effect of the baseline state of hyperinflation on pulmonary distribution of the tiotropium bromide aerosol was negligible. In addition, the observed large airway effect suggests that either tiotropium bromide deposition was effectively confined to the large conductive airways, or that this was the only effective site of tiotropium bromide action on M3 receptors.
The trough IC and FEV1 values in the Hyp+ group after 3 and 6 weeks of tiotropium bromide treatment were indistinguishable from the respective peak values seen at the baseline visit 90 min after tiotropium bromide. This contrasts with previous studies (Citationvan Noord et al 2000; CitationVincken et al 2002; CitationBrusasco et al 2003; CitationCelli et al 2003; CitationO’Donnell et al 2004; CitationMaltais et al 2005; CitationNiewoehner et al 2005; CitationVerkindre et al 2006) where trough FEV1 and/or IC generally increased to a value intermediate between baseline and peak value, such that study visits after several weeks of tiotropium bromide treatment still showed room for FEV1 or IC improvement. Three factors should be considered when comparing our study with previous ones. Firstly, over 90% of the COPD patients under study here were on a combination of a long-acting β2 agonist and inhaled steroid treatment, with tiotropium bromide as an add-on study medication, as opposed to most previous studies where long-acting β2 agonists were not permitted. This may account for some quantitative differences of tiotropium bromide effects with respect to previous studies (here, typical changes in FEV1 trough value are 10% baseline in Hyp+ patients). Secondly, in those previous studies where hyperinflation was not part of the inclusion criteria, the COPD groups under study may have been a mixture of patients with a range of hyperinflation. One would then expect a pattern which is intermediate to that seen in our Hyp+ and Hyp− groups, corresponding to a partial increase in trough FEV1 and IC values between baseline and treatment visits, and an additional intra-visit increase from trough to peak FEV1 or IC value. Thirdly, the method of IC measurement varied across previous tiotropium bromide studies, using the difference between spirometric volume levels corresponding to FRC and TLC (corresponding to IC here) or that derived from plethysmographic FRC and TLC measurements (corresponding to ICpl here). The pitfalls inherent to plethysmographic volume determination in COPD have been documented before (CitationRodenstein and Stanescu 1982) and the difference between IC and ICpl behavior across to emphasizes the interpretation problems with plethysmographically determined lung volumes.
In conclusion, we have observed a pattern of improved airflow (FEV1) and inspiratory lung capacity (IC) with tiotropium bromide in COPD patients, which was linked to their degree of hyperinflation at baseline. In patients with a low degree of hyperinflation, FEV1 and IC showed consistent increases, but no sustained changes in trough FEV1 or IC. By contrast, in COPD patients with considerable hyperinflation at baseline, 3 weeks of tiotropium bromide treatment elicited improvements in trough IC and FEV1, close to the maximum obtainable value. The concomitant sGaw changes suggest that the main therapeutic effect is elicited in the large conductive airways. Ventilation heterogeneity of the acinar airways was unaffected by tiotropium bromide, and the modest improvements in ventilation heterogeneity of the conductive airways were unrelated to changes in hyperinflation.
References
- BarnesPJBelvisiMGMakJC1995Tiotropium bromide (Ba 679 BR), a novel long-acting muscarinic antagonist for the treatment of obstructive airways diseaseLife Sci56853910188785
- CelliBZuWallackRWangS2003Improvement in resting inspiratory capacity and hyperinflation with tiotropium in COPD patients with increased static lung volumesChest1241743814605043
- VerkindreCBartFAguilaniuB2006The effect of tiotropium on hyperinflation and exercise capacity in chronic obstructive pulmonary diseaseRespiration73420716484769
- BrusascoVHodderRMiravitllesM2003Health outcomes following treatment for six months with once daily tiotropium compared with twice daily salmeterol in patients with COPDThorax5839940412728159
- VinckenWvan NoordJAGreefhorstAP2002Improved health outcomes in patients with COPD during 1 yr’s treatment with tiotropiumEur Respir J192091611871363
- CasaburiRMahlerDAJonesPW2002A long-term evaluation of once-daily inhaled tiotropium in chronic obstructive pulmonary diseaseEur Respir J192172411866001
- van NoordJABantjeTAElandME2000A randomised controlled comparison of tiotropium and ipratropium in the treatment of chronic obstructive pulmonary disease. The Dutch Tiotropium Study GroupThorax552899410722768
- CasaburiRKukafkaDCooperCB2005Improvement in exercise tolerance with the combination of tiotropium and pulmonary rehabilitation in patients with COPDChest1278091715764761
- O’DonnellDEFlugeTGerkenF2004Effects of tiotropium on lung hyperinflation, dyspnoea and exercise tolerance in COPDEur Respir J238324015218994
- MaltaisFHamiltonAMarciniukD2005Improvements in symptom-limited exercise performance over 8 h with once-daily tiotropium in patients with COPDChest12811687816162703
- DusserDBravoMLIaconoP2006The effect of tiotropium on exacerbations and airflow in patients with COPDEur Respir J275475516507855
- NiewoehnerDERiceKCoteC2005Prevention of exacerbations of chronic obstructive pulmonary disease with tiotropium, a once-daily inhaled anticholinergic bronchodilator: a randomized trialAnn Intern Med1433172616144890
- GrossNJ2004Tiotropium bromideChest12619465315596697
- BarnesPJ2004Distribution of receptor targets in the lungProc Am Thorac Soc13455116113456
- VerbanckSSchuermansDMeysmanM2004Noninvasive assessment of airway alterations in smokers: the small airways revisitedAm J Respir Crit Care Med1704141915130906
- VerbanckSSchuermansDVan MuylemA1997Ventilation distribution during histamine provocationJ Appl Physiol831907169390962
- VerbanckSSchuermansDVan MuylemA1998Conductive and acinar lung-zone contributions to ventilation inhomogeneity in COPDAm J Respir Crit Care Med157157379603140
- VerbanckSSchuermansDNoppenM1999Evidence of acinar airway involvement in asthmaAm J Respir Crit Care Med15915455010228124
- RodensteinDOStanescuDC1982Reassessment of lung volume measurement by helium dilution and by body plethysmography in chronic air-flow obstructionAm Rev Respir Dis126104047181224
Appendix
Ventilation distribution testing
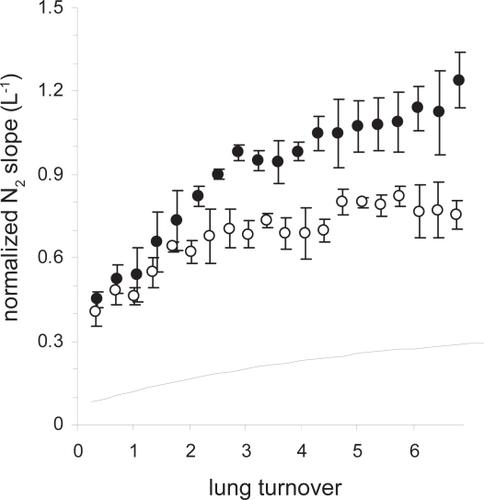
The ventilation distribution test, ie, the multiple breath washout (MBW), was carried out using a computer-controlled bag-in-box breathing assembly. Tidal volume was targeted at 1 L and after a period of air breathing with stable end-expiratory lung volume at functional residual capacity, inspired air was switched to the test gas mixture. The test gas mixture consisted of pure O2, and 1 L tidal breathing continued for 20–25 breaths depending on the subject’s lung volume (dilution); exhaled N2 concentration tracings were analyzed. From the MBW N2 tracings, indices Scond and Sacin were derived to represent the conductive and acinar components of ventilation heterogeneity, respectively, using an analysis that can be summarized as follows. During each expiration, the N2 phase III slope is computed and normalized by the mean expired N2 concentration. This leads to a normalized N2 slope (Sn) which increases as a function of breath number or lung turnover (); lung turnover is determined as the cumulative expired volume divided by ventilated functional residual capacity, which is computed from a mass balance of the MBW test. On theoretical grounds it can be shown that: (a) the rate of rise of the Sn curve is due to the convective flow asynchrony between lung units larger than acini, thus, due to heterogeneity originating in the conductive airways; (b) the offset of the Sn curve is mainly determined by diffusion-convection dependent heterogeneity generated in the acinar airways. Hence, Scond is simply computed as the rate of Sn increase as a function of lung turnover, between 1.5 and 6 lung turnovers. Then, Sacin is computed as the Sn value of the first MBW expiration minus a correction term to discard any conductive lung zone contribution; this correction term equals the lung turnover corresponding to the first breath, multiplied by Scond. Illustrated in are two selected COPD patients who show a similar Sacin (0.39 L−1 and 0.41 L−1) and markedly different Scond (open and closed circles correspond to respectively Scond = 0.049 L−1 and closed circles to Scond = 0.098 L−1). A normalized slope curve corresponding to a typical normal subject (dotted line) corresponds to Sacin and Scond values of 0.072 L−1 and 0.029 L−1, respectively.
The theory of MBW phase III slope analysis leading to indices Scond and Sacin implies that ventilation heterogeneity can be attributed to different lung depths, ie, to the conductive and acinar lung zone, respectively, and that Scond and Sacin are intrinsically independent and are not comparable between each other (despite having the same dimension, L–1). Finally, since Scond and Sacin are derived from phase III slopes, their value increases when ventilation heterogeneity increases. In particular, Sacin will increase if ventilation heterogeneity is increased in the acinar lung zone, due to an alteration of the intra-acinar asymmetry (eg, unequal narrowing of affected respiratory bronchioles). On the other hand, Scond will increase when heterogeneous narrowing of conductive airways induces an alteration in the specific ventilation and/or flow asynchrony between the lung units subtended by these airways proximal to the terminal bronchioles.
Figure A1 Normalized N2 phase III slopes (mean ± SD) as a function of lung turnover obtained in two patients participating in this study (open and closed circles); also represented is an idealized curve corresponding to normal normalized N2 phase III slopes (dotted line).
An increase in Scond reflects uneven narrowing of either the large or the small conductive airways, or both. A disproportionate Scond increase with respect to the decrease of large airway parameters such as FEV1 or specific airway conductance can be used to identify the small airways component of conductive lung zone heterogeneity. An increase in Sacin represents a change in intra-acinar structural asymmetry, due to uneven narrowing of respiratory bronchioles or due to partial destruction of parenchyma, or both. Again, a disproportionate Sacin increase with respect to a decrease of diffusion capacity enables the identification of the nonemphysematous component of acinar lung zone heterogeneity.