Abstract
Introduction
The balance between TH1, TH2, TH17, and regulatory T cells has been suggested to be disturbed in type 1 diabetes (T1D). We investigated this balance in peripheral blood mononuclear cells (PBMC) from children at risk of developing T1D and children with T1D.
Methods
We studied PBMC expression levels of markers related to TH1 (T-bet, IL-12Rβ1, IL-12Rβ2), TH2 (GATA-3, IL-4Rα), TH17 (IL-17A), and regulatory T cells (Foxp3, ICOS, and CTLA-4) with real-time polymerase chain reaction from 17 children with T1D, 13 children with β-cell autoimmunity, 15 children with T1D risk-associated human leukocyte antigen (HLA) haplotypes, and 24 healthy, control children.
Results
We observed decreased expression levels of GATA-3 by PBMC of healthy children with autoantibodies compared to healthy, control children (p = 0.014) or children with HLA risk alleles (p = 0.032). Children with T1D demonstrated lower expression levels of T-bet, IL-12Rβ1, and IL-4Rα both at diagnosis and 12 months later.
Conclusion
We found no indication of aberrant activation of TH1, TH17, or Treg in peripheral blood from children with or without risk of T1D. The observed immunological differences between children at risk of and with T1D should be considered when immunopathogenesis of β-cell destruction is studied.
Introduction
The expression profile of T-cell transcription factors and cytokine receptors reflects the activation status of the immune system. The functional arms of the adaptive immune system includes T helper (TH)1, TH2, TH17, and regulatory T cells (Treg), and the balance between these may be aberrant in immune-mediated disease.
Interleukin-12 (IL-12) is a strong promoter of TH1 immune responses and the T cell response to IL-12 is dependent on the expression of the high affinity IL-12 receptor (IL-12R). This receptor consists of β1 and β2 subunits, which are both necessary for signal transduction. The IL-12Rβ1 subunit can be detected on resting T-cells, but the β2 subunit is induced only upon antigen activation (CitationSzabo et al 1997). Signals via the IL-12R upregulate T-bet, a protein primarily expressed in TH1 cells (CitationSzabo et al 2000), but also in type 1 cytotoxic T (TC1) cells (CitationSullivan et al 2003) and dendritic cells (CitationLugo-Villarino et al 2003). In TH cells, T-bet, together with interferon-gamma (IFN-γ), forms an autoregulatory positive feedback loop to maintain a TH1 response and inhibit IL-5 production (CitationLametschwandtner et al 2004).
GATA-3 and the IL-4 receptor (IL-4R) are believed to be crucial for the development and maintenance of a TH2 phenotype. IL-4R regulates the production of cytokines such as IL-4, IL-5, and IL-13 through GATA-3 in TH2 cells (CitationSzabo et al 2003), and a recent study shows that Tc2 cells also express GATA-3 (CitationChen et al 2005).
The ratio between T-bet and GATA-3 expression levels, as a measure of TH1 and TH2 immune responses, has been implicated in different autoimmune diseases, such as rheumatoid arthritis (RA), idiopathic thrombocytopenic purpura (ITP), and systemic lupus erythematosus (SLE) (CitationKawashima and Miossec 2005; CitationWang et al 2005; CitationChan et al 2006).
A new subset of T cells, distinct from TH1 and TH2, has recently been classified and named TH17. This subset of cells develops from naïve T cells in response to IL-23 (CitationHarrington et al 2005; CitationPark et al 2005; CitationWynn 2005) and has the ability to produce IL-17A, IL-17F, and IL-22 (CitationAggarwal et al 2003; CitationZheng et al 2007), which are potent proinflammatory cytokines (CitationKolls and Linden 2004). TH17 cells seem to be central in the development of pathogenic tissue destruction in multiple sclerosis and rheumatoid arthritis (CitationKotake et al 1999; CitationHwang and Kim 2005; CitationKebir et al 2007).
Regulatory T cells (Treg) are characterized by expression of CD25, CTLA-4, and Foxp3 and play an active role in downregulating immune responses. Foxp3 seems to be a key factor in the development and function of naturally occurring Treg (CitationHori et al 2003), and decreased Foxp3 mRNA levels have been observed in patients with autoimmune diseases (CitationHuan et al 2005). Recent studies have, on the other hand, shown that Foxp3 is upregulated upon T-cell activation and results in hyporesponsiveness of the activated T-cell (CitationMorgan et al 2005; CitationWang et al 2007).
In type 1 diabetes (T1D), a functional imbalance between TH1, TH2, and Treg cells has been suggested by several research groups, including our own (CitationRabinovitch et al 1996; CitationShimada et al 1996; CitationHalminen et al 2001; CitationKukreja et al 2002; CitationFaresjo et al 2006), whereas the role of TH17 cells in human T1D is not known. Since hyperglycemia, ketoacidosis, or insulin treatment may affect immune cells, we studied the balance between markers of TH1, TH2, TH17, and Treg cells in peripheral blood mononuclear cells (PBMC) from children at risk of T1D and diabetic children followed during the first year after diagnosis.
Materials and methods
Subjects
The study includes a total of 69 children. Forty-four children participated in the population-based ABIS study (All Babies in south-east Sweden) (mean age 5.3 years; range 5.0–6.0 years). The ABIS study is a population-based follow-up study of all infants born between October 1st, 1997 and October 1st, 1999, in which newborns have been followed prospectively. Among the children participating in the ABIS study we selected 15 children (mean age 5.4 years; range 5.0–6.0 years) expressing human leukocyte antigen (HLA) class II haplotypes associate with an increased risk for T1D development (HLA-DR3-DQ2 or HLA-DR4-DQ8), without autoantibody production, and 13 children (mean age 5.3 years; range 5.1–5.7 years) who were autoantibody positive for GADA and/or IA-2A and/or IAA (11 of whom also expressed HLA haplotypes associated with increased risk for T1D). Antibody levels above the 98th percentile for GADA and IAA and the 99th percentile for IA-2 were regarded as positive values.
Sixteen ABIS children (mean age 5.3 years; range 5.0–5.6 years) who did not express the T1D risk-associated HLA alleles and were negative for autoantibodies were used as healthy controls for the children at risk for T1D development.
The T1D patients consisted of 17 children (mean age 10.4 years; range 6.0–15.6 years) treated at the Pediatric Clinic, Linköping University hospital. Children with T1D were followed with samples taken ten days, three months (range 1–3 months), and one year (range 9–18 months) after diagnosis. At the same time points glycosylated hemoglobin (HbA1c) values were recorded. Eight children with a mean age of 11.7 years (range 11.0–12.8 years) were enrolled from a nearby school and used as controls for the diabetic children. These children did not have any family members with autoimmune disease or allergy and were regarded as healthy.
Measurement of autoantibodies
Levels of autoantibodies against glutamic acid decarboxylase (GAD), tyrosine phosphatase-like insulinoma antigen 2 (IA-2) and insulin were analyzed in serum by radiobinding assay described previously (CitationHolmberg et al 2006).
In the Diabetes Autoantibody Standardization Program (DASP) 2005 for GADA, we observed a specificity of 96% and sensitivity of 76%, for IA-2A, a specificity of 100% and sensitivity of 72%, and for IAA, a specificity of 100% and a sensitivity of 30%.
Results were expressed as concentrations of autoantibodies calculated in relation to a standard curve.
HLA genotyping
HLA genotyping was done using biotinylated primers for DQB1, DQA1, or DRB1 genes. The amplified regions were, after denaturation, hybridized with a mix of sequence specific probes labeled with various lanthanide (europium, samarium, and terbium) chelates.
Specific signals for each label were measured by time-resolved fluorometry after washes and addition of enhancement solution. Details of the method, including primer and probe sequences, have been described previously (CitationSjoroos et al 1998; CitationNejentsev et al 1999).
Preparation of samples
Human PBMC were isolated from peripheral blood by Ficoll-Paque™ (Amersham Biosciences AB, Uppsala, Sweden) density gradient centrifugation and stored in liquid nitrogen until further analysis.
Real-time polymerase chain reaction
PBMCs were analyzed for expression of GATA-3, T-bet, IL-4Rα, IL-12Rβ1, IL-12β2, IL-17A, Foxp3, ICOS, and CTLA-4 using real-time polymerase chain reaction (PCR).
Briefly, total ribonucleic acid (RNA) was extracted from unstimulated PBMC using the GenElute Mammalian total RNA kit® (Sigma, St. Louis, MO, USA). Genomic DNA were eliminated by an additional treatment with DNAse I (0.01 U/μL) (Roche Diagnostics, Mannheim, Germany), after which RNA was converted to complementary DNA (cDNA) according to the manufacturer’s protocol, using random hexamers and Multiscribe Reverse transcriptase (Applied Biosystems, Foster City, CA, USA). Reactions were carried out in a total volume of 20 μL.
mRNA expression was determined by the TaqMan method of real-time PCR, with ribosomal 18s RNA (rRNA) as endogenous control. TaqMan Universal PCR master mix with AMPerase UNG and the primers and probes for rRNA (cat.no. Hs99999901_s1), GATA-3 (cat.no. Hs00231122_m1), T-bet (cat.no. Hs00203436_m1), IL-4Rα (cat.no. Hs00166237_m1), IL-12Rβ1 (cat.no. Hs00234651_m1), IL-12Rβ2 (cat.no. Hs00155486_m1), IL-17A (cat.no. Hs00174383_m1), ICOS (cat.no. Hs00359999_m1), CTLA-4 (cat.no. Hs00175480_m1), and Foxp3 (cat.no. Hs00203958_m1) were purchased from Applied Biosystems.
Each measurement was performed in triplicate with 1.8 μL of cDNA, except for IL-17A where 18 μL cDNA was used. The thermal cycle conditions were set with an initial step of 2 min at 50 °C and 10 min at 95 °C, followed by 50 cycles of 15 s at 95 °C and 1 min at 60 °C. Water was included as no template control (NTC).
The comparative Ct method described by the manufacturer is used to calculate a relative transcription value. For presentations, the relative amount of target genes was multiplied by 100.
Characteristics of subjects
Children participating in the ABIS study had an overall mean age of 5.4 years (range 5.0–6.0 years) and included 18 girls and 26 boys.
Diabetic children included nine girls and eight boys with a mean age of 10.4 years (ranging from 6.0 to 15.6 years). At diagnosis, the median value of HbA1c was 10.3% (range 8.4–11.7) but improved during follow-up. At three months, the median was 5.1% (range 3.9–8.5) and at twelve months the median was 6.2% (range 4.7–8.2). Insulin requirements were between 0.4 and 1.4 U/kg/24 h at three months, and between 0.5–1.7 U/kg/24h at twelve months. The eight schoolchildren enrolled as controls included three girls and five boys, with the mean age of 11.7 years (range 11.0–12.8).
Statistical analysis
Since the levels of mRNA were not normally distributed, non-parametric tests, corrected for ties, were used. Comparisons between unpaired groups were analyzed with Kruskal-Wallis as a pretest and Mann-Whitney U test was used for comparison of two unrelated groups. Friedman test was used for analysis between paired groups and correlations were analyzed with Spearman’s rank correlation test.
A p-value below 0.05 was considered significant without corrections for multiple comparisons (CitationPerneger 1998). All calculations were performed with the statistical package SPSS 14.0 (SPSS Inc., Chicago, IL, USA).
Ethics
Informed consent was obtained from all children and parents, and the regional Research Ethics Committee of the Faculty of Health Sciences, Linköping approved the study.
Results
Activation stage of peripheral blood mononuclear cells in healthy children at risk of type 1 diabetes
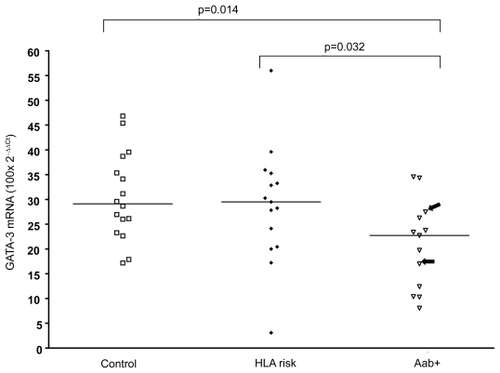
PBMC of high-risk individuals, defined as children with β-cell autoantibodies and HLA risk genotype, demonstrated lower expression levels of GATA-3 in PBMC than healthy control children (p = 0.014) (see ) and children expressing an HLA risk genotype but without autoantibodies (p = 0.032). The children with genetic risk alone did not differ from the control children without genetic risk.
Figure 1 Levels of GATA-3 specific mRNA in PBMC was lower in children with β-cell autoantibodies (Aab+) than control children (Control) and children with HLA risk genotype (HLA risk). Two children with autoantibodies but without HLA risk genotype are marked with arrows. Horizontal lines indicate median values and p-values of Mann-Whitney U-test are shown in the figure.
Abbreviations: HLA, human leukocyte antigen; PBMC, peripheral blood mononuclear cells.
The amount of IL-17A expressed in PBMC was low but using ten times more cDNA, between 77%–88% of the individuals in each group had measurable levels but no differences in IL-17A expression or expression of T-bet, IL-4Rα, IL-12Rβ1, IL-12β2, Foxp3, ICOS, and CTLA-4 was found between healthy children at risk compared to those without risk (data not shown).
Activation stage of peripheral blood mononuclear cells in children with T1D
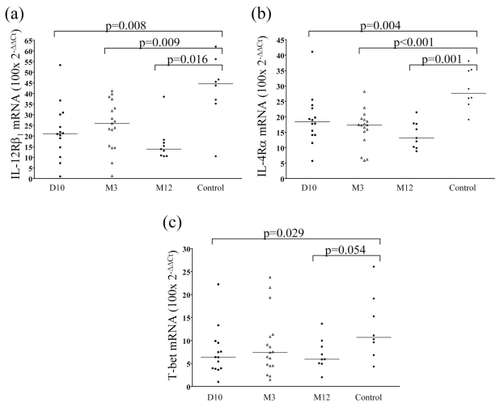
In the PBMC of patients with T1D, mRNA levels of IL-12Rβ1 (see ) and IL-4Rα (see ) were lower compared to the healthy control children. This difference was observed in samples taken at diagnosis of the disease (day 10) as well as in samples taken three and 12 months following diagnosis. The expression of T-bet (see ) was also significantly lower at diagnosis compared to controls, but the same tendency was not observed in subsequent samples.
Figure 2 Relative expression level of specific mRNA in PBMC from children with T1D at different duration and in healthy control children. The levels of IL-12Rβ1 mRNA (a) (type 1 marker), IL-4Rα mRNA (b) (type 2 marker) was lower at all time points, and T-bet mRNA (c) (type 1 marker) was decreased at diagnosis and after 12 month. Horizontal lines indicate median values and p-values of Mann-Whitney U-test are shown in the figure.
Abbreviations: HLA, human leukocyte antigen; PBMC, peripheral blood mononuclear cells; T1D, type 1 diabetes.
The levels of IL-17A, GATA-3, or IL-12Rβ2 specific mRNA did not differ between samples taken from diabetic children and healthy controls (data not shown).
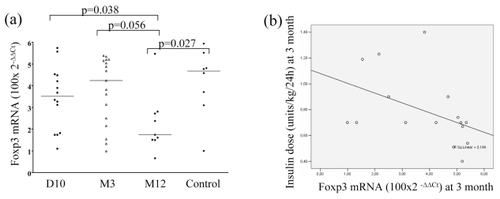
Foxp3 expression was lowest in samples taken at 12 months following diagnosis when it was significantly decreased when compared to the healthy control group (p = 0.027) (see ). At 12 months, the expression was lower than at diagnosis, and also tended to be lower than in samples taken at three months after diagnosis (p = 0.038 and p = 0.056, respectively). The expression of ICOS or CTLA-4 did not differ between the groups (data not shown).
Figure 3 (a) Foxp3 mRNA expression (Treg marker) was lower after 12 month (M12) after diagnosis than earlier during the follow-up in children with T1D, and also when compared to healthy controls. (b) Relative expression level of Foxp3 mRNA shows a negative correlation with insulin dose (units/kg/24 h) at 3 months (R = −0.541; p = 0.03).
Expression of measured marker did not show significant changes in the T1D children during follow-up using paired analysis (data not shown).
The relation of insulin dose, HbA1c, and autoantibodies to transcription factors in diabetic children
At three months of diabetes duration we observed a negative correlation between insulin dose per kg body weight, 24 hours, and the level of Foxp3 (R = −0.541; p = 0.030) (see ). We found no significant correlations between immune activation stage of PBMC and HbA1c or autoantibodies (data not shown).
Discussion
Deviation of T cell responses, including TH1, TH2, and TH17 cells together with Treg activity, may contribute to the development of a chronic (auto)immune responses, as in T1D. We compared the expression of transcription factors, as markers for functional T cell subsets, in ex vivo derived peripheral PBMC from diabetic and healthy children. As our interest was to evaluate ex vivo expression levels of factors responsible for T cell differentiation in unstimulated PBMC, we were not able to measure secreted cytokines since in unstimulated circulating cells, cytokine secretion is low, or even undetectable, for most cytokines.
In the group of at-risk individuals, ie, children with β-cell autoantibodies, a decreased expression of GATA-3 in PBMC was the only aberrancy found in comparison to healthy age-matched children. Inhibition of GATA-3 seems to be more important than increased levels of T-bet for the production of IFN-γ (CitationChakir et al 2003), and thus the low levels of GATA-3 could support the development of TH1 responses that may be capable of destruction of β-cells. However, we did not see any difference in expression levels of T-bet or IL-12R, and thus this is rather speculative. The major finding in individuals positive for β-cell autoantibodies is that unstimulated peripheral blood reflects poorly the immune aberrancies related to β-cell autoimmunity leading to β-cell destruction. This is in agreement with the view that T1D is not a systemic autoimmune disease.
In contrast to children at-risk of T1D, diabetic children exhibited lower expression levels of T-bet, IL-12Rβ1, and IL-4Rα both at diagnosis and 12 months later compared to healthy children. These data suggest poor TH1 immune activation in peripheral blood from the children with recent-onset clinical diabetes and are in good agreement with earlier studies showing decreased expression of IFN-γ transcripts in peripheral blood of diabetic patients (CitationHalminen et al 2001). Altogether, our results indicate that no general activation of type 1 immune responses are observed in peripheral blood of children with T1D or that of children at-risk of T1D, despite the earlier findings of high IFN-γ response to stimulation reported by some studies (CitationKallmann et al 1997).
The expression of IL-17A transcripts in PBMC was low in general and required ten times more templates in the PCR for IL-17A. This may indicate that the numbers of IL-17A positive cells or their functional upregulation are not increased in the peripheral blood in children with T1D or in risk individuals. If TH17 cells are involved in the pathogenesis of T1D, their role should, ideally, be studied locally in the population of T cells infiltrating the islets.
Foxp3 expression in unstimulated PBMC did not differ between healthy and newly diagnosed diabetic children, but the Foxp3 expression was decreased 12 months after diabetes diagnosis. Our earlier findings suggest that activation of Foxp3 occurs at the time of diagnosis as a response to insulin treatment (CitationTiittanen et al 2006). Interestingly, we observed a negative correlation between insulin dose and the Foxp3 levels at 3 months after diagnosis. This could indicate that the activation status of Treg cells near diagnosis may control the β-cell destruction and thus be related to the insulin dose needed. Since Foxp3 up-regulation is associated with T cell activation in humans (CitationWang et al 2007), the decrease of Foxp3 expression from diagnosis toward 12 months after diagnosis could be a result of fading autoimmune attack with final loss of β-cells.
We observed impaired type 1 responses in children with T1D, but this defect was not seen in children at risk of T1D, suggesting an immunological shift from prediabetes to diabetes. This raises the question of whether poor T cell activation in T1D is secondary to the metabolic disturbances in diabetes or whether it is related to the accelerated β-cell destruction seen at diagnosis. We did not observe any direct correlations between any of the measured markers and HbA1c values, suggesting that this aberrancy is not due to long-term hyperglycemia. It remains to be elucidated whether a peripheral decrease T cell activation is related to the initiation of autoaggressive β-cell destruction in the pancreas, when the disease progresses from silent autoimmunity towards clinical diabetes.
Our findings do not support a general activation of TH1 or TH17 responsiveness in children at risk of developing T1D or in children diagnosed with T1D. Rather, in the latter subject group, the data support a global downregulation of Th1, Th2, and Th17 responses. It should nevertheless be emphasized that the circulating lymphocytes may not always reflect the infiltrating T cells in the target tissue, and thus our results do not demonstrate the local changes of insulitis. It is important to realize that an immunological shift takes place from pre-diabetes to manifest T1D, as we and others (CitationJain et al 2008) have demonstrated, and this should be considered when the immuno-pathogenesis of β-cell destruction is studied.
Acknowledgments
We wish to thank the children and parents participating in this study. We thank Eva Isaksson, Ann-Marie Sandstöm, and Gunilla Hallström for recruitment of diabetic and healthy children and Harry Lybeck, Anneli Suomela, Ingela Johansson, Gosia Smolinska-Konefal, and Hanna Holmberg for technical assistance.
This study was supported by Swedish Child Diabetes Foundation (Barndiabetesfonden), Swedish Medical Research Council (MFR; Vetenskapsrådet, K2003-72X-14690-01A) and as a part of the ABIS study, supported by JDRF-Wallenberg foundations (K98-99JD-12813-01A), and the Swedish Medical Research Council (MFR; Vetenskapsrådet, K99-72X-11242-05A).
References
- AggarwalSGhilardiNXieMH2003Interleukin-23 promotes a distinct CD4 T cell activation state characterized by the production of interleukin-17J Biol Chem27819101412417590
- ChakirHWangHLefebvreDE2003T-bet/GATA-3 ratio as a measure of the Th1/Th2 cytokine profile in mixed cell populations: predominant role of GATA-3J Immunol Methods2781576912957404
- ChanRWLaiFMLiEK2006Imbalance of Th1/Th2 transcription factors in patients with lupus nephritisRheumatology (Oxford)45951716461436
- ChenXPFalknerDHMorelPA2005Impaired IL-4 production by CD8+ T cells in NOD mice is related to a defect of c-Maf binding to the IL-4 promoterEur J Immunol3514081715832295
- FaresjoMKVaaralaOThuswaldnerS2006Diminished IFN-gamma response to diabetes-associated autoantigens in children at diagnosis and during follow up of type 1 diabetesDiabetes Metab Res Rev224627016572494
- HalminenMSimellOKnipM2001Cytokine expression in unstimulated PBMC of children with type 1 diabetes and subjects positive for diabetes-associated autoantibodiesScand J Immunol53510311309160
- HarringtonLEHattonRDManganPR2005Interleukin 17-producing CD4+ effector T cells develop via a lineage distinct from the T helper type 1 and 2 lineagesNat Immunol611233216200070
- HolmbergHVaaralaOSadauskaite-KuehneV2006Higher prevalence of autoantibodies to insulin and GAD65 in Swedish compared to Lithuanian children with type 1 diabetesDiabetes Res Clin Pract723081416442659
- HoriSNomuraTSakaguchiS2003Control of regulatory T cell development by the transcription factor Foxp3Science29910576112522256
- HuanJCulbertsonNSpencerL2005Decreased FOXP3 levels in multiple sclerosis patientsJ Neurosci Res81455215952173
- HwangSYKimHY2005Expression of IL-17 homologs and their receptors in the synovial cells of rheumatoid arthritis patientsMol Cells19180415879699
- JainRTartarDMGreggRK2008Innocuous IFNgamma induced by adjuvant-free antigen restores normoglycemia in NOD mice through inhibition of IL-17 productionJ Exp Med2052071818195074
- KallmannBAHutherMTubesM1997Systemic bias of cytokine production toward cell-mediated immune regulation in IDDM and toward humoral immunity in Graves’ diseaseDiabetes46237439000700
- KawashimaMMiossecP2005mRNA quantification of T-bet, GATA-3, IFN-gamma, and IL-4 shows a defective Th1 immune response in the peripheral blood from rheumatoid arthritis patients: link with disease activityJ Clin Immunol252091415981085
- KebirHKreymborgKIferganI2007Human TH17 lymphocytes promote blood-brain barrier disruption and central nervous system inflammationNat Med131173517828272
- KollsJKLindenA2004Interleukin-17 family members and inflammationImmunity214677615485625
- KotakeSUdagawaNTakahashiN1999IL-17 in synovial fluids from patients with rheumatoid arthritis is a potent stimulator of osteoclastogenesisJ Clin Invest10313455210225978
- KukrejaACostGMarkerJ2002Multiple immuno-regulatory defects in type-1 diabetesJ Clin Invest1091314011781358
- LametschwandtnerGBiedermannTSchwarzlerC2004Sustained T-bet expression confers polarized human Th2 cells with Th1-like cytokine production and migratory capacitiesJ Allergy Clin Immunol1139879415131585
- Lugo-VillarinoGMaldonado-LopezRPossematoR2003T-bet is required for optimal production of IFN-gamma and antigenspecific T cell activation by dendritic cellsProc Natl Acad Sci U S A10077495412802010
- MorganMEvan BilsenJHBakkerAM2005Expression of FOXP3 mRNA is not confined to CD4+CD25+ T regulatory cells in humansHum Immunol66132015620457
- NejentsevSSjoroosMSoukkaT1999Population-based genetic screening for the estimation of Type 1 diabetes mellitus risk in Finland: selective genotyping of markers in the HLA-DQB1, HLA-DQA1 and HLA-DRB1 lociDiabet Med169859210656226
- ParkHLiZYangXO2005A distinct lineage of CD4 T cells regulates tissue inflammation by producing interleukin 17Nat Immunol611334116200068
- PernegerTV1998What’s wrong with Bonferroni adjustmentsBr Med J (Clin Res Ed)31612368
- RabinovitchASuarez-PinzonWEl-SheikhA1996Cytokine gene expression in pancreatic islet-infiltrating leukocytes of BB rats: expression of Th1 cytokines correlates with beta-cell destructive insulitis and IDDMDiabetes45749548635648
- ShimadaARohanePFathmanCG1996Pathogenic and protective roles of CD45RB(low) CD4+ cells correlate with cytokine profiles in the spontaneously autoimmune diabetic mouseDiabetes457188522063
- SjoroosMIlonenJReijonenH1998Time-resolved fluorometry based sandwich hybridisation assay for HLA-DQA1 typingDis Markers149199706458
- SullivanBMJuedesASzaboSJ2003Antigen-driven effector CD8 T cell function regulated by T-betProc Natl Acad Sci U S A100158182314673093
- SzaboSJDigheASGublerU1997Regulation of the interleukin (IL)-12R beta 2 subunit expression in developing T helper 1 (Th1) and Th2 cellsJ Exp Med185817249120387
- SzaboSJKimSTCostaGL2000A novel transcription factor, T-bet, directs Th1 lineage commitmentCell1006556910761931
- SzaboSJSullivanBMPengSL2003Molecular mechanisms regulating Th1 immune responsesAnnu Rev Immunol217135812500979
- TiittanenMHuupponenJTKnipM2006Insulin treatment in patients with type 1 diabetes induces upregulation of regulatory T-cell markers in peripheral blood mononuclear cells stimulated with insulin in vitroDiabetes5534465417130491
- WangJIoan-FacsinayAvan der VoortEI2007Transient expression of FOXP3 in human activated nonregulatory CD4+ T cellsEur J Immunol371293817154262
- WangTZhaoHRenH2005Type 1 and type 2 T-cell profiles in idiopathic thrombocytopenic purpuraHaematologica909142315996929
- WynnTA2005T(H)-17: a giant step from T(H)1 and T(H)2Nat Immunol610697016239919
- ZhengYDanilenkoDMValdezP2007Interleukin-22, a T(H)17 cytokine, mediates IL-23-induced dermal inflammation and acanthosisNature4456485117187052