Abstract
Aim:
To investigate if pain area in patients with chronic pain could be measured by a computerized assessment on previously marked pain drawings on paper figures and to analyze the further application of the method.
Methods:
Seventy-two patients (54 women and 18 men) who were admitted to Umeå University Hospital during 2003 for assessment of chronic pain answered a set of questionnaires (pain intensity on the visual analog scale [VAS], disability on the Disability Rating Index [DRI], life satisfaction on the LiSat-11) and filled in pain drawings on paper figures of the human body. The pain drawings were later analyzed by using computerized assessment.
Results:
Women marked a greater pain area than men, but the difference was not significant (p =0.433). No significant difference was shown for the previous seven days between men and women on the VAS (p =0.914), DRI (p =0.493), or LiSat-11 (p =0.124). A statistically significant correlation was found between pain area and VAS for the previous seven days (r =0.250; p =0.046). Pain area was statistically significantly correlated to the DRI (r =0.336; p =0.014) and close to negatively correlated to the LiSat-11 (r =0.687; p =0.057).
Conclusion:
This pilot study shows that pain drawing area could be measured by a computerized assessment of pain drawings. The method points to the possibility of relating pain area with other instruments. In the present study, an association between the patients’ pain drawing area and pain intensity and between pain area and level of activity was shown.
Introduction
Pain is “an unpleasant sensory and emotional experience associated with actual or potential tissue damage, or described in terms of such damage”.Citation1 Pain that persists beyond 3–6 months is classified as chronic. Chronic pain is very common with a prevalence of 40%–65%.Citation2–Citation4
In Sweden, musculoskeletal disorders are the most commonly reported reason for pain with 15% of men and 21% of women describing long-term suffering. During recent years, chronic pain has become a major health problem because of its high frequency and increasing financial costs. Moreover pain, especially chronic pain, is one of the most common causes for seeking medical care. It is estimated that 20%–40% of patients treated by general practitioners suffer from different pain conditions.Citation5,Citation6
Since pain is a subjective multidimensional experience with consequences on daily life,Citation7 clinical assessment may address several aspects of pain experience. One of the most important issues to be assessed in patients with long-lasting pain is information about pain distribution and pain sensation. In clinical practice, pain drawings have commonly been used for evaluation and diagnostic classification of pain patients. These instruments have been used since the 1940s and consist of simple line drawings on which patients can indicate their pain.Citation8,Citation9 Several possibilities for the clinical use of pain drawings have been suggested such as to distinguish organic pain from functional/psychogenic pain,Citation10–Citation12 for assessment of neuropathic pain,Citation13 for assessment of patients with lumbago-sciatica and herniated intervertebral discs. The subjective pain drawings done by patients have been shown to correspond to computerized tomography findings.Citation14
Since psychological factors may influence how pain is experienced, a number of scoring systems have been used to quantify the pain drawings in order to identify persons with psychological complications.Citation12,Citation15 Moreover, several studies have focused on pain drawings as a diagnostic tool to assist in diagnostic classification and treatment determination.Citation12,Citation16 For more than a decade, computerized pain drawings have been suggested as a possible means of developing assessments for patients with chronic pain.Citation17
Most of the previous studies of computer-based scoring of pain drawings have focused on the anatomic distribution of pain marking. In several studies, artificial neural networks have been used to classify the drawings into diagnostic categories.Citation18,Citation19 However, these studies did not include pain sensation. Although Sanders and colleaguesCitation20 assessed the contribution of patient-recorded pain sensation marks with this computer-based model, they could not improve the diagnostic results. The conditions in persons with chronic pain may often affect several aspects of daily life such as the level of activity and the total experience of life satisfaction. To our knowledge, no studies of patients with chronic pain have been published in which computerized methods are used to analyze the marked pain area on pain drawings and to relate these findings to other instruments.
The aim of this pilot study was therefore to investigate if pain area could be measured by a computerized assessment on previously marked pain drawings on paper figures. In addition, the study aimed to analyze the further application of the method by relating pain area to pain intensity, activity level, and life satisfaction.
Methods
Patients and procedures
Seventy-two patients (54 women and 18 men, aged 22–60 years [41.0 ±9.4 years]) who were admitted for assessment to the Pain Rehabilitation Clinic at the Umeå University Hospital, Umeå, Sweden during 2003 because of chronic pain answered a set of questionnaires and filled in pain drawings on paper figures of the human body before assessment in the clinic. The pain drawings were later analyzed by using computerized assessment. All patients were admitted from the primary health care service. Their pain duration was 5.7 years. The most common diagnosis was whiplash injury 23%, cervicobrachialgia syndrome 18%, myalgia 14%, and lumbago 8%.
Patients were advised by written instruction to mark their pain distribution/location and kind of discomfort on the pain drawings on figures on paper using different symbols for burning, aching, tingling, pricking, cramp, etc. The questionnaires included self-rating of pain intensity on the visual analog scale (VAS),Citation21,Citation22 the level of activity on the Disability Rating Index (DRI),Citation23 and life satisfaction on the LiSat-11.Citation24
Computerized assessment of pain drawings
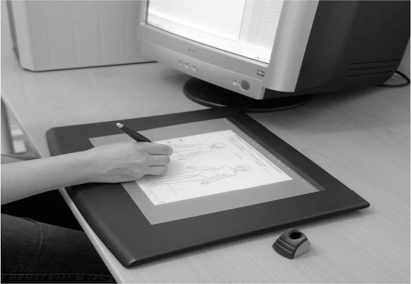
Pain drawings are standardized paper figures of the front and back of the human body. There are eight suggestions for describing discomfort using different symbols for burning, aching, tingling, pricking, cramp, etc (). The computerized assessment included the total area that had been marked by the patient previously. Areas that corresponded to numbness and muscle cramp were excluded since they might represent nonpainful symptoms. In addition, if there were areas marked outside the figure, these were also excluded. One of the authors (AW) registered the marked areas on the pain drawings with a digitizer pen and standard software (version 20.9.4; Quantify One, K:L:O:N:K, Sorø, Denmark) (). Quantify one is a program that quantifies areas and circumferences.Citation25 The program makes it possible to choose the type of measurement and to register lines as well as circles and dots. The pain drawings were put on the digitizer. The length of a continuous line and the area and perimeter of a continuous area were measured by setting the digitizer pen at the starting point of the line and then following the line with the pen. When the tip of the pen was lifted, the measurement result was registered and the next measurement began. The length of a point-to-point line and the area and the perimeter of a discrete area were measured by pointing the digitizer pen at the starting point and then pointing at each point with the pen. The pen was turned around and the digitizer was touched with the other side of the drawing pen. Points were counted by pointing with the pen at each object. The digitalized areas for all patients were transferred to the Excel program (Microsoft Corp., Redmond, WA, USA) and then to the SPSS program (SPSS Inc., Chicago, IL, USA).
Figure 1 Blank patient pain drawing.
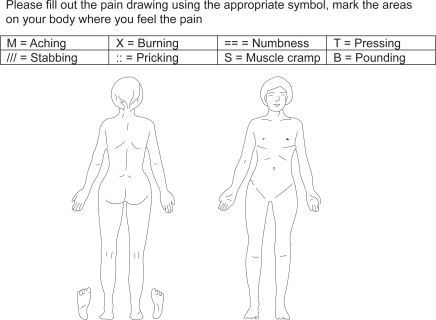
Figure 2 Computerized equipment.
Other instruments
The VASCitation21,Citation22 was used to rate the pain intensity for the previous seven days. The scale consists of a 100 mm straight line with defined end-points (“no pain” and “worst pain imaginable”) on which the participants were asked to mark their experienced pain (results in mm). The VAS is considered to have a high degree of reliability and validity.
The DRICitation23 is a validated instrument for assessment of the activity level. It includes 12 questions about ordinary activities such as walking, running, sitting, stand up, standing, load-bearing, lifting, etc. The patients score their level of activity on a line which is 100 mm (maximum 100 points for each question from 0 = no problem and 100 = cannot manage at all). A total index can be calculated.
Life satisfaction at follow-up was assessed using the LiSat-11 questionnaire which comprises 11 items.Citation24 One item addresses life as a whole while the other 10 items address vocation, economy, leisure, contacts, sexual life, activity of daily living (ADL), family life, partner, somatic health, and psychological health. Levels of satisfaction are estimated on a six-grade scale (from 1 = very dissatisfied to 6 = very satisfied) with higher scores indicating higher levels of life satisfaction. A total score can be calculated (range: 0–66).
Statistics
All statistical analysis was performed with SPSS (version 14.0 for Windows; SPSS Inc.). Data are reported as means ± standard deviations (SD) unless indicated otherwise. Comparisons of pain distribution, pain intensity, the level of disability and life satisfaction between men and women were made using the independent samples t-test. Pearson’s correlation coefficient was calculated for the analysis of correlations between pain distribution, VAS, DRI, and LiSat-11 bivariate correlations. The statistical significant level was set at 0.05. Data is presented as the means ± SD obtained by independent samples t-test.
Results
The estimated time consumption for the computerized assessment of the pain drawing for each patient was 11–15 minutes. In , the pain areas and the scores of the VAS, DRI, and LiSat-11 for all patients are shown.
Table 1 Pain areas and scores of the VAS, DRI, and LiSat-11 for all patients
A gender comparison showed that women marked a greater pain area, but the difference was not significant (p =0.433). No significant difference was shown between men and women on the VAS (p =0.914), VAS at the assessment (p =0.927), DRI (p =0.493), or LiSat-11 (p =0.124).
A weak but statistically significant correlation was found between pain area and the VAS (r =0.250; p =0.046) while the correlation between pain area and the VAS at assessment was close to significant (r =0.242; p =0.052). Pain area was statistically significant correlated to the disability level on the DRI (r =0.336; p =0.014) and close to negatively correlated to life satisfaction on the LiSat-11 (r =0.687; p =0.057).
Discussion
The present pilot study shows that the computerized assessment equipment for analyzing pain area was easy to use and the total pain area on the pain drawing was quickly registered for each patient. Although previous studies of digitalized pain drawings with different quantitative scoring methods have analyzed the spatial–anatomic distribution of pain markings, this study is the first to demonstrate that pain area on a paper figure was directly measured by an instrument particularly designed for area measurements and that the pain area was related to pain intensity and to the level of activity.
Pain drawings on paper figures are usually used to investigate the localization and distribution of pain. However, Bryner and colleaguesCitation26 used a computerized method that compared favorably to a manual self-rating of pain. In several of the previous studies of digitalized pain drawings, the pain drawings on paper have been scanned into a computer and stored in a database.Citation20 In the present study, the pain drawings were registered using a digitizer pen and standard software. Since the computer program makes it possible to register both circles and dots, the total pain area for each patient was digitalized adequately. Although the computerized assessment equipment in the present study was easy to use, the criteria for registering the pain drawings should be uniform to achieve an optimal evaluation of the results.
The limitation of this study included the fact that areas representing numbness and muscle cramp were excluded as these markings were not supposed to correspond convincingly to pain-related symptoms. Although only a few patients reported these sensations, it was probably a mistake not to include these marks. The information of pain sensations is often used in the diagnostic assessment. However, a previous study of digitalized pain drawing incorporated pain sensation into an artificial neural network, but the classification of the method was not improved.Citation20 A second limitation of our study could be that the computerized assessment might have been too strict since all marks and details on the pain drawings were registered.
This present study also investigated pain drawing area in relation to some other variables. A significant relationship was shown between pain drawing area and pain intensity on the VAS, a finding that agrees with two previous noncomputerized studies. Toomey and colleaguesCitation27 found that pain distribution expressed as a percentage of the total body area was correlated to pain intensity. George and colleaguesCitation28 also reported a significant correlation of pain area in a quantitative scoring system and pain intensity.
Chronic pain may affect daily life and the possibilities to perform common activities, which in our study are reflected by the relation between increased pain area and decreased activity levels. These results are also in agreement with some previous studies which have shown relationships between pain distribution and function limitations in work- and leisure-related activities.Citation27,Citation29
The conditions of long-lasting pain may also have consequences on several different aspects of life which may lead to decreased life satisfaction.Citation30 In the present study, a close to significant negative correlation was shown between pain area and life satisfaction, ie, life satisfaction decreased when the pain distribution increased. Similar results have previously been reported by Ektor-Andersen and colleaguesCitation31 who found that pain distribution expressed as increased number of marked pain areas on the pain drawing was related to decreased experience of health and increased mental stress.
Conclusion
Our pilot study indicates that it is possible to quantify the pain area on previously marked pain drawings on paper and that pain drawing area can be related to pain intensity and level of activity. The clinical implication of these results is that this method could be used to quantify the pain area in order to make repeated measurements of pain distributions between different time periods (before and after treatment and rehabilitation of patients with chronic pain) and different groups of patients. Systematic comparisons could also be made between the pain area and other variables. One possibility in the future could be that the patients themselves mark their pain directly on a digital pain drawing. Previous studies of computerized marked questionnaires and pain drawings made by patients have shown successful results.Citation17
In Sweden, because electronic patient records are used and several clinical quality registers are web-based with digital instruments and questionnaires, there will probably be some change of the pain drawings in the future. However, further studies are needed to evaluate the method used in the present study and to compare this method in larger populations with other alternatives and to study its cost-effectiveness. Moreover, further studies should also focus on comparisons between how a person enters pain marks on paper and how they do so when using a computer program.
Disclosures
The authors report no conflicts of interest in this work.
References
- MerskeyHBogdukNClassification of chronic pain, descriptions of chronic pain syndromes and definitions of pain termsSeattle, WAIASP Press1994
- AnderssonHIEjlertssonGLedenIChronic pain in a geographically defined general population: studies of differences in age, gender, social class, and pain localizationClin J Pain199391741828219517
- BrattbergGThorslundMWikmanAThe prevalence of pain in a general population. The results of a postal survey in a county of SwedenPain1989372152222748195
- GerdleBBjorkJHenrikssonCBengtssonAPrevalence of current and chronic pain and their influences upon work and healthcare-seeking: a population studyJ Rheumatol2004311399140615229963
- HasselstromJLiu-PalmgrenJRasjo-WraakGPrevalence of pain in general practiceEur J Pain2002637538512160512
- RekolaKEKeinänen-KiukaanniemiSTakalaJUse of primary health services in sparsely populated country districts by patients with musculoskeletal symptoms: consultations with a physicianJ Epidemiol Community Health1993471531578326275
- GurejeOVon KorffMSimonGEGaterRPersistent pain and well-being: a World Health Organization Study in Primary CareJAMA19982801471519669787
- MargolisRBChibnallJTTaitRCTest-retest reliability of the pain drawing instrumentPain19883349513380550
- OhnmeissDDRepeatability of pain drawings in a low back pain populationSpine20002598098810767812
- GinzburgBMMerskeyHLauCLThe relationship between pain drawings and the psychological statePain1988351411463237428
- OhlundCEekCPalmbaldSAreskougBNachemsonAQuantified pain drawing in subacute low back pain. Validation in a non-selected outpatient industrial sampleSpine19962110211030 Discussion, 1031.8724085
- RansfordAOCDMooneyVThe pain drawing as an aid to the psychologic evaluation of patients with low-back painSpine19761127134
- BertilsonBGrunnesjoMJohanssonSEStrenderLEPain drawing in the assessment of neurogenic pain and dysfunction in the neck/shoulder region: inter-examiner reliability and concordance with clinical examinationPain Med2007813414617305685
- OhnmeissDDVanharantaHGuyerRDThe association between pain drawings and computed tomographic/discographic pain responsesSpine1995207297337604350
- SivikTMPersonality traits in patients with acute low-back pain. A comparison with chronic low-back pain patientsPsychother Psychosom1991561351401836880
- OhnemeissDDRelationship of pain drawings to invasive tests assessing intervertebral disc pathologyEur Spine J1999812613110333151
- JamisonRNFanciulloGJBairdJCComputerized dynamic assessment of pain: comparison of chronic pain patients and healthy controlsPain Med2004516817715209971
- MannNH3rdBrownMDHertzDBEngerITompkinsJInitial-impression diagnosis using low-back pain patient pain drawingsSpine19931841538434324
- NorthRBMcNameeJPWuLPiantadosiSArtificial neural networks: application to electrical stimulation of the human nervous systemNeurosurg Focus19972e115096022
- SandersNWMannNH3rdSpenglerDMPain drawing scoring is not improved by inclusion of patient-reported pain sensationSpine20063127352741 Discussion, 2742–2743.17077744
- PriceDDBushFMLongSHarkinsSWA comparison of pain measurement characteristics of mechanical visual analogue and simple numerical rating scalesPain1994562172268008411
- ScrimshawSVMaherCResponsiveness of visual analogue and McGill pain scale measuresJ Manipulative Physiol Ther20012450150411677548
- SalenBASpangfortEVNygrenALNordemarRThe Disability Rating Index: an instrument for the assessment of disability in clinical settingsJ Clin Epidemiol199447142314357730851
- MelinRFugl-MeyerKSFugl-MeyerARLife satisfaction in 18- to 64-year-old Swedes: in relation to education, employment situation, health and physical activityJ Rehabil Med200335849012691338
- K:L:O:N:K Available from: http://www.klonk.biz/. Accessed on July 31, 2009.
- BrynerPExtent measurement in localised low-back pain: a comparison of four methodsPain1994592812857892026
- ToomeyTCMannJDAbashianSThompson-PopeSRelationship of pain drawing scores to ratings of pain description and functionClin J Pain199172692741809440
- GeorgeSZBialoskyJEWittmerVTRobinsonMESex differences in pain drawing area for individuals with chronic musculoskeletal painJ Orthop Sports Phys Ther20073711512117416126
- TaitRCChibnallJTMargolisRBPain extent: relations with psychological state, pain severity, pain history, and disabilityPain1990412953012388768
- KerrSFairbrotherGCrawfordMHoggMFairbrotherDKhorKEPatient characteristics and quality of life among a sample of Australian chronic pain clinic attendeesIntern Med J20043440340915271174
- Ektor-AndersenJIsacssonSOLindgrenAOrbaekPThe experience of pain from the shoulder-neck area related to the total body pain, self-experienced health and mental distress. The Malmö Shoulder-Neck Study groupPain19998228929510488680