Abstract
The aim of the current study was to evaluate macular function before and after surgery for idiopathic epiretinal membranes with internal limiting membrane (ILM) peeling by means of multifocal electroretinography (ERG). Eighteen eyes of 18 patients who underwent vitrectomy with ILM removal were included. Best corrected visual acuity, optical coherence tomography (OCT), and multifocal electroretinography were assessed prior to surgery, and 3 and 12 months after surgery. All surgical samples were obtained and confirmed inclusion of an ILM by electron microscopy. Visual acuity and the central foveal thickness by OCT improved significantly 3 months postoperatively, with gradual recovery by 12 months. Preoperatively, only the P1 amplitude in rings 1 and 2 were decreased compared with the normal fellow eyes (P < 0.01). Three and 12 months after surgery, the P1 amplitude in rings 1 and 2 were decreased compared with the preoperative P1 amplitudes, but without significance. The photoreceptor status by OCT was related to the N1 amplitude before and after surgery. Although visual acuity and macular edema were improved after surgery, macular function, as indicated by multifocal ERG, had limited recovery at 12 months.
Introduction
A macular epiretinal membrane (ERM) is a disorder of the vitreomacular interface characterized by fibrocellular proliferation on the anterior surface of the internal limiting membrane (ILM) of the macula.Citation1 Pars plana vitrectomy and membrane peeling is a standard surgical treatment for an ERM and combined removal of the ILM is performed to eliminate the scaffold for myofibroblast proliferation and any microscopic ERM in order to prevent ERM recurrence.Citation2–Citation4 Multifocal electroretinography (ERG) has been used to assess visual function and selects the electrophysiologic responses of multiple retinal locations of the macular area. Several reports have demonstrated multifocal ERG values in eyes with ERM before and after surgery.Citation5–Citation9 However, the follow-up was short term, and the changes in multifocal ERG recordings were inconsistent. The purpose of this study was to report changes in macular function using multifocal ERG before and after surgery and to evaluate the surgical outcomes in visual function.
Methods
Eighteen patients undergoing vitrectomy with ERM and ILM removal for idiopathic ERM were prospectively recruited for this study. Informed consent was obtained from all patients, and the study was approved by the Institutional Review Board. Patients with a secondary ERM (eg, diabetic retinopathy, venous occlusion, retinal detachment, uveitis, and trauma) or other ocular pathologies that could interfere with the functional results (eg, severe cataract > grade 2 nuclear sclerosis and/or cortical opacities) were excluded from the study. Cases with improper surgical specimens for electron microscopy were also excluded. The normal fellow eyes without ocular diseases served as controls. Of 18 fellow eyes, 2 were excluded due to the presence of macular pucker or macular degeneration. All of the patients underwent a standard 23-gauge vitrectomy with triamcinolone assisted ERM/ILM removal performed by one surgeon (HKK). ILM staining, such as indocyanine green, was not used and no air-fluid exchange was performed during surgery. If the eyes were phakic, combined cataract surgery was performed in older patients for preventive purposes.
All patients underwent a thorough ophthalmologic examination at baseline. Best-corrected visual acuity (VA), optical coherence tomography (OCT) (Cirrus SD high-definition OCT; Carl Zeiss Meditec AG, Jena, Germany), and multifocal ERG (Retiport and RETIscan; Roland Consult Elektrophysiologische Diagnostik Systeme, Wiesbaden, Germany) were assessed at baseline, and 3 and 12 months after surgery. VA was measured using a Snellen chart and converted to the logarithm of the minimum angle of resolution (logMAR) for statistical analysis. OCT was performed using a macular cube scan. The grade of the photoreceptor line on OCT was classified into 2 groups: intact and disrupt, described in a previous report.Citation10 The intact photoreceptor line was identified as a regular continuation of the hyperreflective line corresponding to the inner segment/outer segment junction. The disrupted photoreceptor line was identified as a hyporeflective disruption of the hyperreflective inner segment/outer segment junction. The classifications were assessed by agreement of two authors (JWL and CJH).
Multifocal ERG responses from the subjects were performed according to the guidelines of the International Society for Clinical Electrophysiology of Vision.Citation11 Briefly, the stimulus consisted of an array of 61 hexagons that were scaled with eccentricity. The viewing distance was 28 cm, which allowed a viewing angle of approximately 29 degrees. Each hexagon was modulated temporally between black (2 cd/m2) and white (200 cd/m2) with a contrast of 98%, according to a pseudorandom binary m-sequence with a base interval of approximately 16.6 ms. Each step of the m-sequence consisted of 5 frames in 83-ms lengths. Pupils were maximally dilated, and signals were recorded with a contact lens jet electrode. During the recordings, the patients’ fixations were monitored. Signals were bandpass filtered (10–100 Hz) and amplified (gain, 100000). The mean simultaneous response component for the first-order kernel was recorded. Implicit times (latencies) and the amplitude relative to their respective areas (nV/deg2) of the first negative peak (N1) and the first positive peak (P1) were measured using regional averages derived from 5 concentric rings. The averages of responses recorded during 8 cycles were calculated for each subject for 61 hexagons and were analyzed with RETIscan software, version 3.15.
Surgical specimens were placed on a Millipore filter, fixed in a 10% paraformaldehyde solution, and examined by electron microscopy. Specimens were placed in a second bottle of paraformaldehyde solution (pH 7.3), post-fixed with 2% sodium tetroxide, dehydrated with acetone, and embedded in epoxy resin. Ultrathin sections were stained with uranyl acetate-lead citrate and inspected in a Zeiss EM 9 electron microscope.
SPSS software (version 12.0 for Windows; SPSS, Inc., Chicago, IL, USA) was used for statistical analysis. Comparison of data was performed using the Wilcoxon two-sample test, the paired t-test, and chi-square test with Bonferroni’s correction, as appropriate. Nonparametric Spearman correlation analyses were performed for correlation analysis. The results were considered significant at P values < 0.05.
Results
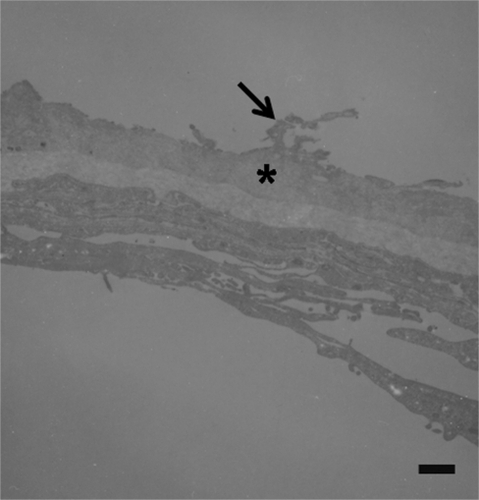
The mean (± SD) age of the patients was 67.0 ± 8.6 years (range, 55–78 years), and the study group included 8 men and 10 women. Of 18 eyes, 15 underwent concomitant cataract surgery and 3 were already pseudophakic. None of the patients presented with recurrence of disease or required further treatment during the 12-month follow-up. Ultrastructural analysis of the membranes showed that all samples included an ILM with retinal cell debris on the retinal side. shows an example of an ILM specimen.
Figure 1 Transmission electron micrographs of internal limiting membranes removed from eyes with idiopathic macular epiretinal membrane. Specimen shows fragments of retinal debris (arrow) at the retinal side of the internal limiting membrane (asterisk) (original magnification × 4400; bar = 1.7 μm).
The mean visual acuity (logMAR) was improved to 0.30 ± 0.30 at 3 months from 0.43 ± 0.27 at baseline (P = 0.047). The logMAR improved gradually to 0.22 ± 0.29 at 12 months (P = 0.020). The improvement in visual acuity was ≥2 lines in 12 of 18 eyes (66.6%). The central foveal thickness in all cases was improved after surgery. The mean central foveal thickness (μm) by OCT was reduced from 485.0 ± 95.6 to 354.5 ± 80.7 at 3 months (P = 0.015). At 12 months, the central foveal thickness decreased to 314.5 ± 69.5 (P = 0.005). Although there was an improvement in visual acuity and central foveal thickness, the values were worse than those for fellow eyes (P = 0.005 and P = 0.005, respectively). The visual acuity and OCT findings are shown in .
Table 1 Visual acuity and optical coherence tomography findings in patients with idiopathic epiretinal membrane before and after surgery
At baseline, only the ring 1 and 2 responses of the P1 waves were significantly decreased compared with the fellow eye (P < 0.01 and P < 0.01, respectively). There was no significant difference in the P1 response at the peripheral area (rings 3–5) and the N1 response in the entire area compared with the normal fellow eyes (P > 0.05). The P1 and N1 waves are presented in and . At baseline, the mean P1 amplitude (nV/deg2) was 79.6 ± 18.0 in ring 1 and 49.5 ± 12.5 in ring 2. Three months after surgery, 5 of 18 eyes (27.7%) showed the P1 amplitude in rings 1 and 2 to be slightly increased compared with baseline. However, the mean P1 amplitude was decreased without significance to 76.0 ± 22.5 in ring 1 and 45.3 ± 12.7 in ring 2 compared with baseline (P = 0.605 and P = 0.415, respectively). Twelve months after surgery, the P1 amplitude was decreased to 65.9 ± 20.8 in ring 1 and 43.7 ± 13.3 in ring 2 (P = 0.415 and P = 0.455, respectively). Three of 18 eyes (16.6%) had an elevated P1 amplitude in rings 1 and 2 compared with the baseline value. The N1 amplitudes in rings 1 and 2 also decreased 3 and 12 months after surgery from the baseline values (P > 0.05). The P1 and N1 amplitudes at the peripheral area (rings 3–5) did not show any significant changes after surgery. The mean P1 and N1 latencies (ms) did not reveal a significant change in all 5 ring areas at 3 and 12 months after surgery. The representative multifocal ERG recordings of a case are shown in .
Figure 2 Optical coherence tomographic (OCT) image of macula (upper) and the first order trace array of multifocal electroretinography (lower). A 66-year-old woman with idiopathic epiretinal membrane presented best-corrected visual acuity (BCVA) of 20/50 before surgery. OCT showed disruption of the line representing between inner segment/outer segment junction (Left). Three months after surgery, her visual acuity was improved to 20/40, and OCT showed decreased macular edema and disrupted photoreceptor line (Middle). Twelve months after surgery, her BCVA was 20/40, and OCT showed foveal contour recovery and intact photoreceptor line. Serial changes in multifocal electroretinography responses showed gradual decreased P1 amplitude following ERM surgery.
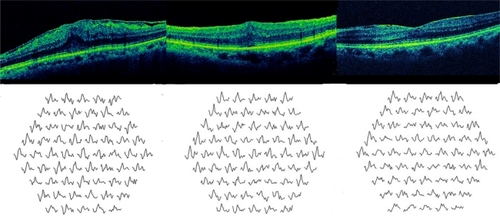
Table 2 The P1 waves of multifocal electroretinography recordings in patients with idiopathic epiretinal membrane before and after surgery
Table 3 The N1 waves of multifocal electroretinography recordings in patients with idiopathic epiretinal membrane before and after surgery
There was no statistically significant correlation between P1 and N1 amplitudes (all 5 rings) and visual acuity at baseline, and 3 and 12 months after surgery (P > 0.05). No statistically significant correlation was found between the P1 and N1 amplitudes (all 5 rings) and the central foveal thickness at baseline, and 3 and 12 months after surgery (P > 0.05).
By photoreceptor status, the intact photoreceptor group had an increased N1 amplitude compared with the disrupted status group at baseline, and 3 and 12 months after surgery. The P1 and N1 latencies did not show significant changes between the two groups. The multifocal ERG recordings according to photoreceptor status are shown in .
Table 4 The N1 and P1 amplitude of multifocal electoretinography recordings in patients with idiopathic epiretinal membrane before and after surgery according to photoreceptor status
Discussion
The multifocal ERG is an investigation which allows the objective evaluation of retinal function. The multifocal ERG value after ERM surgery might be affected by several factors, including release of the tractional membrane, photoreceptor status, progression of cataracts, intentional removal of the ILM, and use of indocyanine green. The previous series in which multifocal ERG was analyzed after ERM surgery included fewer samples and did not control these confounding factors strictly. Additionally, the histopathologic examination of surgical specimens about inclusion of ILM was not performed. An important point of the current study is to exclude the effect of cataract progression, to perform electron microscopy for surgical specimens, and to define photoreceptor status by spectral domain OCT. Thus, the multifocal ERG results in our report were well controlled and more reliable than other reports.
Previous reports have demonstrated decreased multifocal ERG responses 3 months after ERM surgery with ILM peeling without significance compared with baseline.Citation7–Citation9 Our results are similar for the first 3 months. And Tari et alCitation7 reported minor cases showing increased amplitude after surgery in spite of decreased mean amplitude in their study. It is worth noting that 3 of 18 eyes (16.6%) also revealed an increased amplitude at 12 months after surgery in this study. Thus, we did not conclude all cases would show decreased amplitude after ERM surgery. Additionally, we demonstrated a greater decrease in the P1 amplitude 12 months after surgery than at baseline. In contrast, another report demonstrated multifocal ERG value was improved significantly at 12 months after ERM surgery.Citation9 We attribute this difference to the better baseline visual acuity and less improvement of visual acuity in the current study compared with the previous report. In our electron microscopy findings, the specimens included ILM as well as retinal cell debris. Besides, ILM peeling causes a lower multifocal ERG response and results in retinal physiologic changes.Citation12 Thus, we suspect that the difference of damage to inner retinal layers and Muller cell dysfunction may also have some effect on multifocal ERG changes. And the difference of residual anatomical abnormalities after surgery may be associated with multifocal ERG. The multifocal ERG value might affect numerous factors we could not detect and control. Indeed, the mechanism of multifocal ERG impairment related to ERM may not be straightforward.
Both visual acuity and central foveal thickness remained lower than the values of fellow eyes 12 months after surgery. P1 and N1 amplitude impairment also continued 12 months after surgery. This might indicate that successful ERM removal does not cause complete recovery in modulating the synaptic transmission in the retinal neural circuitry. This incomplete recovery may explain the patients’ reports of blurred vision despite relatively good visual acuity after ERM surgery.
We demonstrated that there was no statistically significant correlation between the multifocal ERG values and the central foveal thickness and VA. These findings support our conclusion that the multifocal ERG values are independent of macular edema reduction and visual acuity improvement. The multifocal ERG varied widely similar visual acuity or central foveal thickness.
For each component of the multifocal ERG, P1 may be generated from the inner retinal layer, including bipolar and Muller cells, and N1 may be generated from the outer retinal layer.Citation13,Citation14 In this study, deterioration in the P1 wave was presented before and after surgery compared with the normal fellow eyes. Therefore, the presence of ERM or the remaining retinal distortion or edema after surgery seems to affect the inner retinal layer. In addition, we demonstrated that the N1 amplitude was associated with photoreceptor status preoperatively, and 3 and 12 months after surgery. It has generally been thought that photoreceptor status by OCT is associated with visual recovery.Citation15 Although the N1 amplitude was not mainly affected by the presence of ERM, we demonstrate that the N1 amplitude was related to and generated from the outer retina. Furthermore, the photoreceptor status was not related to other multifocal ERG values and was not responsible for the electrical responses of the inner layers of the macula.
The limitations of our study include a small sample size and a relatively short follow-up period. This might have limited the power in detecting other factors and may lead to inadequate statistical analysis. Further recovery of the multifocal ERG response may be expected after a longer follow-up period. We want to note that in our study we used RETIscan and not the more widely used VERIS system; even though these two systems are comparable in precision for detection of retinal abnormalities, our numerical results may show slightly higher amplitudes and slightly longer implicit times than the data obtained using the VERIS system.Citation16 It is not known whether or not multifocal ERG abnormalities persist after surgery, as described herein are universal phenomenona for all ERM cases. Furthermore, larger, controlled studies are warranted to improve our understanding of changes that may occur after ERM surgery.
In conclusion, eyes with ERM surgery, subtle multifocal ERG abnormalities appear to persist 12 months after surgery, despite an improvement in visual acuity and reduced central foveal thickness. For this reason, we suggest that ERM and ILM removal result in partial continued functional impairment.
Disclosure
The authors have no conflicts of proprietary or commercial interest in any materials discussed in this article.
References
- WiseGNClinical features of idiopathic preretinal macular fibrosis. Schoenberg lectureAm J Ophthalmol19757933493471121990
- KwokAKLaiTYLiWWWooDCChanNRIndocyanine green assisted internal limiting membrane removal in epiretinal membrane surgery: a clinical and histological studyAm J Ophthalmol2004138219419915289126
- BoveyEHUfferSAchacheFSurgery for epimacular membrane: impact of retinal internal limiting membrane removal on functional outcomeRetina200424572873515492626
- KwokAKhLaiTYYuenKSEpiretinal membrane surgery with or without internal limiting membrane peelingClin Experiment Ophthalmol200533437938516033350
- MoschosMApostolopoulosMLadasJAssessment of macular function by multifocal electroretinogram before and after epimacular membrane surgeryRetina200121659059511756881
- ParisiVCoppeAMGallinaroGStirpeMAssessment of macular function by focal electroretinogram and pattern electroretinogram before and after epimacular membrane surgeryRetina200727331232017460586
- TariSRVidne-HayOGreensteinVCBarileGRHoodDCChangSFunctional and structural measurements for the assessment of internal limiting membrane peeling in idiopathic macular puckerRetina200727556757217558317
- LaiTYKwokAKAuAWLamDSAssessment of macular function by multifocal electroretinography following epiretinal membrane surgery with indocyanine green-assisted internal limiting membrane peelingGraefes Arch Clin Exp Ophthalmol2007245114815416705448
- KoutsandreaCNApostolopoulosMNAlonistiotisDAIndocyanine green-assisted epiretinal membrane peeling evaluated by optical coherence tomography and multifocal electroretinographyClin Ophthalmol20071453554419668533
- SuhMHSeoJMParkKHYuHGAssociations between macular findings by optical coherence tomography and visual outcomes after epiretinal membrane removalAm J Ophthalmol2009147347348019054492
- MarmorMFHoodDCKeatingDKondoMSeeligerMWMiyakeYfor the International Society for Clinical Electrophysiology of VisionGuidelines for basic multifocal electroretinography (mfERG)Doc Ophthalmol2003106210511512678274
- TerasakiHMiyakeYNomuraRFocal macular ERGs in eyes after removal of macular ILM during macular hole surgeryInvest Ophthalmol Vis Sci200142122923411133873
- HoodDCSeipleWHolopigianKGreensteinVA comparison of the components of the multifocal and full-field ERGsVis Neurosci19971435335449194320
- HoodDCGreensteinVFrishmanLIdentifying inner retinal contributions to the human multifocal ERGVision Res199939132285229110343810
- Falkner-RadlerCIGlittenbergCHagenSBeneschTBinderSSpectral-domain optical coherence tomography for monitoring epiretinal membrane surgeryOphthalmology2010117479880520045567
- BockMAndrassiMBelitskyLLorenzBA comparison of two multifocal ERG systemsDoc Ophthalmol1998–1999972157178