Abstract
MYP2 was reported for a candidate locus associated with high grade myopia by linkage analysis, but no candidate gene has been detected. We report an association study in the Japanese population using 750 microsatellite markers on chromosome 18 that include MYP2 locus. 450 Japanese subjects with high myopia whose refractive error was greater than or equal to −9.25D in at least one eye and equal number of normal control subjects were recruited in this study. Three steps screening on the pooled DNA of patients and the pooled DNA of controls were performed in this study. A total of 722 microsatellite markers could be analyzed, and we obtained 4 positive markers. Then to avoid experimental errors and artifacts, we confirmed true allele frequency by individual genotyping using initial set of 450 patients and controls. Only marker D18S0301i showed statistically significance, and no marker showed statistically significance on the MYP2 locus. Near the marker D18S0301i, GALNT1 gene was located, but its relation to high myopia has remained to be identified.
Introduction
Myopia is a refractive visual disorder often associated with retinal detachment, submacular hemorrhage, glaucoma, and macular degeneration (CitationBurton 1989). Therefore myopia is an important public health problem because it increases the risk of visual loss and places a social, economic and health burden on the community. In Asian countries including Japan, the prevalence of myopia is very high. For instance, in Japan ∼59.3% of the high school students were affected by myopia (CitationMinistry of Education, Japan 2004). High grade myopia occupies the high rank of the causes of midway blindness for people during their lifespan.
The cause of myopia is unclear, but the importance of environmental factors in the prevalence and the progress of the myopia has been well demonstrated by the experiment myopia animal models (CitationWiesel and Raviola 1977; CitationWallman et al 1978; CitationHodos et al 1985; CitationRaviola and Wiesel 1985; CitationOsol et al 1986; CitationSchaeffel et al 1988; CitationHung et al 1995). The influence of the genetic factors in the development of high myopia has also been demonstrated in epidemiological studies, such as the family correlated studies and twin studies. Although heritability as a measure of estimating the extent to which the genetic factor affects the etiology of a particular disease can be easily influenced by the environment, the heritability of myopia in the twin studies has shown considerably high values (CitationHu 1981; CitationTeikari et al 1991; CitationAngi et al 1993; CitationHammond et al 2001; CitationLyhne et al 2001).
Another measurement that can estimate the extent to which a genetic factor affects the etiology of disease is the concept of λR (CitationRisch 1990). Whereas λR is defined as the risk ratio for a type R relative of an affected individual compared with the population prevalence, λS is a value that divides the proband’s sib’s prevalence of disease with the prevalence of disease of the general population. In this regard, such analyses have confirmed that genetics plays an important role in the pathogenesis of high myopia. For example, CitationGuggenheim et al (2000), in a Danish epidemiological investigation (CitationGoldschmidt 1968), calculated that the λS was 20.0 for high myopia, where the refractive error was greater than or equal to −6 diopters(D).
Recent multigenerational linkage studies have reported several candidate loci of high myopia, MYP2-MYP5, and MYP11-MYP13 (CitationYoung, Ronan, Alvear et al 1998; CitationYoung, Ronan, Drahozal et al 1998; CitationNaiglin et al 2002; CitationPaluru et al 2003, Citation2005; CitationZhang et al 2005, Citation2006), and several candidate loci of myopia, MYP6-MYP10 (CitationStambolian et al 2004; CitationHammond et al 2004) on different chromosomes. Among them, we focused on the MYP2 locus on chromosome 18 that showed the highest maximum lod score (9.59). Previous studies reported that the MYP2 locus was the candidate locus of the nonsyndromic autosomal dominant high myopia although these mapping resolution were insufficient.
In this study, to clarify the susceptibility genes on chromosome 18 related to the appearance of high myopia, we performed high resolution mapping by association study using 750 polymorphic microsatellite markers distributed across chromosome 18.
Materials and methods
A total of 450 Japanese patients with high myopia whose refractive error was greater than or equal to −9.25D in at least one eye were recruited in the Hospital of Yokohama City University and Okada Eye Clinic. Equal numbers of control subjects were recruited at the Tokai University, Isehara campus. All the patients with high myopia were examined clinically by experienced ophthalmologists, and none of the patients were found to have eye diseases, such as Marfan syndrome, Stickler syndrome, juvenile glaucoma and keratoconus. Control subjects were selected from the general population. The average age was 37.8 ± 11.77 years in the patient population and the gender ratio was 1.0:1.4 (male: female). In the control population, average age was 41.2 ± 11.67 years and gender ratio was 1.0:1.2 (male: female). The average spherical refractive error for patients was OD: −11.63 ± 2.21D (range −6.75 to −22.75D), OS: −11.58 ± 2.21D (range −7.25 to −22.50D). The average axial length was OD: 27.78 ± 1.31 mm(range 20.31 to 33.14 mm), OS: 27.79 ± 1.33 mm(range 23.99 to 34.74 mm). The average corneal refraction was OD: 43.94 ± 1.60D (range 39.50 to 50.25D), OS: 43.94 ± 1.62D (range 39.75 to 53.00D).
Peripheral blood cells were collected and consent to genetic screening was obtained from patients and control subjects after the details of this study were explained to every subject. All patients and healthy control subjects agreed to a blood examination conducted according to the guidelines of the Declaration of Helsinki.
Based on the knowledge that the average length of linkage disquilibrium (LD) is about 100 kb (CitationTamiya et al 2005), we performed high resolution screening on chromosome 18, including the MYP2 locus, using 750 microsatellite markers. The average interval length between the markers was 126.8 kb. Information on the microsatellites markers was obtained from the JBIRC website (Japan Biological Information Research Center).
In order to reduce the cost of genotyping and the total number of genotyping assays and associated costs, we performed three screens on the pooled DNA of patients and the pooled DNA of the controls, separately (CitationSham et al 2002). The three-step screening protocol, as previously described (CitationTamiya et al 2005), helped to decrease the number of false positives. We used 150 myopia individuals and 150 controls at each step of the screening protocol to construct the pooled DNA samples. The frequency of the alleles in the pooled DNA were calculated by obtaining the sum total of the height of all peak patterns after an electrophoresis run by ABI 3700 DNA analyzer (Applied Biosystems) and calculating the ratio of the height of each peak.
In the first screening step, 750 microsatellite markers were analyzed using pooled DNA. In the second screening step, only the positive markers from the first screening with statistical significance of p < 0.05 by the Fisher’s exact test, either for the 2 × 2 or 2 × m contingency table (m refers to the number of allele), were genotyped using the pooled DNA that was constructed from another 150 myopia individuals and 150 controls. Only positive markers showing significance with p <0.05 in the second screening step were then subjected to the third screening step. In this way, the three step screening method could eliminate false positives resulting from type 1 errors.
Finally, in order to further exclude experimental errors and artifacts, we selected priority microsatellite markers based on statistical p-value and peak pattern to confirm true allele frequency by individual genotyping using the DNA samples of the initial set of 450 high myopia individuals and 450 control individuals.
DNA was extracted by using the QIAamp DNA blood kit (QIAGEN) and the DNA concentration was measured using the PicoGreen fluorescence assay. Because accurate DNA concentration was very important in the use of the pooled DNA method, measurements were performed in triplicate.
All microsatellite marker specific PCR primers were designed to have an annealing temperature of 57 °C, and forward primers were labeled with fluorogenic probe.
The volume of the PCR mixture for pooled DNA typing was a total of 20 μl containing 24 ng of pooled DNA, 0.5 units of AmpliTaq-Gold DNA polymerase (Applied Biosystems), 5.0 mM dNTPs, 20 μM of each primers and 1X reaction buffer. The PCR mixture for individual typing was a total of 20 μl containing 8 ng of genomic DNA, 0.5 units of AmpliTaq Gold DNA polymerase(Applied Biosystems), 4.0 mM dNTPs, 1X reaction buffer, 20 μM of each primers and 1X reaction buffer. The amplification reactions were carried out in GeneAmp PCR system 9700 (Applied Biosystems) with an initial denaturation at 96 °C for 5 min (hot start), annealing at 57 °C for 1 min, and extension at 72 °C for 1 min and then 40 cycles for three steps of PCR (denaturation at 96 °C for 45 s, and annealing at 57 °C for 45 s, and extension at 72 °C for 1 min).
The quality of the pooled DNA was confirmed by comparing the result of allelic distributions between pooled DNA typing and individual typing using 6 microsatellite markers that had no association with high myopia. Both pooled DNA typing and individual typing were carried out using the ABI 3700 DNA analyzer (Applied Biosystems).
Results
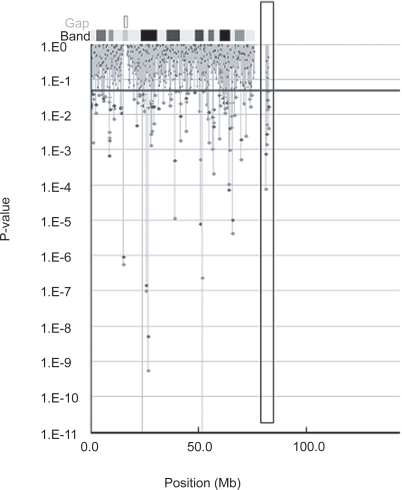
Of the 722 microsatellite markers analyzed in the first screening step, 94 markers were calculated to be positive markers (). Four of the 94 markers were excluded for the second screening step because they could not be amplified, or had a very weak peak pattern.
Figure 1 Shows p values by Fisher’s exact test based on 2 × 2 contingency tables (Red circles) or on 2 × m contingency tables (Blue circles) in the first screening. Blue line indicate p values = 0.05.
Therefore, in the second screening step, 90 positive markers from the first screening were analyzed and only 16 of them were found to be positive for subsequent use in a third screening. In the third screening, we obtained only 4 positive markers (D18S0356i, D18S0201i, D18S0301i, D18S0357i) with statistical significance of p < 0.05 by Fisher’s exact test ().
Table 1 Three step screening of pooled DNA method
To exclude experimental errors, we then checked again all the peak patterns of the 4 positive markers, and finally selected the three markers, D18S0356i, D18S0201i and D18S0301i, for further analysis by individual genotyping in patients and controls. The marker, D18S0357i, was excluded from the list for individual typing, because the results were not consistent for each step of the screening protocol and a variability of certain, peak patterns between the three steps.
shows the result of individual typing for the three selected markers. Only marker D18S0301i that was located at 18q12.2, showed statistically significance (p = 0.038 2 × 2, OR = 0.61, 95% CI = 0.383 to 0.973) at the allele which has amplicon size 461. The marker D18S0201i, that was located in the MYP2 locus between D18S59 and D18S1146, showed no statistically significance.
Table 2 Statistical significance of alleles associated with high myopia on chromosome 18
Discussion
MYP2 is a candidate locus of the nonsyndromic autosomal dominant high myopia first identified by CitationYoung, Ronan, Drahozal et al (1998) who performed a genome-wide linkage analysis for myopia susceptibility loci in 8 multigenerational families with an autosomal dominant mode of myopia of more than −6.00 diopters, and showed a significant linkage to 18p. The maximum lod score was 9.59, with marker D18S481. Haplotype analysis further refined this myopia locus to a 7.6-cM interval between markers D18S59 and D18S1138 on 18p11.31. Afterwards CitationYoung et al (2001) narrowed the candidate region to the interval of 0.8 cM between markers D18S63 and D18S52. In this region, there are many possible candidate genes, such as adenylate cyclase-activating polypeptide, thymidylate synthetase, protein tyrosine phosphatase receptor, α subunit of guanine nucleotide-binding protein, protein tyrosine phosphatase, Niemann-Pick disease protein, and the α subunit of laminin.
The transforming growth factor-β-induced factor (TGIF) which was mapped to the MYP2 region on 18p11.3, also emerged as a candidate gene for high myopia. Subsequently, CitationLam et al (2003) investigated the coding exons of TGIF for mutations in Chinese subjects with high myopia, and only 657 (T-G) showed statistical significance in the logistic regression model (odds ratio 0.133; 95% CI 0.036−0.488; p = 0.002). Although TGIF was suggested as a probable candidate gene for high myopia by CitationLam et al (2003), others showed that TGIF has no association with high myopia (CitationScavello 2004; CitationHasumi 2006). In our present high resolution screening study, we used a total set of 35 microsatellite markers in the MYP2 locus between markers D18S59 to D18S52, and found no association between MYP2 and high myopia. Therefore, based on our study, we conclude that there is no candidate gene for high myopia in the MYP2 region in the Japanese population.
On the other hand, we detected another candidate locus for high myopia outside the MYP2 region on chromosome 18. The microsatellite marker D18S0301i located in chromosomal position q12.2, showed statistical significance (odds ratio 0.61; 95%CI 0.383–0.973; p = 0.038). To avoid false negative, we performed no correction for multiple comparisons such as Bonferoni’s correction in this study.
The gene closest to this microsatellite marker is, GALNT1 (UDP-N-acetyl-alpha-D-galactosamine). UDP-N-acetyl-alpha-D-galactosamine is a N-acetylgalactosaminyltransferase that transfers an N-acetylgalactosamine to a serine or threonine residue in the first step of O-linked oligosaccharide biosynthesis (CitationTakai et al 1997). We considered GALNT1 as a new candidate gene, but its relation to myopia is debatable because of its metabolic function. There is still a possibility that a specific allele or mutation in an unknown gene and near to the GALTN1 gene is in linkage disequilibrium with marker D18S0301i and has yet to be identified. Therefore, we may need to investigate this locus in more detail in future studies.
Since the accumulation of several multigenic factors may contribute to the risk and development of chronic diseases, we plan to expand our investigations to other chromosomes of the human genome, in order to identify all the disease susceptibility alleles or mutations involved with high myopia at the genome-wide level.
References
- AngiMRClementiMSardeiC1993Heritability of myopic refractive errors in identical and fraternal twinsGraefes Arch Clin Exp Ophthalmol23158058224933
- BurtonTC1989The influence of refractive error and lattice degeneration on the incidence of RDTrans Am Ophthalmol Soc87143552562517
- GoldschmidtE1968On The etiology of myopiaActa OphthalmolSuppl 98
- GuggenheimJA2000The heritability of high myopia: a reanalysis of Goldschmidt’s dataJ Med Genet372273110777361
- HammondCJSniederHGilbertCE2001Genes and environment in refractive error: the twin eye studyInvest Ophthalmol Vis Sci421232611328732
- HammondCJAndrewTMakYT2004A susceptibility locus for myopia in the normal population is linked to the PAX6 gene region on chromosome 11: a genomewide scan of dizygotic twinsAm J Hum Genet7529430415307048
- HasumiYInokoHManoS2006Analysis of single nucleotide polymorphisms at 13 loci within the transforming growth factor-induced factor gene shows no association with high myopia in Japanese subjectsImmunogenetics589475317048038
- HodosWFitzkeFWHayesBP1985Experimental myopia in chicks: ocular refraction by electroretinographyInvest Ophthalmol Vis Sci261423304044170
- HuDN1981Twin study on myopiaChin Med J (Engl)945156785025
- HungLFCrawfordMLSmithEL1995Spectacle lenses alter eye growth and refractive status of young monkeysNat Med176157585177
- LamDSLeeWSLeungYF2003TGFbeta-induced factor: a candidate gene for high myopiaInvest Ophthalmol Vis Sci441012512601022
- LyhneNSjolieAKKyvikKO2001The importance of genes and environment for ocular refraction and its determiners: a population based study among 20–45 year old twinsBr J Ophthalmol851470611734523
- Ministry of Education, Culture, Sports, Science and TechnologyDisease Rate among Students, Statistical Abstract2004edition.
- NaiglinLGazagneCDallongevilleF2002A genome wide scan for familial high myopia suggests a novel locus on chromosome 7q36J Med Genet391182411836361
- OsolGSchwarzBFossDC1986The effects of photoperiod and lid suture on eye growth in chickensInvest Ophthalmol Vis Sci27255603943949
- PaluruPRonanSMHeonE2003New locus for autosomal dominant high myopia maps to the long arm of chromosome 17Invest Ophthal Vis Sci441830612714612
- PaluruPCNallasamySDevotoM2005Identification of a novel locus on 2q for autosomal dominant high-grade myopiaInvest Ophthal Vis Sci462300715980214
- RaviolaEWieselTN1985An animal model of myopiaN Engl J Med3121609154000200
- RischN1990Linkage strategies for genetically complex traits. I. Multilocus modelsAm J Hum Genet4622282301392
- ScavelloGSPaluruPCGanterWR2004Sequence variants in the transforming growth beta-induced factor (TGIF) gene are not associated with high myopiaInvest Ophthalmol Vis Sci452091715223781
- SchaeffelFGlasserAHowlandHC1988Accommodation, refractive error and eye growth in chickensVision Res28639573195068
- ShamPBaderJSCraigI2002DNA Pooling: a tool for large-scale association studiesNat Rev Genet38627112415316
- StambolianDIbayGReiderL2004Genomewide linkage scan for myopia susceptibility loci among Ashkenazi Jewish families shows evidence of linkage on chromosome 22q12Am J Hum Genet754485915273935
- TakaiSHinodaYAdachiT1997A human UPD (sic)-GalNAc: polypeptide, N-acetylgalactosaminyltransferase type 1 gene is located at the chromosomal region 18q12.1Hum Genet9929349050910
- TamiyaGShinyaMImanishiT2005Whole genome association study of rheumatoid arthritis using 27039 microsatellitesHum Mol Genet1423052116000323
- TeikariJMO’DonnellJKaprioJ1991Impact of heredity in myopiaHum Hered4115161937488
- WallmanJTurkelJTrachtmanJ1978Extreme myopia produced by modest change in early visual experienceScience201124951694514
- WieselTNRaviolaE1977Myopia and eye enlargement after neonatal lid fusion in monkeysNature266668402582
- YoungTLAtwoodLDRonanSM2001Further refinement of the MYP2 locus for autosomal dominant high myopia by linkage disequilibrium analysisOphthalmic Genet22697511449316
- YoungTLRonanSMAlvearAB1998A second locus for familial myopia maps to chromosome 12qAm J Hum Genet631419249792869
- YoungTLRonanSMDrahozalLA1998Evidence that a locus for familial high myopia maps to chromosome 18pAm J Hum Genet63109199634508
- ZhangQGuoXXiaoX2005A new locus for autosomal dominant high myopia maps to 4q22–q27 between D4S1578 and D4S1612Molec Vis115546016052171
- ZhangQGuoXXiaoX2006Novel locus for X linked recessive high myopia maps to Xq23–q25 but outside MYP1J Med Genet43e20Note: Electronic Article16648373