Abstract
Purpose
Clinical observational study for the correlation between the central corneal thickness (CCT), axial length (AXL), optic disc area (D), cupping area (C) and peripapillary atrophy (PPA), in healthy eyes (group A), eyes with primary open angle glaucoma (POAG) (group B) and eyes with ocular hypertension (OH) (group C), in order to assess the possible contribution of this correlation to the diagnosis or prognosis of glaucoma.
Methods
Ninety eyes of 90 persons participated in the study (30 eyes of 30 persons in each group). All eyes underwent intraocular pressure measurement, visual field testing, endothelial cell count (ECC), measurement of the CCT and AXL, and gonioscopy. After dilation of the pupil, a digital photograph of each optic disc was performed, followed by PPA, D area and C area measurements.
Results
We found a statistically significant difference in the C/D area ratio between healthy and POAG eyes and a moderate negative relationship between AXL and D in healthy eyes. We also found a moderate negative relationship between CCT and C/D area ratio in POAG eyes and a strong negative relationship between PPA and D in OH eyes.
Conclusions
CCT was not correlated with PPA and AXL in any one of the three groups. OH eyes seem to have more tolerant and stable disc and peripapillary area compared to healthy and POAG eyes.
Introduction
Glaucoma is a vision-threatening optic neuropathy with a prevalence of 0.92%–2.16% in the Caucasian population over 40 years of age and about two to four times more in African-Americans and African-Caribbeans over 40 years (CitationTielsch et al 1991; CitationLeske et al 1994). The irreversible visual loss caused by glaucoma necessitates its early detection and treatment, whereas its shown multifactorial etiology drives clinical research towards the recognition of new possible risk factors for this sight threatening disease.
Among other recognized glaucoma risk factors (CitationBoland and Quigley 2007; CitationGordon et al 2002), peripapillary atrophy (PPA) is also under investigation as a possible factor related to the diagnosis and prognosis of primary open angle glaucoma (POAG). Even though PPA appears not only in glaucoma but also in healthy and ocular hypertensive eyes, a number of studies suggest that it occurs more often and is more pronounced in eyes with POAG (CitationKi et al 1998; CitationJonas et al 1989; CitationJonas and Naumann 1989; CitationJonas et al 1992). Another study suggests that PPA has a gradual expansion in eyes with progressive glaucoma (CitationUchida et al 1998). Nevertheless, the precise role of PPA in glaucomatous development is still debatable since there are other reports considering PPA a relatively independent factor in the glaucoma progression (CitationAiraksinen et al 1987).
The Ocular Hypertension Treatment Study (OHTS) has recently recognized central corneal thickness (CCT) as another risk factor for the development of POAG in eyes with ocular hypertension (OH) (CitationGordon et al 2002). Currently other ocular biomechanical parameters, such as stromal structure, are also under question as possible risk factors for glaucoma (CitationBrown and Gongdon 2006). These parameters might have an impact not only to the accurate measurement of the intra-ocular pressure (IOP) but also possibly to the tolerance of the optic nerve. The recent evolution of new techniques for accurate recording of the ocular biomechanical properties will help us to investigate further such an impact.
The purpose of this observational study is to investigate the possible relationship between PPA and optic disc parameters with CCT and axial length (AXL) among healthy individuals, POAG and OH patients.
Materials and methods
For the purpose of this observational study we used material from our glaucoma department. All new patients attending the glaucoma clinic, starting November 2004, were potential candidates to be included in the study. According to the predefined criteria (), patients were allocated into one of three groups. The pre-determined number of eyes to be included in each group was 30 eyes/group and these numbers were completed by January 2006. All the enrolled patients in this study have consented for the use of their clinical data. As we wanted to minimize sex interference to our results, we decided also to include an equal number (n = 15) of men and women in each group.
Table 1 Demographics and Inclusion criteria
Inclusion criteria for the three groups were as follows: Group A was the control group of 30 healthy eyes with IOP ≤ 21 mmHg, normal visual fields (VF) and without known risk factors for glaucoma (). Group B consisted of 30 eyes newly diagnosed for POAG with IOP > 21 mmHg without treatment, with early to moderate glaucoma VF defects and open anterior chamber angle on gonioscopy. The third group (C) included 30 OH eyes, with IOP > 21 mmHg without treatment, normal VF and no known risk factors for glaucoma.
Table 2 Risk factors associated with increased prevalence of glaucoma damage
All participants had two VF tests performed, under standard conditions, one week apart, using automated static perimetry in 30–2 white on white Full Threshold strategy (Humphrey Field Analyzer II, Humphrey Instruments, Dublin, CA). We used the criteria of European Glaucoma Society (CitationDiagnostic criteria for glaucomatous visual field loss 2003) to define the glaucoma VF defects as follows: abnormal Glaucoma Hemifield Test or 3 abnormal points (p < 5% probability of being normal, one of which had p < 1% without being next to the blind spot) or CSPD < 5% in otherwise normal VF. For the staging of the VF defects we used the Hodapp classification who defines early glaucomatous loss when MD < −6dB, fewer than 18 points depressed below the 5% probability level, fewer than 10 points below the p < 1% level and no point in the central 5° with a sensitivity of less than 15 dB (CitationHodapp et al 1993). The same classification defines moderate glaucomatous loss when MD < −12dB, fewer than 37 points depressed below the 5% probability level, fewer than 20 points below the p < 1% level, no absolute deficit (0 dB) in the central 5° and only in one hemifield sensitivity <15 dB in the central 5°. For the grading of the anterior chamber angle we used the Spaeth classification (CitationSpaeth 1971) that defines an open angle as wide as 30° to 40°. The gonioscopy was performed with four mirror goniolens (G-4 Volk Optical Inc., Mentor, OH, USA).
The IOP measurements were performed with Goldmann applanation tonometer, always by the same examiner (GT), and the value recorded was the average of three consecutive measurements. This had to be confirmed on two more occasions in different days.
All participants in the study underwent the following additional examinations, again by the same examiner (GT): manifest refraction, endothelial cell count (ECC) (KONAN specular microscope, Noncon ROBO CA, Japan), ultrasound CCT pachymetry taking the average of three consecutive measurements (NIDEK, US –1800 ECHOSCAN, Japan), and ultrasound axial length (AXL) measurement, taking the average of ten consecutive recordings (Alcon Surgical, Alcon Laboratories Inc., Fort Worth, TX, USA).
The exclusion criteria were: not previously operated eyes, because of possible effect on endothelial function, eyes with refractive error > ± 2,00D (based on manifest refraction, regardless of axial length measurements) since PPA and optic disc size could have different morphology in myopic and hyperopic subjects, eyes with any kind of corneal disease or ECC < 2000/mm2, no eyes with CCT < 500 μm or > 600 μm in order to avoid significant over- or underestimations of IOP measurement (CitationDoughty and Zaman 2000), no use of topical medications or contact lens because of their possible effect on the shape and thickness of the cornea, and finally the presence of diabetes, or optic neuropathy of any cause.
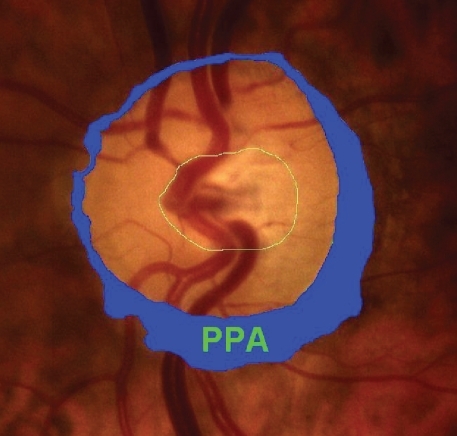
After dilation of the pupil with tropicamide 0.5%, digital colour photographs of each optic disc area were taken, under the same magnification of 20° angle (CANON CF 600UVi, Japan) (). The photographs were then analyzed by an image analysis planimetric program designed to measure the surface of a closed marked area in μm2 and calculate the proportion between two closed marked areas (WinStation 3200 XP – 10.2, Ophthalmic Imaging Systems, Sacramento, CA, USA). Thus, we carefully mapped the following three borders in every optic disc: a) outer border of PPA (: blue line), b) optic disc border (inner margin of Elschning’s scleral ring) (: green line) and c) cupping of the optic disc (according to the inside bend of the local vessels) (: yellow line). All these drawings were performed manually after further magnification of the original image, by the same examiner (GT). In the measurement of PPA we included both b and a zones (zone b represents the inner part of PPA consisting of bare sclera and possibly some large choroidal vessels, and zone a represents the outer part of PPA which is characterized by an irregular hypo- and hyperpigmentation of the chorioretinal tissue). Consequently the program calculated the closed marked areas of PPA, D and C as well as the proportion between them automatically. (–)
Figure 1 Optic disc and peripapillary atrophy.
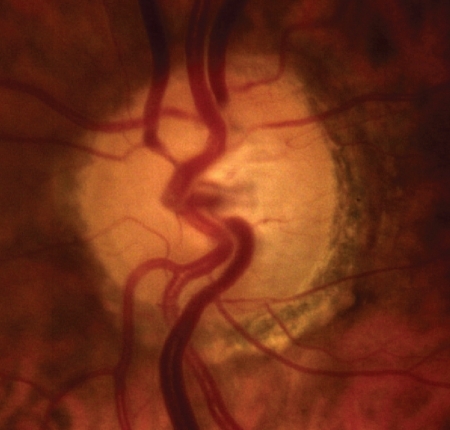
Figure 2 Mapping of cupping, disc and peripapillary atrophy.
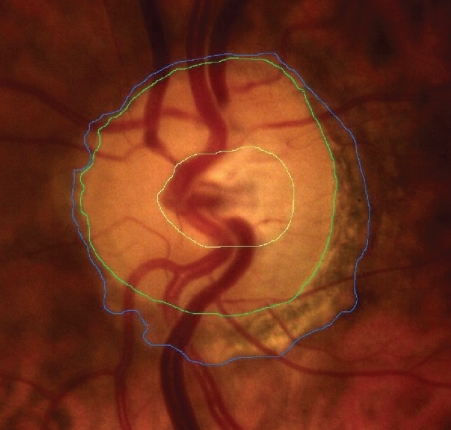
Figure 3 Cupping area (C).
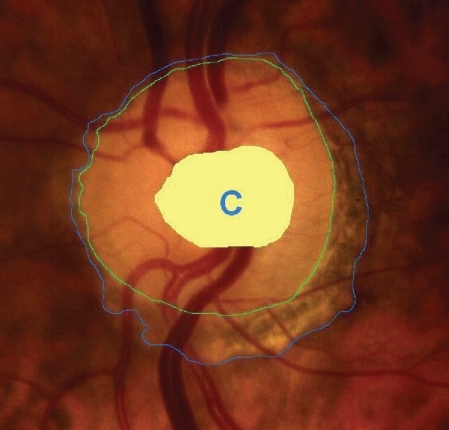
Figure 4 Disc area (D).
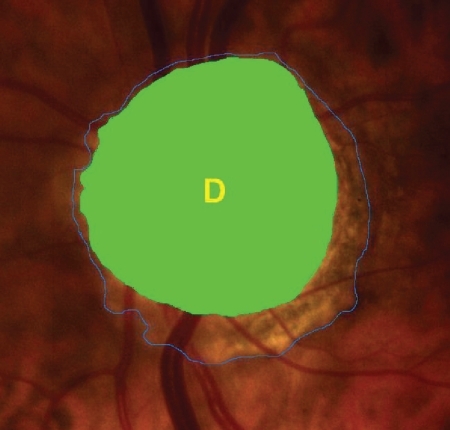
Figure 5 Peripapillary atrophy (PPA).
Statistical analysis
Since all subjects included in the study had bilateral disease, we used a simple randomisation method in order to choose one eye (left or right) from each patient for the various measurements. More specifically, a table of random numbers was used with odd numbers to indicate left eye measurement and even numbers to indicate right eye measurement. Descriptive analysis (mean, median, standard deviation, min, max) was used to describe continuous variables (). Kruskal-Wallis test was used in order to compare age differences among the three groups. Kolmogorov-Smirnov test was used to test for normality. Pearson correlation coefficients and Spearman’s rho coefficient were calculated, whenever appropriate, in order to assess the correlation of specific continuous variables. One way Analysis of Variance (ANOVA) was conducted to compare CCT, AXL, PPA, C/D, PPA/D and D between the three groups of patients and Least Significance Difference (LSD) was used to test for differences among the three groups (). P-value < 0.05 was considered significant for all statistical tests. Statistical software SPSS 11.5 for Windows (SPSS Inc., Chicago, IL, USA) was used for conducting the statistical analysis.
Table 3 Descriptive statistics
Table 4 Intergroup variation (ANOVA)
Results
The mean ages of the subjects enrolled in the study were 50.7 (range 43–76), 58.8 (range 46–79) and 55.6 (range 41–72) years, for groups A, B, and C, respectively. The difference in age among the groups was not statistically significant (Kruskal Wallis test, p = 0.07).
Comparing the above mentioned parameters among the three groups (inter-group variation), we found no other statistically significant difference except for the C/D area ratio between healthy (group A) and POAG eyes (group B) (p = 0.002) ().
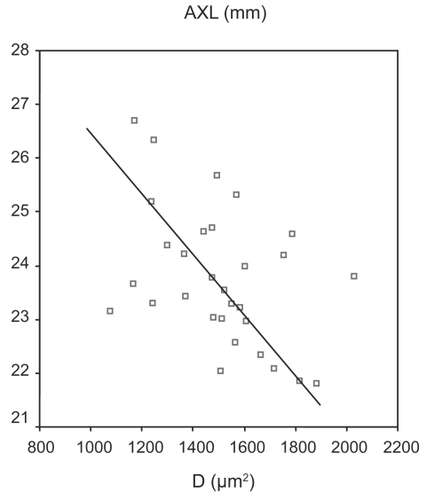
Analyzing group A (healthy eyes) we found a moderate negative relationship between AXL and D (Pearson’s correlation = −0.435, p = 0.015) ().
Figure 6 Relationship between AXL and D in Group A (healthy eyes).
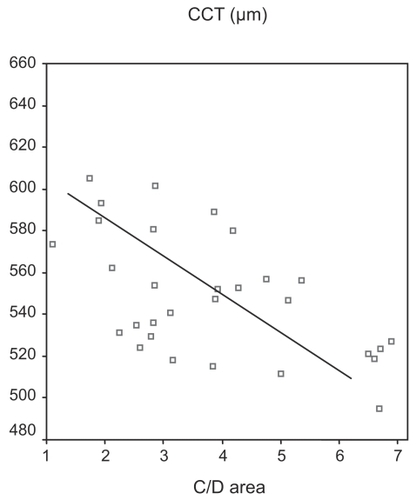
Analyzing group B (POAG eyes) we found a moderate negative relationship between CCT and C/D area ratio (Pearson’s correlation = −0.391, p = 0.033) ().
Figure 7 Relationship between CCT and C/D area in Group B (POAG eyes).
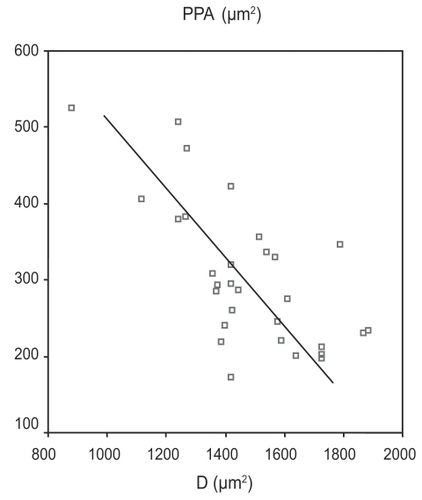
Analyzing group C (OH eyes) we found a strong negative relationship between PPA and D area (Pearson’s correlation = −0.684, p < 0.0001) ().
Figure 8 Relationship between PPA and D in Group C (OH eyes).
Discussion
The nature of PPA is not completely understood, but the most acceptable explanation so far is that it appears due to an incomplete orientation of the borders of the neuroretina, the pigment epithelium, the choroid and the sclera that surround the optic nerve head (CitationFantes and Anderson 1989). This can be caused by the distention of the globe (ie, axonal myopia) or by the inadequate blood supply of that region (CitationHeyreh 1969). The role of PPA in the severity or the progression of glaucoma has not been well established, even though most of the studies conclude to similar results. Jonas and colleagues (1998) compared the peripapillary region of normal eyes and eyes suffering from POAG and found that PPA was significantly larger in the later population (CitationJonas and Naumann 1989; CitationJonas et al 1992). CitationUchida and colleagues (1998) studied a group of eyes with POAG for a period of 8 years and showed a positive correlation between the progression of glaucoma damage and the gradual increase of PPA in these eyes. According to CitationTezel and colleagues (1997), the presence and size of PPA in eyes with ocular hypertension are related to the development of subsequent glaucoma.
The results of our study did not show any significant impact of POAG on PPA compared to normal or OH subjects. The mean value of PPA was found to be larger in POAG and healthy subjects compared to OH but the difference was not statistically different (). This finding could possibly be an indication of more tolerance and stability of this area in OH eyes compared to the other two groups. However, as this was not a longitudinal study, and all POAG patients were newly diagnosed with early to moderate glaucoma, these results could be different if we had to re-examine the 3 groups after few years.
The way that “biomechanical” characteristics of eye structure have been involved in the diagnostic approach of glaucoma, have been studied by many investigators. In a clinical observational study of 861 eyes from three groups (normal, POAG, and OH) CitationJonas and colleagues (2005) found that CCT had a significant positive correlation with the area of neuroretinal rim and a negative correlation with the loss of VF. However he showed that the progression of glaucomatous optic nerve damage was independent of CCT, suggesting that CCT may not play a significant role in the pathogenesis of glaucomatic progression. The same author examined the possible correlation between CCT and lamina cribrosa thickness or thickness of peripapillary area in nonglaucomatous eyes but he failed to show an association (CitationJonas and Holbach 2005). There have been efforts from some investigators to find a possible correlation between the dimensional parameters of the eye globe and its glaucomatous predisposition. CitationLi and colleagues (2002) examined the influence of CCT, corneal curvature, and AXL on IOP of normal eyes and he found only a negative correlation between IOP and AXL (CitationLi et al 2002). On the other hand CitationJonas and Königsreuther (1994) found a significant positive correlation between the optic disc size, the radius of the anterior corneal curvature, and the corneal diameters. In our study we did not find any significant correlation between CCT and PPA in any one of the three groups.
Our finding about the significant difference in C/D area ratio between glaucomatous and healthy eyes was expected, and agrees with the principles of glaucomatous diagnostic criteria, based on the C/D ratio of the vertical diameters of C and D, respectively. On the other hand, C/D area ratio in OH eyes was found to be slightly larger compared to healthy and slightly smaller compared to POAG eyes, but with no significant difference ().
In control group A, we found a moderate negative correlation between AXL and D, but with no statistical significance, while CitationOliveira and colleagues (2007) found that optic disc area increased with AXL in normal eyes of both the white and black population of the study.
Axial length was not correlated with CCT in any group. This finding agrees with the conclusion of CitationShimmyo and Orloff (2005). who found that CCT and AXL are two independent factors, and thin corneas are not associated necessarily with longer eyes.
Another finding of our study was a moderate negative correlation between CCT and C/D area ratio in group B (POAG). This phenomenon could be related with the underestimation of IOP measurement in eyes with thin corneas and probably with the high tolerance of lamina cribrosa in eyes with thick corneas. Based on that remark, we could consider that the coexistence of thin cornea and big C/D area ratio in a glaucoma suspect or an OH patient may contribute to glaucoma progression.
Even though CitationPakravan and colleagues (2007) found that D was inversely correlated with CCT in patients with POAG, we didn’t find any statistical relationship between these two parameters in any one of the three groups.
The finding that needs to be evaluated is the strong negative relationship between D and PPA in group C, which takes into account that the PPA/D area ratio had the smaller standard deviation in the same group (), and may lead to the conclusion that the total area of PPA and D does not differ much among hypertonic eyes. That conclusion supports our initial aspect concerning the higher degree of tolerance and stability of disc and PPA area in OH eyes.
Detailed evaluation of PPA and D together with CCT and AXL in a greater number of subjects and in a prospective design study will probably give us an algorithm for a better approach of glaucoma patient or glaucoma suspect.
Acknowledgments
A part of this study was previously presented at the 6th International Glaucoma Symposium (IGS) that was held in Athens on March 28–31, 2007.
References
- AiraksinenPJJuvalaPATuulonenAKrieglsteinGK1987A change of peripapillary atrophy in glaucomaGlaucoma update IIIHeidelbergSpringer-Verlag97102
- BolandMVQuigleyHA2007Risk factors and open angle glaucoma: classification and applicationJ Glaucoma164061817571004
- BrownKEGongdonNG2006Corneal structure and biomechanics: impact on the diagnosis and management of glaucomaCurr Opin Ophthalmol173384316900024
- Diagnostic criteria for glaucomatous visual field loss2003Terminology and Guidelines for GlaucomaEuropean Glaucoma Society11127
- DoughtyMJZamanML2000Human corneal thickness and its impact on intraocular pressure measures: a review and meta-analysis approachSurv Ophthalmol4436740810734239
- FantesFEAndersonDR1989Clinical histologic correlation of human peripapillary anatomyOphthalmology962052919048
- GordonMOBeiserJABrandtJD2002The Ocular Hypertension Treatment Study: baseline factors that predict the onset of primary open angle glaucomaArch Ophthalmol1207142012049575
- HeyrehSS1969Blood supply of the optic nerve head and its role in optic atrophy, glaucoma and edema of the optic discBr J Ophthalmol53721484982590
- HodappEParrishIIRKAndersonDR1993Clinical decision in glaucomaSt Louis MOCV Mosby Comp5261
- JonasJBNaumannGOH1989Parapapillary chorioretinal atrophy in normal and glaucoma eyes: II. CorrelationsInvest Ophthalmol Vis Sci30919262722448
- JonasJBNguyenXNGusekGC1989Parapapillary chorioretinal atrophy in normal and glaucoma eyes: I. Morphometric dataInvest Ophthalmol Vis Sci30908182722447
- JonasJBFernandezMCNaumannGOH1992Glaucomatous parapapillary atrophy. Occurrence and correlationsArch Ophthalmol110214221736871
- JonasJBKönigsreutherKA1994Macrodiscs in eyes with flat and large corneasGer J Ophthalmol3179818038688
- JonasJBHolbachL2005Central corneal thickness and thickness of the lamina cribrosa in human eyesInvest Ophthalmol Vis Sci461275915790890
- JonasJBStrouxAVeltenI2005Central corneal thickness correlated with glaucoma damage and rate of progressionInvest Ophthalmol Vis Sci4612697415790889
- KiBUDongYLJiTK1998Peripapillary atrophy in normal and primary open angle glaucomaKorean J Ophthalmol1237509753950
- LeskeMCConnellAMSchachatAP1994The Barbados Eye Study. Prevalence of open angle glaucomaArch Ophthalmol11282198002842
- LiQLiMFanZ2002The influence of central corneal thickness and corneal curvature and axial length on the measurement of intraocular pressureYan Ke Xue Bao181768015510750
- OliveiraCHarizmanNGirkinCA2007Axial length and optic disc size in normal eyesBr J Ophthalmol9137916987902
- PakravanMParsaASanagouM2007Central corneal thickness and correlation to optic disc size: a potential link for susceptibility to glaucomaBr J Ophthalmol9126816973656
- ShimmyoMOrloffPN2005Corneal thickness and axial lengthAm J Ophthalmol139553415767076
- SpaethGL1971The normal development of the human chamber angle: a new system of descriptive gradingTrans Ophthalmol Soc UK91709395291556
- TezelGKolkerAEKassMA1997Parapapillary chorioretinal atrophy in patients with ocular hypertension. I. An evaluation as a predictive factor for the development of glaucomatous damageArch Ophthalmol115150389400782
- TielschJMSommerAKatzJ1991Racial variations in the prevalence of primary open angle glaucomaJAMA266369742056646
- UchidaHUgurluSCaprioliJ1998Increasing peripapillary atrophy is associated with progressive glaucomaOphthalmology105154159709771