Abstract
Purpose:
To compare the functional changes in visual fields with optical coherence tomography (OCT) findings in patients with ocular hypertension, open angle glaucoma, and suspected glaucoma. In addition, our purpose is to evaluate the correlation of global indices with the structural glaucomatous defect, to assess their statistical importance in all the groups of our study, and to estimate their validity to the clinical practice.
Methods:
One hundred sixty nine eyes (140 patients) were enrolled. The patients were classified in three groups. Group 1 consisted of 54 eyes with ocular hypertension, group 2 of 42 eyes with preperimetric glaucoma, and group 3 of 73 eyes with chronic open angle glaucoma. All of them underwent ophthalmic examination according to a prefixed protocol, OCT exam (Stratus 3000) for retinal nerve fiber layer (RNFL) thickness measurement with fast RNFL thickness protocol and visual fields (VF) examination with Octopus perimeter (G2 program, central 30–2 threshold strategy). Pearson correlation was calculated between RNFL thickness and global index of VF.
Results:
A moderate correlation between RNFL thickness and indices mean sensitivity (MS), mean defect (MD) and loss variance (LV) of VF (0.547, −0.582, −0.527, respectively; P <0.001) was observed for all patients. Correlations of the ocular hypertension and preperimetric groups are weak. Correlation of RNFL thickness with global indices becomes stronger as the structural alterations become deeper in OCT exam. Correlation of RNFL thickness with the global index of VF, in respective segments around optic disk was also calculated and was found significant in the nasal, inferior, superior, and temporal segments.
Conclusion:
RNFL average thickness is not a reliable index for early diagnosis of glaucoma and for the follow-up of patients with ocular hypertension. Segmental RNFL thickness seems to be a more reliable index. Deep structural alterations with OCT examination constitute an important indication of early functional changes, even if they are not still detected with achromatic perimetry. The MD index of VF seems to be more sensitive for the follow-up of patients with ocular hypertension.
Introduction
Glaucoma is a progressive degenerative neuropathy. It is one of the main causes of irreversible legal blindness worldwide and more specifically the second cause of loss of vision in patients over 40 years of age in the developed countries,Citation1 with an important impact on quality of life.Citation2–Citation4 In the first stages, glaucoma-induced structural alterations (apoptosis of ganglion cells, nerve fiber loss, and optic disk alteration) are asymptomatic and cannot be diagnosed clinically until functional changes are detected such as early scotomas in the visual fields (VF). Quingley and colleagues demonstrated that 40%–50% of axonal loss may occur before any change in visual function is detected with perimetry.Citation5 Early diagnosis of glaucoma, in the first stages, before VF alterations, permits a more accurate treatment with the goal of functional maintenance and preservation of VF with minimum damage.Citation6,Citation7 Peeters and colleagues conducted a meta-analysis of nine ocular hypertension-relevant randomized controlled trials, and one of primary open-angle glaucoma (POAG), and concluded that there is sufficient evidence that ocular hypertension therapy reduces the relative risk of conversion to glaucoma by 14% with each mmHg intraocular pressure (IOP) reduction.Citation8 A study conducted by Esmenjaud found that the optic disc remains a good and simple means for supervising subjects at risk for and in early diagnosis of chronic open-angle glaucoma. The evaluation of changes in the optic disc is greatly aided by systematic recording of observations.Citation9 OCT represents a new type of imaging modality of quantitative assessment of nerve fiber thickness and optic disk parameters. It is used as a more sensitive method for the detection of early structural glaucomatous nerve alterations that precede optic disk and VF damage.Citation10 The purpose of this study is to compare VF alterations with OCT findings in patients with ocular hypertension, chronic open-angle glaucoma, and suspected glaucoma. In addition, our purpose is to evaluate the correlation of global indices with the structural glaucomatous defect, to assess their statistical importance in all groups in our study, and to estimate their validity to the clinical practice.
Methods
This study was performed in the glaucoma department of the 1st University Eye Clinic of Athens from January 2005 to March 2008. Informed consent was obtained from all participating patients. The study followed the guidelines contained in the Declaration of Helsinki and was approved by the ethics committee of the hospital.
One hundred sixty-nine eyes (140 patients) were recruited for this prospective, cross-sectional study, and were classified to three groups. All subjects included in our study were not being treated when presented to the glaucoma department.
Group 1 contained 54 eyes (39 patients) with ocular hypertension. This was defined as IOP above 21 mmHg in three separate measurements, without alterations of the optic disk and with normal VF. Patients in this group were not started on treatment.
Group 2 contained 42 eyes (28 patients) with preperimetric glaucoma. This was defined as IOP above 21 mmHg in three separate measurements, suspicious appearance of the optic disk (OD), ie, one of the following: notching, hemorrhage, and suspicious cup:disk (C/D) ratio > 0.5 considering disk size, with structural alteration to OCT and with normal VF.Citation10–Citation12 This group was also divided in two subgroups, subgroup A with 20 eyes with structural alterations in OCT with probability (P) to be normal <5% and subgroup B with 22 eyes with structural alterations in OCT with P <1%. Patients in subgroup B were started on treatment while patients in subgroup A were not started on treatment.
Group 3 contained 73 eyes (73 patients) with chronic open-angle glaucoma. This was defined as IOP above 21 mmHg in three separate measurements, structural alterations of the OD, and early glaucomatous changes in the VF according to Anderson’s classification. Patients in this group were started on treatment.
The demographics of all groups are summarized in .
Table 1 Demographic data
The inclusion criteria were the following:
Open anterior chamber angle
Best-corrected visual acuity 0.5 (20/40) or better,
Sphere within ± 4 diopters and cylinder within ± 1 diopter.
The exclusion criteria were the following:
Advanced glaucomatous alterations
History of intraocular diseases
Complicated intraocular surgery
Secondary glaucomas (eg traumatic or inflammatory)
Cataract (Lens Opacity Classification System III>1)
Coexisting retinal diseases
Other diseases affecting VF (pituitary lesion, AIDS)
No antiglaucoma treatment at presentation
Medications or others known to affect VF
All patients underwent thorough ophthalmologic examination, including visual acuity, refraction, biomicroscopy, IOP measurement by Goldmann applanation tonometer, gonioscopy by Zeiss four-mirror indirect goniolens (Carl Zeiss Meditec, Dublin, CA, USA), examination of the fundus with a plus 90-D lens, central corneal thickness measurement (with the OcuScan® RxP Ophthalmic Ultrasound System; Alcon, Irvine, CA, USA), automated perimetry (with the Octopus 101 perimeter; Interzeag AG, Schlieren, Switzerland) and OCT of the optic nerve head (with Stratus 3000 software, v. 4.0; Carl Zeiss Meditec).
The VF examinations were performed by the same technician with the Octopus 101 perimeter (G2 program; central 30–2 threshold strategy). Each hemifield was classified as normal or abnormal based upon the following criteria: perimetric defects were defined by the presence of either at least three altered contiguous points with less than 5% probability or at least two altered points with less than 1% probability, and/or global indices of mean sensitivity (MS), mean defect (MD), and loss variance (LV) with less than 2% probability. A minimum of two tests were performed to minimize the learning effect. If any of the two tests failed to fulfill the reliability criteria defined by the perimeter itself (false positive, false negative, and loss of fixation), the test was repeated. Each participant underwent more than one VF examination to test for repeatability. The first of at least two VFs for each patient with similar defects was accepted.
Optical coherence tomography was employed to measure retinal nerve fiber layer (RNFL) thickness. OCT provided cross-sectional imaging by measuring the echo time delay and intensity of backscattered light from retinal tissue with a depth/axial resolution of approximately 10 μm. RNFL scan protocol using circumpapillary scans with a preset diameter of 3.4 mm centered around the optic nerve head was used. RNFL thickness was evaluated on the basis of the average values of the fast RNFL thickness protocol (consisting of three scans each of 256 measuring points captured in 1.8 sec).
Each OCT examination was repeated three times to test repeatability. If the scans series were eligible, ie, without overt image artifacts apart from those owing to the presence of blood vessels or obvious software errors in the RNFL definition, the first scan was used to calculate RNFL thickness values.
Optical technique
Each eye was dilated with 1% tropicamide and 5% phenylephrine before recording the images. Internal fixation was chosen (subject fixation with the eye being studied because of better reproducibility). The patients were classified in three groups based on OCT structural alterations. Group 1 consisted of patients with RNFL thickness within normal limits (ie, that had 95% probability of being normal). Group 2 consisted of patients with RNFL thickness with 5% probability of being normal and group 3 consisted of patients with RNFL thickness with 1% probability of being normal.
The average thickness for each composite scan was calculated by taking the arithmetic mean of the 100 data points. In addition, the peripapillary RNFL thickness was divided into four quadrants defined as superior (46 to 135 degrees), nasal (136 to 225 degrees), inferior (226 to 315 degrees), and temporal (316 to 45 degrees).
OCT analysis
Raw data obtained by OCT were analyzed using standard processing algorithms that measured total retinal and NFL thickness. In addition, the algorithms were corrected for various artifacts, including eye movement, blood vessel shadow, blinks, and media opacities.
Data analysis
Groups were described by mean values ± standard error. Consecutive examinations showed similar effects, even in patients whose both eyes were included in our study. Therefore we consider that intereye bias was eliminated. The primary purpose of the study was to determine the effective correlation between the thickness of RNFL and global indexes of the VF, MS, MD, and LV. Pearson correlation was used to estimate correlation. Subject information was entered into a computer database and analyzed using SPSS software (v. 12.00; SPSS Inc., Chicago, IL, USA).
Results
When examining the whole cohort, an important correlation is observed between average RNFL thickness and global indices, Correlation is positive for the MS, and negative for the MD and LV. In , results of the Pearson correlation between average thickness and global indices of the entire cohort are reported.
Table 2 Pearson correlation of the entire group
When examining eyes belonging to group 1, a positive correlation is observed between average RNFL thickness and MS. In , the results of Pearson correlation between average RNFL thickness and global indices for eyes belonging to group 1 (with ocular hypertension) are presented.
Table 3 Pearson correlation of the 1st group (ocular hypertension)
When examining eyes belonging to group 2, a positive correlation is observed between average RNFL thickness and MS. There is also a negative correlation between average RNFL thickness and LV. In , the results of Pearson correlation between average RNFL thickness and global indices for eyes belonging to group 2 (with preperimetric glaucoma) are presented.
Table 4 Pearson correlation of the 2nd group (preperimetric glaucoma)
When examining eyes belonging to subgroup A of group 2, important correlations are observed between average RNFL thickness and MS (a positive correlation) and MD (a negative correlation). In , the results of Pearson correlation between average RNFL thickness and global indices for eyes belonging to subgroup A of group 2 (preperimetric glaucoma) are reported. Eyes with structural changes in the OCT with P < 5% are classified in this subgroup.
Table 5 Pearson correlation of subgroup A of the 2nd group
When examining eyes belonging to subgroup B of group 2, very important correlations are observed between average RNFL thickness and MS (a positive correlation), MD (a negative correlation) and LV (a negative correlation). In , the results of Pearson correlation between average RNFL thickness and global indices for eyes belonging to the subgroup B of group 2 (preperimetric glaucoma) are reported. Eyes with structural changes in OCT with P < 1% are classified in this subgroup.
Table 6 Pearson correlation of subgroup B of the 2nd group
When examining eyes belonging to group 3, important correlations are observed between average RNFL thickness and MS (a positive correlation), MD (a negative correlation), and LV (a negative correlation). In , the results of Pearson correlation between average RNFL thickness and global indices for eyes belonging to group 3 (early glaucomatous VF alterations) are reported.
Table 7 Pearson correlation of the 3rd group (glaucomatous)
Eyes belonging to group 3 were also examined for possible correlation between average RNFL thickness and global indices for respective quadrants of OCT and VF (). Important correlations between RNFL thickness and indices of the VF were observed for the temporal, superior, inferior, and nasal regions of the optic disk, respectively. This correlation is positive for MS and negative for MD. The results are presented in .
Figure 1 Correlation between OCT and visual fields for the right (OD) and left (OS) eye. The correlation is based on the Urlich model for the distribution of the RNFL around the optic disk.
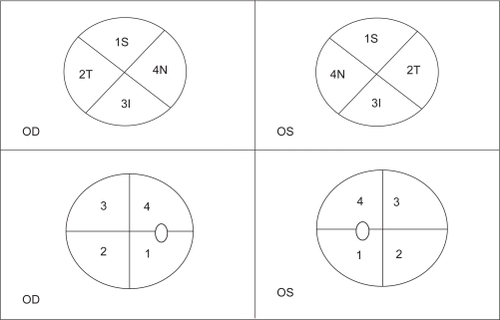
Table 8 Pearson correlation of group 3 (early glaucoma) for respective areas
Discussion
Optical coherence tomography is a relative new method of imaging. OCT offers the possibility of a quantitative and qualitative RNFL thickness analysis.
Halkiadakis and colleaguesCitation13 used scanning laser polarimetry (SLP) to measure RNFL thickness in normal eyes, eyes with suspected glaucoma, and in patients with glaucomatous alterations. Their study showed that average RNFL thickness correlates only with advanced glaucomatous alterations. In our study, we found a statistically significant but moderate correlation between average RNFL thickness measured by OCT and global indices of VFs for our entire cohort classified into three different stages of glaucoma progression.
In a previous study, Zangwill and colleaguesCitation14 compared RNFL thickness measured by OCT with stereophotography of the optic disk and VF in normal eyes, patients with ocular hypertension, patients with suspected glaucoma, and glaucomatous patients and reported that average RNFL thickness seems to be a useful quantitative value for glaucoma diagnosis and follow-up, as an important correlation of 35%–45% between mean deviation of Humphrey achromatic perimetry and RNFL thickness was found. According to the results of our study, average RNFL thickness does not have a strong correlation with the indices of the VF, except in patients with progressive structural alterations (P < 1%) detected with OCT. Therefore, average RNFL thickness does not seem to be a reliable index for the early detection of glaucoma.
In cases of ocular hypertension and preperimetric glaucoma, the correlation of average RNFL thickness with the global indices of the VF is not very strong. The calculated correlation is stronger in eyes with preperimetric glaucoma than in eyes with ocular hypertension. Mayoral and colleaguesCitation15 found that average RNFL thickness can be used as a parameter of distinction between normal eyes, ocular hypertension, and patients with glaucomatous alterations. They also support that RNFL thickness can be used to distinguish ocular hypertension patients from those with early glaucomatous changes detected with chromatic perimetry (short wavelength automated perimetry [SWAP]). Based on our study, we also support the hypothesis that sectoral RNFL thickness is indeed a parameter of detection of structural changes of the nerve fiber around the optic disk. We also support the hypothesis that when the structural alteration is detected with OCT in patients with ocular hypertension, the functional sensitivity seems also to be decreased, although it still ranged within the normal limits of the white perimetry. Further studies that need long follow-up may prove whether early scotomas will eventually appear in the same areas where the early structural glaucomatous changes were detected in OCT.
In our study, we also calculated the correlation of structural alterations in OCT with the functional alterations in the VF for respective areas in patients with preperimetric glaucoma. We have seen that correlation of RNFL thickness with global indices becomes more important as the structural alterations increase. We believe that quantitative analysis of the RNFL thickness is a valuable tool for follow-up. A structural alteration with possibility of P < 1% is an even more valuable index for follow-up of preperimetric patients and perhaps an index of detection of early glaucomatous functional alterations. Further studies are warranted to confirm this hypothesis.
The correlation between the average RNFL thickness and the global indices in the third group (patients with glaucomatous alterations in the VF) is stronger than in the ocular hypertension and preperimetric groups. Hood and colleaguesCitation16 estimated that the sensitivity and specificity of OCT RNFL thickness was 95% and 98%, respectively, and that accurate detection of abnormal hemifields is confirmed with subjective (static automated perimetry) and objective (multifocal visual evoked potentials) functional tests. The results of our study are in agreement with that opinion, even if the correlation between RNFL thickness and the global indices proved to be less important than we believed. This can be explained by the fact that the average RNFL thickness represents the mean thickness of the entire nerve fiber that reaches the optic disk. In the initial stages of glaucoma, many of the nerve fibers are still normal while others have lower thickness because of glaucomatous damage. Therefore, the average RNFL thickness may not reveal sectoral structural alteration of the retinal nerve fibers. The same can be true for VF defects, even in patients of group 3, because the isolated structural change that corresponds to the manifest scotoma is included in the average thickness. Another explanation is that a sectoral depression of the RNFL thickness, if shallow, may not yield functional alterations in VF and there may be a discordance of findings between OCT and achromatic perimetry.
The Navg, Iavg, Savg, and Tavg correlations with the global indices of group 3 for the respective parts of the optic disk are stronger than the one between average RNFL thickness and the global indices. We have found an important and strong correlation for the superior and inferior pole of the optic disk (0.593 and 0.795, respectively) where the majority of the nerve fibers converge to the optic disk. Further studies of correlation may confirm our results and disclose more important correlations. We believe that the RNFL thickness at each part of the optic disk is an important index that represents the correspondence between structural and functional status of the glaucomatous patient. Mean defect by Octopus 101 perimeter correlates better than MS index with RNFL thickness. When analyzing the correlations between MS and MD with RNFL thickness, we observed variable importance among the groups in our study. Correlations of the ocular hypertension patient group were moderate and similar to the preperimetric glaucoma patient group. The correlations became more important and strong when deep structural glaucomatous defects in OCT were detected, even when VF was still considered normal. Especially, MD was an index of an increased importance in our groups following progression of RNFL thickening. In our clinical practice, MD seems to be the most valuable and representative parameter of the glaucomatous damage progression.
In conclusion, we have found that average RNFL thickness does not represent a reliable index for the early diagnosis of glaucoma and for the follow-up of patients with ocular hypertension. Segmental RNFL thickness seems to be a more reliable index. Deep structural alterations found by OCT examination constitute an important indication of early functional changes, even if they are not still detected with the classic automated white perimetry. The MD index of VFs seems to be more sensitive for follow-up of patients with ocular hypertension.
Disclosure
The authors report no conflicts of interest in this work.
References
- KobeltGJonssonBBergströmAChenELindénCAlmACost-effectiveness analysis in glaucoma: what drives utility? Results from a pilot study in SwedenActa Ophthalmol Scand2006843 36337116704699
- SkalickySGoldbergIDepression and quality of life in patients with glaucoma: a cross-sectional analysis using the Geriatric Depression Scale-15, assessment of function related to vision, and the Glaucoma Quality of Life-15J Glaucoma2008177 54655118854731
- McKean-CowdinRWangYWuJAzenSPVarmaRImpact of visual field loss on health-related quality of life in glaucoma: the Los Angeles Latino Eye StudyOphthalmology20081156 941948.e117997485
- GoldbergIClementCIChiangTHWaltJGLeeLJGrahamSHealeyPRAssessing quality of life in patients with glaucoma using the Glaucoma Quality of Life-15 (GQL-15) questionnaireJ Glaucoma2009181 61219142128
- QuingleyHAAddicksEMGreenRWOptic nerve damage in human glaucoma III; quantitative correlation of nerve fiber loss and visual field defect in glaucoma, ischemic neuropathy, papilledema and toxic neuropathyActa Ophthalmol1982100135146
- SharmaPSamplePAZangwillLMSchumanJSDiagnostic tools for glaucoma detection and managementSurv Ophthalmol200853Suppl 1 S17S3219038620
- HazinRHendrickAMKahookMYPrimary open-angle glaucoma: diagnostic approaches and managementJ Natl Med Assoc20091011 465019245072
- PeetersAWebersCAPrinsMHZeegersMPHendrikseFSchoutenJSQuantifying the effect of intraocular pressure reduction on the occurrence of glaucomaActa Ophthalmol2009427 [Epub ahead of print]
- EsmenjaudEModifications papillaires précoces et glaucome chronique à angle ouvertJ Fr Ophtalmol2004271 243314968074
- LalezaryMMedeirosFAWeinrebRNBaseline optical coherence tomography predicts the development of glaucomatous change in Glaucoma suspectsAm J Ophthalmol20061424 57658217011848
- MardinCYHornFKJonasJBBuddeWMPreperimetric glaucoma diagnosis by confocal scanning laser tomography of the optic discBr J Ophthalmol1999833 29930410365037
- MayoralFPoloVFerrerasALarrosaJMPueyoVHonrubiaF[Diagnostic ability of stratus optical coherence tomography (OCT) in pre-perimetric glaucoma diagnosis]Arch Soc Esp Oftalmol2006819 53754417016786
- ShahNNBowdCMedeirosFACombining structural and functional testing for detection of glaucomaOphthalmology20061139 1593160216949444
- HalkiadakisIKipiotiAEmfietzoglouIComparison of optical coherence tomography and scanning laser polarimetry in glaucoma, ocular hypertension, and suspected glaucomaOphthalmic Surg Lasers Imaging2008392 12513218435336
- ZangwillLMWilliamsJBerryCCKnauerSWeinrebRNA comparison of optical coherence tomography and retinal nerve fiber layer photography for detection of nerve fiber layer damage in glaucomaOphthalmology20001077 1309131510889104
- MayoralFLPoloVFerrerasA[Diagnostic ability of stratus optical coherence tomography (OCT) in pre-perimetric glaucoma diagnosis]Arch Soc Esp Oftalmol20068153754417016786
- HoodDCHarizmanNKanadaniFNRetinal nerve fibre thickness measured with optical coherence tomography accurately detects confirmed glaucomatous damageBr J Ophthalmol2007917 90590717301118