Abstract
Background:
To compare the daily costs of 3 prostaglandin analogues (bimatoprost, latanoprost, travoprost), alone, and associated with timolol in 4 European countries (Denmark, Finland, Germany, and Sweden).
Methods:
Six glaucoma products were sampled by buying 5 bottles from 1 suburban pharmacy in each of the 4 countries. Drops were weighed by a single operator at 1 site according to standardized procedures. Residual drops were then counted. Unit bottle costs were estimated from tariff lists. Eye-drop weights were entered into a nested analysis of variance comprising drug, instillation day, country, the interaction, and a sample factor nested within the country factor. Effectiveness was represented by treatment failure rates estimated from a meta-analysis and a general practitioner survey.
Results:
Every drug bottle contained sufficient drops to treat 1 patient for 28/31 days. Drop-size heterogeneity between countries was observed for bimatoprost and bimatoprost/timolol. Mean travoprost and travoprost/timolol drop-sizes were the smallest, and drop-counts per bottle were the lowest for latanoprost, or latanoprost/timolol. In all 4 countries annual costs were least for travoprost and travoprost/timolol.
Conclusions:
On taking into account drug costs and effectiveness, travoprost and travoprost/timolol were cheaper and more effective than latanoprost and latanoprost/timolol and were cheaper than bimatoprost and bimatoprost/timolol.
Introduction
Glaucoma prevalence in industrialized countries ranges from 1% to 3% and constitutes a major cause of irreversible blindness worldwide.Citation1 Its most common form in adults is primary open-angle glaucoma (POAG), which is associated with increased intraocular pressure (IOP) and leads to progressive visual field loss.Citation2 To preserve visual function, it is essential to prevent optic nerve damage by decreasing intraocular hypertension.
First-line treatment in POAG aims at reducing IOP, usually with one of the following three prostaglandin analogues (PGAs): latanoprost 0.005% (Xalatan®; Pfizer Inc., New York, NY, USA), travoprost 0.004% (Travatan®; Alcon Inc., Fort Worth, Texas, USA), and bimatoprost 0.03% (Lumigan®; Allergan Inc., Irvine, CA, USA). When any of these single agents fails to control IOP sufficiently it is customary to add a beta-blocker, often in a fixed combination. Various fixed combinations have recently become available, eg, bimatoprost 0.03%/timolol (Ganfort®; Allergan Inc., Irvine, CA, USA), latanoprost 0.005%/timolol (Xalacom®; Pfizer Inc, New York, NY, USA), and travoprost 0.004%/timolol (DuoTrav®; Alcon Inc., Fort Worth, Texas, USA).
Optimization of expenditure on medical resources first depends on evaluating efficacy and safety data, but subsequently extends to disease costs and, in particular, treatment costs. Several clinical trials have directly compared the aforementioned PGAs, in monotherapy and in fixed combinations with timolol.Citation3–Citation18 A meta-analysis by Denis et al Citation19 found that IOP was better controlled (1 mmHg, approx) by travoprost or bimatoprost than by latanoprost, ie, the incidence rate ratio (IRR) of IOPs > 18 mmHg was 1.17 (1.00; 1.35) higher with latanoprost.
Treatment costs are important not only to health authorities but also to general practitioners responsible for their drug budgets, as in Germany. Several studies have focussed on glaucoma drug costs, using various methods and economic indicators (eg, costs per mmHg decrease; costs to attain a 20% IOP decrease).Citation20–Citation24 The number of eye-drops in a bottle (drop-count) is also a major item when estimating daily treatment costs, as the drop-count fixes the number of treatment days delivered per bottle.
According to the study conducted by Frankel in the United States, bimatoprost 0.03% had the lowest monthly and annual costs and the greatest cost effectiveness for lowering IOP compared with latanoprost 0.005% and travoprost 0.004%. The savings came from more drops in a bimatoprost bottle (113 for bimatoprost 0.03%, 84 for latanoprost 0.005%, and 83 for travoprost 0.004%), resulting in longer treatment duration per bottle. Cost effectiveness was based on an average cost per mmHg reduction IOP.
The aim of this manuscript was to check whether the above results would apply to 4 selected EU countries. This study compares the daily and annual treatment costs associated with various first-line and second-line treatments for patients with glaucoma or IOP in several European countries.
Methods
The study included 4 European countries: Denmark, Finland, Germany, and Sweden. Three first-line, single agents for IOP control were compared, ie, bimatoprost 0.03% (BP), latanoprost 0.005% (LP), and travoprost 0.004% (TP). Similarly, 3 fixed-combination agents for second-line therapy were compared, ie, bimatoprost 0.03%/timolol (BP/T), latanoprost 0.005%/timolol (LP/T), and travoprost 0.004%/timolol (TP/T).
Drop-count estimate
Each of the 6 glaucoma treatments was sampled by buying 5 new eye-drop bottles (4 bottles of travoprost 0.004% in Finland, only) from 1 suburban pharmacist in each of the 4 countries. All bottles had similar expiry dates and all were sent to the US for centralized drop-count and drop-size evaluations, performed by a single assessor in order to reduce measurement variability.
Measurement methods followed standard operating procedures. Bottles were numbered sequentially and all outer encumbrances were removed (eg, shrink bands and obvious closure rings). Each container was weighed and its dispensing angle for drop expression was specified and recorded. A weigh boat, or suitable container, was centered on the balance pan and tared. A sample bottle was selected and shaken, as appropriate, before removing the cap. Any overflow was recorded before the bottle was held above the weigh boat, at the desired angle from horizontal, and finally 1 drop was dispensed into the weigh boat. The bottle number and drop weight (‘drop-size’ to the nearest 0.0001 g, 0.1 mg) were recorded. The sequence was repeated for the second drop. The cap was then replaced and the bottle stored upright for reweighing on subsequent days.
According to the relevant Summaries of Product Characteristics,Citation25 shelf-life after bottle opening ranged from 28 to 31 days, depending on the product and country. Hence a maximum of 62 measurements were performed, as above, on every bottle of all 6 drugs purchased in each of the 4 countries, to represent patients’ daily instillations. On the day when the last of 62 weighings was completed, the procedure continued until the bottle was empty in order to measure the total fill of each bottle and, in due course, estimate the average number of drops in a bottle and total fill (sum of drop weights). The percentage of total product remaining in each bottle, after 62 weighings were completed, was also estimated and averaged. Observations were averaged for the total fill in grams (SD; range), drop-size in milligrams (SD; range), and total drop-count per bottle (SD; range).
Treatment cost estimation
Treatment costs, expressed as euros (2008), were estimated for each country and agent in terms of average drop count and local retail price. Annual and daily costs were calculated for each agent and country, based on local public pricesCitation26–Citation29 and treatment durations of 28 and 31 days per month, as specified in the Summary of Product Characteristics of the country concerned.
Statistical analysis
The statistical analysis was performed with SAS software (SAS Institute, North Carolina, USA) Release No. 9.1. All statistical tests were interpreted two-sided with alpha fixed at 5%.
Drop-sizes (mg) for the first 62 drops per bottle of each agent were analyzed in order to evaluate experimental reliability, and drop-size variability was estimated across instillation days and between countries for each agent.
A nested analysis of variance was conducted separately for each agent comprising ‘day’ and ‘country’ factors treated as fixed effects, their possible interaction, and a ‘sample factor’ nested within the ‘country factor’. Except for 1 missing sample (Finland: travoprost 0.004%) the design was fully balanced. Homoscedasticity and normality of the residues were checked. Graphs plotted the average daily drop-size evolution per agent for individual countries, or overall, according to observed statistical significances. Stepwise regression analyses determined effects and the best-fitting trend generated by linear, quadratic, and cubic models.
Results
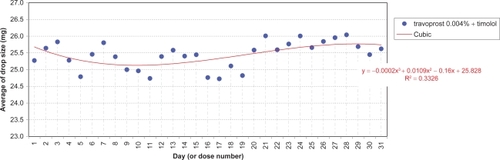
The daily evolution of average drop-sizes over 1 month is shown in to for monotherapy and to for fixed combination agents. Statistically significant differences in drop-size were observed across simulated instillation days with all agents in all 4 countries. In particular, both the LP () and LP/T () curves differ from those of alternative agents by decreases of average drop-size over time. The TP () and TP/T () curves show slight fluctuations about steady average drop-sizes.
Figure 1 Bimatoprost 0.03%: daily average of drop size by country and trend fitting.
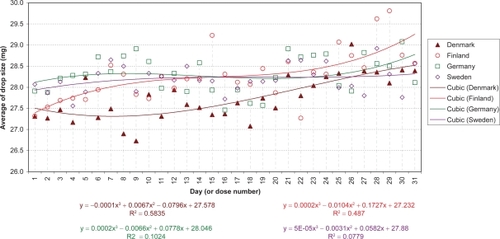
Figure 2 Latanoprost 0.005%: daily average of drop size and trend fitting.
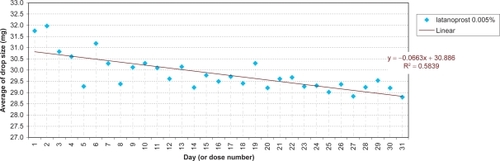
Figure 3 Travoprost 0.004%: daily average of drop size and trend fitting.
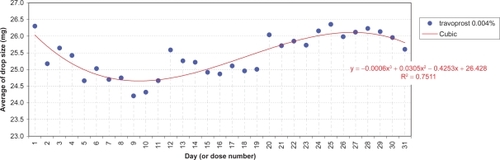
Figure 4 Bimatoprost 0.03% + timolol: daily average of drop size by country and trend fitting.
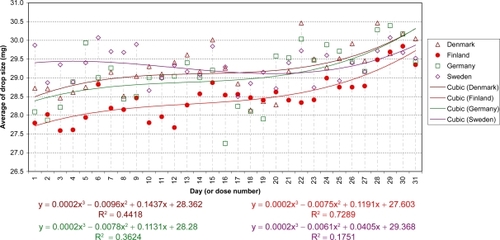
Figure 5 Latanoprost 0.005% + timolol: daily average of drop size and trend fitting.
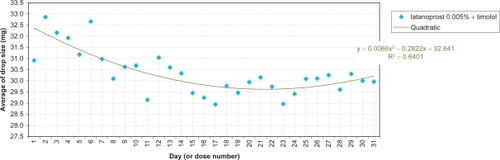
Figure 6 Travoprost 0.004% + timolol: daily average of drop size and trend fitting.
Significant differences between countries were observed with BP and BP/T. The BP curve for Denmark indicates a smaller mean drop-size during the first half of the month, compared to all other countries (; P < 0.0001). This is reflected in where the mean drop-size was less than in all other countries, which were similar. The BP/T curve for Finland indicates smaller mean drop-sizes across the entire experimental period, especially in the first half of the month, compared to its curves in other countries (; P < 0.0001). This conforms to the mean drop-size in . Other BP/T trend differences between countries indicate increasing mean drop-sizes over time (high at the end of the month) for Denmark and Germany, and a slow biphasic trend for Sweden (decreasing at the start of the month, then rising).
Table 1 Daily drop-size (mg) by country of each drug
to present the mean total fill and drop-counts of all 6 agents (monotherapy and fixed combinations) per country. Drop-counts were highest for BP/T and decreased in the sequence LP/T > TP/T in all countries. The mean drop-count per bottle varied from 79 to 115 across all agents, but was always least with LP and LP/T. Given the number of drops required for 62 instillations over 31 days, the remaining ‘unused’ drops per bottle were least for LP and LP/T (+21% to +24%) in all countries. The percentage of remaining drops was highest for TP/T (+41% to +46%) in all countries, except Finland, and slightly less for BP and BP/T (+39% to +42%).
Table 2 Prostaglandin analogue monotherapy bottle contents and costs (euros) for Denmark
Table 3 Prostaglandin analogue monotherapy bottle contents and costs (euros) for Finland
Table 4 Prostaglandin analogue monotherapy bottle contents and costs (euros) for Germany
Table 5 Prostaglandin analogue monotherapy bottle contents and costs (euros) for Sweden
Table 6 Prostaglandin analogue/timolol fixed combination bottle contents and costs (euros) for Denmark
Table 7 Prostaglandin analogue/timolol fixed combination bottle contents and costs (euros) for Finland
Table 8 Prostaglandin analogue timolol fixed combination bottle contents and costs (euros) for Germany
Table 9 Prostaglandin analogue/timolol fixed combination bottle contents and costs (euros) for Sweden
Annual and daily costs of glaucoma treatment were calculated for each country based on public retail prices ( to ). Annual costs (based on 28/31 days per month) of the three first-line monotherapy agents were higher for LP than BP (€13/€12) or TP (€22/€20) in Germany, and higher than BP (€45/€40) or TP (€45/€40) in Denmark. In Sweden, TP was cheaper than both BP and LP. For second-line fixed combinations, annual costs were more for LP/T than BP/T (€46/€41) or TP/T (€46/€41) in Sweden. Annual costs were also more for LP/T than BP/T (€12/€10) or TP/T (€41/€35) in Germany. In Finland LP/T and BP/T were equal in price, but cost more than TP/T (€12/€11). In Denmark BP/T cost more than both LP/T (€15/€14) and TP/T (€37/€34), but LP/T cost more than TP/T (€22/€19). Thus, irrespective of country and duration of treatment, the least expensive drug combination overall was TP/T followed by BP/T or LP/T, depending on the country.
Discussion
Our analysis shows that daily and annual costs of both TP and TP/T, after taking account of product shelf-life, were less than those of all corresponding glaucoma products in all four countries studied.
Our findings differ from those of Frenkel et al who considered that glaucoma products could be used until a bottle is empty.Citation20 The latter study was performed in the US, where the healthcare environment and economic analytic methods differed from those of the present study, which followed European Summaries of Product Characteristics recommendations on product shelf-life following bottle opening. Obviously, their estimates would not apply to EU countries in which patients are advised to renew their medication when shelf-life is exceeded.
Lastly, their cost-effectiveness decision rule was based on average ratio, while incremental cost-effectiveness ratio is the estimate which is recommended by most health economics guidelines, leading to inefficient resource allocation. Also, IOP, a surrogate end-point of glaucoma progression, was used as an effectiveness parameter, although it is no more than a clinical trial efficacy parameter. Health authorities are not paying to reduce IOP, but to avoid blindness.
Drop-size has economic significance, too, which may be understood as follows. The conjunctival cul-de-sac normally holds 7 to 9 μL of tearsCitation30,Citation31 and contains a maximum fluid content of about 30 μL.Citation30 Hence, an instillation volume of 20 μL is usually considered adequate.Citation32 In fact, the average drop-size in all countries studied always exceeded 20 μL, but only the first 20 μL would remain in the eye. Some of the remainder would be partially absorbed, with possible systemic effects, with the remainder coursing down the cheek and leading to possible skin effects. Nonetheless, a sufficient delivery of drug into the eye is assured. However, from bioavailability and toxicological points of view volumes <20 μL should be instilled.Citation33–Citation35 Moreover, smaller drop-sizes minimize waste and increase the number of drops available from bottles filled to a standard volume. Amongst monotherapy products TP bottles delivered the smallest drop sizes, as did TP/T amongst fixed combinations. Drop-size is determined by various factors, eg, design and physical characteristics of the dropper tip and bottle, physico-chemical properties of the solution, and the manner in which the patient dispenses drops.Citation36
The methods we used to count drops were highly standardized in order to minimize the biases when comparing drop counts between brands. Therefore, it probably does not truly reflect the clinical reality of glaucoma patients and counts realized according to daily practice might be associated with higher variability. However, we think that the probability of getting contradictory results in daily practice might be low, when brand bottles look very similar. Drop counts collected with a medical device at the patient home would be required to confirm our findings.
All sampled eye-drop bottles provided sufficient drops for 28 to 31 days of treatment, as required by the Summaries of Product Characteristics. Extra drops were an assurance that the bottles could be used up to at least 28 or 31 days. Among monotherapy products, TP and BP provided greater surety than LP in all 4 countries. For fixed combination products, TP/T provided the greatest reserve in all 4 countries. Extra drops are important as older and some younger patients find it difficult to instill glaucoma drops and sometimes may miss entirely.Citation37–Citation39 In such situations TP and TP/T bottles provided the greatest reserve of drops, despite containing less fluid than their competitors.
The fact that for BP and BP/T we found different drop-counts between countries raises the question of cost generalizations between countries and suggests that purchasers might well conduct counts before reaching decisions. Also, parallel imports might not be neutral in terms of the number of drops provided.
Of course, pharmaceutical savings are not sufficient when considering treatment costs and must be set in the context of effectiveness. In this respect, a recent meta-analysis by Denis et alCitation19 showed that monotherapy with 2 recent PGAs (TP and BP) were more effective than LP in controlling IOP. According to data in the UK GPRD, the probability of no treatment switch with TP as first-line treatment was 69.5% after 1 year.Citation40 On applying the IRR (1.17), measured by Denis et al Citation19 the probability of no treatment switches with LP as first-line treatment was 59.4%, about 10% more than with TP. Therefore, costs generated by more frequent treatment switchesCitation41 must be added to the higher price of LP. Consequently, in the present 4 European countries, TP would better control IOP at a lower treatment cost.
A similar conclusion may be drawn for second-line fixed combination treatments. According to Denis et alCitation42 the probability of a treatment switch with TP/T instillations is less than for LP/T. Consequently, patients treated with the first-line/second-line sequence TP/TP/T would experience fewer treatment failures than those treated with the LP/LP/T sequence. At 60 months TP used as the first-line prostaglandin followed by TP/T as the second-line treatment would avoid one third-line prescription in every 11 incident cases. Since, in the present 4 countries, TP and TP/T drug costs were less than those of LP and LP/T, respectively, the former drug sequence would provide a better IOP control at a lower treatment cost. A full cost-effectiveness analysis needs to be conducted to confirm these hypotheses.
Our survey suffers from several limitations. First, we purchased only a maximum of 5 bottles in each country from a single selected pharmacy, hence national extrapolation is questionable. Second, we assumed that our procedure mimicked the patients’ mode of instillation. Our standardized methodology, however, allowed us to obtain unbiased drop-counts from all bottles. Nonetheless, we recognize that real life instillation practices vary widely and that the drop-size ranges we used are probably under-estimated. Third, the evaluation was not ‘blinded’, ie, the investigator knew the treatment in each bottle. However, our measurements were objective and our procedures standardized, reproducible and validated. Fourth, we used only direct drug costs when claiming for lower cost, other costs were not taken into account. Hence, our survey is preliminary and a full evaluation is under investigation. On the other hand, from a societal point of view, costs are known to increase with accumulating treatment failures.Citation41 Hence, the cost differences reported in this paper represent a conservative estimate of the true differences. Fifth, no sensitivity analysis was performed for potential wasted drops, ie, missed instillations and monthly extra drops used in real life. These associated costs, however, may be extrapolated directly from the tables. Lastly, we did not account for patient compliance which is known to be rather poor in glaucoma treatment.Citation43,Citation44 This could affect the number of days within a bottle, especially if patients do not account for the expiratory date.
Conclusions
In Denmark, Finland, Germany and Sweden, eye-drop bottles of travoprost 0.004% ± timolol incurred the lowest annual treatment costs, while providing sufficient surplus to compensate for potential fluid wastage from missed instillations, when compared to bimatoprost 0.03% ± timolol and latanoprost 0.005% ± timolol.
Disclosures and acknowledgments
This study was supported by an unrestricted grant from Alcon France SA, Rueil-Malmaison, France, and was conducted according to local laws. It was contracted to IMS France, Puteaux, France. Gilles Berdeaux is employed by Alcon France.
We would like to thank Robert Pigache MD for reviewing the English language.
References
- MaierPCFunkJSchwartzerGAnterGFalck-YtterYTTreatment of ocular hypertension and open angle glaucoma: meta-analysis of randomised controlled trialsBMJ200533113415994659
- The AGIS InvestigatorsThe Advanced Glaucoma Intervention Study (AGIS): 7. The relationship between control of intraocular pressure and visual field deteriorationAm J Ophthalmol200013042944011024415
- ChengJWWeiRLMeta-analysis of 13 randomized controlled trials comparing bimatoprost with latanoprost in patients with elevated intraocular pressureClin Ther20083062263218498911
- DenisPLaunoisRDevauxMBerdeauxGComparison of diurnal intraocular pressure control by latanoprost versus travoprost: results of an observational surveyClin Drug Investig200626703714
- DirksMSNoeckerRJEarlMRohSWilliamsRDA 3-month clinical trial comparing the IOP-lowering efficacy of bimatoprost and latanoprost in patients with normal-tension glaucomaAdv Ther20062338539416912020
- DubinerHBSircyMDLandryTComparison of the diurnal ocular hypotensive efficacy of travoprost and latanoprost over a 44-hour period in patients with elevated intraocular pressureClin Ther200426849114996520
- García-FeijooJMartínez-de-la-CasaJMCastilloAMéndezCFernández-VidalAGarcía-SánchezJCircadian IOP-lowering efficacy of travoprost 0.004% ophthalmic solution compared to latanoprost 0.005%Curr Med Res Opin2006221689169716968572
- HepsenIFOzkayaE24-h IOP control with latanoprost, travoprost, and bimatoprost in subjects with exfoliation syndrome and ocular hypertensionEye20072145345816543930
- KonstasAGHollóGIrkecMDiurnal IOP control with bimatoprost versus latanoprost in exfoliative glaucoma: a crossover, observer-masked, three-centre studyBr J Ophthalmol20079175776017124241
- KonstasAGKozobolisVPKatsimprisIEEfficacy and safety of latanoprost versus travoprost in exfoliative glaucoma patientsOphthalmol2007114653657
- KozOGOzsoyAYarangumeliAKoseSKKuralGComparison of the effects of travoprost, latanoprost and bimatoprost on ocular circulation: a 6-month clinical trialActa Ophthalmol Scand20078583884317680841
- MartinezASanchezMBimatoprost/timolol fixed combination vs latanoprost/timolol fixed combination in open-angle glaucoma patientsEye20092381081818535605
- NetlandPALandryTSullivanEKTravoprost compared with latanoprost and timolol in patients with open-angle glaucoma or ocular hypertensionAm J Ophthalmol200113247248411589866
- NoeckerRSDirksMSChoplinNTA six-month randomized clinical trial comparing the intraocular pressure-lowering efficacy of bimatoprost and latanoprost in patients with ocular hypertension or glaucomaAm J Ophthalmol2003135556312504698
- OrzalesiNRossettiLBottoliAFogagnoloPComparison of the effects of latanoprost, travoprost, and bimatoprost on circadian intra-ocular pressure in patients with glaucoma or ocular hypertensionOphthalmol2006113239246
- ParrishRKPalmbergPSheuWPXLT Study GroupA comparison of latanoprost, bimatoprost, and travoprost in patients with elevated intraocular pressure: a 12-week, randomized, masked-evaluator multicenter studyAm J Ophthalmol200313568870312719078
- QuarantaLPizzolanteTRivaIHaidichABKonstasAGStewartWCTwenty-four-hour intraocular pressure and blood pressure levels with bimatoprost versus latanoprost in patients with normal-tension glaucomaBr J Ophthalmol2008921227123118586898
- TopouzisFMelamedSDanesh-MeyerHA 1-year study to compare the efficacy and safety of once-daily travoprost 0.004%/timolol 0.5% to once-daily latanoprost 0.005%/timolol 0.5% in patients with open-angle glaucoma or ocular hypertensionEur J Ophthalmol20071718319017415690
- DenisPLafumaAKhoshnoodBMimaudVBerdeauxGA meta-analysis of topical prostaglandin analogues intra-ocular pressure lowering in glaucoma therapyCurr Med Res Opin20072360160817355741
- FrenkelREPFrenkelMTolerAPharmacoeconomic analysis of prostaglandin and prostamide therapy for patients with glaucoma or ocular hypertensionBMC Ophthalmol200771617900371
- GaoYWuLLiADaily cost of glaucoma medications in ChinaJ Glaucoma20071659459718091176
- FiscellaRGGreenAPatuszynskiDHWilenskyJMedical therapy cost considerations for glaucomaAm J Ophthalmol2003136182512834665
- RylanderNRVoldSDCost analysis of glaucoma medicationsAm J Ophthalmol200814510611318154755
- Azuara-BlancoABurrJThe rising cost of glaucoma drugsBr J Ophthalmol20069013013116424517
- VidalEdition du VidalParis2008
- Rote List. http://www.rote-liste.de
- Social Insurance Institution. Kela. Medicinal products database. http://asiakas.kela.fi/laakekys_app/LaakekysApplication?kieli=en
- TLV. Tandvårds- och läkemedelsförmånsverket. http://www.tlv.se/in-english/price-database/
- Laegemiddel Styrelsen. Danish Medicines Agency. Medicinpriser.dk. http://www.medicinpriser.dk/
- MishimaSGassetAKlyceSDBaumJLDetermination of tear volume and tear flowInvest Ophthalmol196652642765947945
- EhlersNThe precorneal film. Biomicroscopical and chemical investigationsActa Ophthalmol1965Suppl 811134
- MishimaSClinical pharmacokinetics of the eye. Proctor lectureInvest Ophthalmol Vis Sci1981215045416116682
- ChraiSMakoidMEriksenSRobinsonJDrop size and initial dosing frequency problems of topically applied ophthalmic drugsJ Pharm Sci1974633333384820359
- ShellJOphthalmic drug delivery systemsSurv Ophthalmol19842917791828
- UrttiASalminenLMinimizing systemic absorption of topically administered ophthalmic drugsSurv Ophthalmol1993374354568100087
- Van SantvlietLLudwigADeterminants of eye drop sizeSurv Ophthalmol20044919721314998692
- TsaiTRobinALSmithJP3rdAn evaluation of how glaucoma patients use topical medications: a pilot studyTrans Am Ophthalmol Soc20071052933Discussion 33–35.18427591
- RobinALNovackGDCovertDWCrockettRSMarcicTSAdherence in glaucoma: objective measurements of once-daily and adjunctive medication useAm J Ophthalmol200714453354017686450
- SleathBRobinALCovertDByrdJETudorGSvarstadBPatient-reported behavior and problems in using glaucoma medicationsOphthalmol2006113431436
- LafumaABerdeauxGCosts and effectiveness of travoprost versus a dorzolamide + timolol fixed combination in first-line treatment of glaucoma: analysis conducted on the United Kingdom General Practitioner Research DatabaseCurr Med Res Opin2007233009301617958945
- DenisPLafumaABerdeauxGMedical predictive factors of glaucoma treatment costsJ Glaucoma20041328329015226656
- DenisPLe PenCUmuhireDBerdeauxGTreatment carryover impacts on effectiveness of intraocular pressure lowering agents, estimated by a discrete event simulation modelEur J Ophthalmol200818445118203084
- TraversoCEWaltJGSternLSDolgitserMPharmacotherapy compliance in patients with ocular hypertension or primary open-angle glaucomaJ Ocul Pharmacol Ther200925778219232009
- HollóGKóthyPGéczyAVarghaPPersonality traits, depression, and objectively measured adherence to once-daily prostaglandin analog medication in glaucomaJ Glaucoma20091828829219365193