Abstract
Objective:
To calculate the pattern deviation for identifying abnormal points of pupil perimetry, and also to evaluate the grayscale display for distinguishing glaucomatous pupil field loss (abnormal test points) from normal pupil field (normal test points).
Methods:
Fourteen patients ranging in age from 51 to 80 years, who had normal-tension glaucoma (6 eyes) and primary open-angle glaucoma (8 eyes) were tested. Pupil perimetry (Kowa & Hamamatsu, Japan) was used to objectively measure the visual field. Also, to obtain a subjective visual field, the analysis was performed with a Humphrey Field Analyzer (30-2, Full threshold program, Carl Zeiss Meditec, Dublin). Of the 76 test points, the 22 surrounding points and the 3 points corresponding to the blind spot are excluded; and among the remaining 51 points, the 85th percentile value of pupil perimetry was calculated. The abnormal and normal test points were recorded, and the amount of positive or negative deviation of each test point from the normal median value for the corresponding test points was determined. We also used this technique to identify the value for distinguishing glaucomatous pupil field loss from the normal pupil field.
Results:
This study could be improved by calculating the sensitivity and specificity of a certain cut-off value between the normative data and the glaucoma patients. The value for identifying both abnormal and normal test points was a negative deviation of −4. Based on these results, pupil perimetry gray scales were determined: white (< −3), 25% gray (from −4 to −8), 50% gray (from −9 to −13), 75% gray (from −14 to −18) and black (> −19). Glaucomatous pupil field losses were generally distinguished from the normal pupil field by use of a gray scale.
Conclusion:
Our studies demonstrated that, when a deviation of > −4 was regarded as an abnormal value, the detection of pupil perimetry exhibited improvement in glaucoma patients.
Introduction
Glaucoma is a relatively common disease in which the death of retinal ganglion cells causes a progressive loss of sight, often leading to blindness. Visual field assessment provides information essential for the diagnosis and management of glaucoma. There have been several new developments in automated threshold perimetry, which has been shown to be a rapid and effective method of detecting glaucomatous visual field loss. However, the accuracy and reliability of measurements of the visual field with these standard perimeters depends upon the cooperation of the patient.Citation1,Citation2
Pupil perimetry uses the pupillary light reflex to make possible an objective analysis of the visual field. This method requires little effort and attention on the part of the patient, and may reflect damage at an earlier stage of the relevant disease.Citation3 In the past, several attempts that used the pupillary light reflex have been made.Citation4–Citation11 However, this method also has disadvantages, which include doubts as to whether the pupil field defects actually reflect the visual field loss. The main problem related to the worsening of detection defects was that the normal values for differentiating an artifact from pupil field defects could not be established in past pupil field study.
At present, the concept of pattern deviation has been widely accepted as a viable type of analysis for identifying abnormal points using the Humphrey® Field Analyzer (Carl Zeiss Meditec, Dublin, Ireland). Pattern deviation is expressed as a value representing the difference between an age-matched norm (median value) and the threshold for each test point after correction for the degree of sensitivity of the entire visual field. Our recent study demonstrated that age-matched normal pupil constriction data can be obtained using innovated pupil perimetry, and confirmed the individual variations of pupillary responses at each test point by pupil perimetry in a large group of healthy subjects.Citation12
Based on these background studies, the purpose of this study was to calculate the pattern deviation of pupil perimetry as a new objective assessment, and also evaluate the gray scale for distinguishing between a glaucomatous pupil field loss point and a normal pupil field point.
Methods
Glaucoma patients
There were 14 patients (10 men, 4 women) enrolled in this study, ranging in age from 51 to 80 years (mean age, 61.4 years). The patients comprised cases of normal-tension glaucoma (NTG, 6 eyes) and primary open-angle glaucoma (POAG, 8 eyes). The inclusion criteria required a corrected visual acuity of 1.0 (= 0 logMAR) or better and a pupil size of at least 2.5 mm without dilation. Among the exclusion criteria of the patients were severe cataracts (grade III to V in the Emery-Little classification) and drugs affecting the pupil, particularly pilocarpine. Also, this study examined patients without any systemic or ophthalmic diseases likely to affect the visual field (apart from glaucoma). Prior to the study, all patients were examined with a Humphrey Field Analyzer (30-2, Full threshold program). The mean deviation (MD) value ranged from −6.50 dB to −20.18 dB. Patients with more than 20% false-positive or false-negative responses were excluded. A diagnosis of POAG was based on Anderson and Patella’s criteria,Citation13 as well as on a glaucomatous optic disc, and an intraocular pressure (IOP) of more than 21 mmHg measured with the applanation tonometer. Some NTG patients had visual field defects and optic disc changes as well as a diagnosis of POAG, but none had an IOP of more than 20 mmHg. The definition of a visual field defect used the pattern deviation plot obtained with the above-mentioned program. A minimum scotoma diagnosis required at least three adjacent points depressed at P < 0.5% on the pattern deviation probability plot.
The research followed the tenets of the Declaration of Helsinki. Informed consent was obtained from all patients prior to participation in the experiment.
Measurement procedures
We used pupil perimetry, which combined automated static perimetry and infrared pupillography (Kowa and Hamamatsu, Japan). This pupil perimeter was developed by Yoshitomi et alCitation5 and enabled the automatic rejection of artifacts such as blinking and fixation.
After dark adaptation for 10 minutes, each patient was sat in a chair comfortably and was asked to fixate on a red light point at the center of the stimulus background.
A light stimulus of 1.7° (Goldmann V) with an intensity of 1000-apostilb was presented at each of 76 test locations with a background luminance of 6-apostilb. The pupil response was obtained from the pupil diameter tracings before light stimulation (baseline pupil diameter, a), and the minimum diameter during light stimulation (b). The following calculation was then performed: percentage of pupil constriction (%) = (a–b)/a × 100.
Visual fields were confirmed with the above-mentioned 30-2 program on the Humphrey Field Analyzer, and the visual field defects.
Data analysis
A database based upon 90 normal subjects included the median percentage pupil constriction for each of the 30-2 test points (blind spot, 3° above and below, excluded) in the stimulated areaCitation12 (). To assess the ability of pupil perimetry to detect glaucomatous field loss (ie, abnormal points) and normal field points, the results from our 14 patients were analyzed in several ways.
Figure 1 The raw data median values (percentage of pupil constriction) of pupil perimetry for 74 test locations.
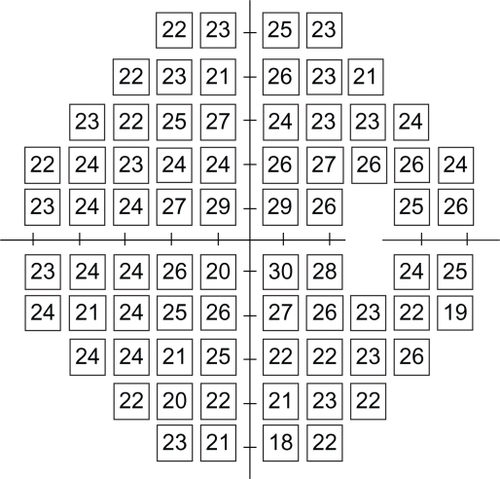
First, we calculated the pattern deviation for identifying abnormal points on pupil perimetry. Of the 76 test points, the 22 surrounding points and the 3 points corresponding to the blind spot (3° above and below, and 9° below) were excluded, and among the remaining 51 points, the sensitivity of the seventh highest point when compared with the norm (ie, the 85th percentile value) was used as the standard degree of sensitivity for the entire visual field.Citation14 Probability plots of pattern deviation on the Humphrey Field Analyzer were expressed in the following five grades: • (dot), 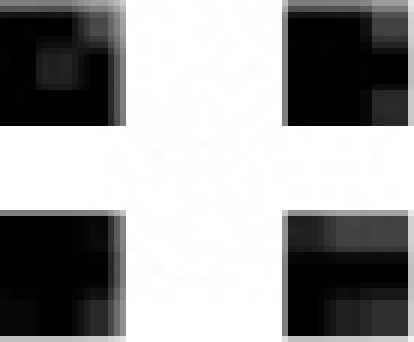 (P < 5%),
 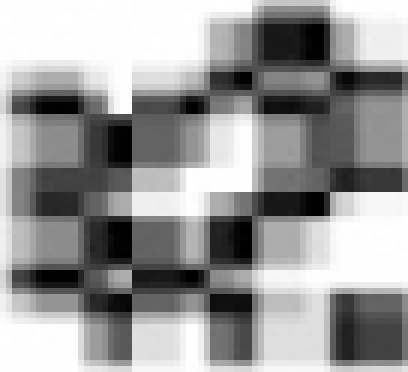 (P < 2%),
 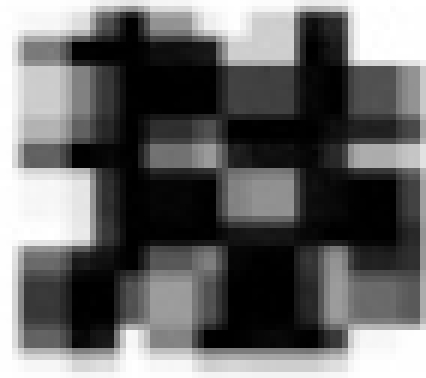 (P < 1%) and
  (P < 0.5%).
As with detecting defects of pupil perimetry, the rate of detection of probability plot abnormalities (P < 5% or less) on pattern deviation and pupil field abnormalities independent of the gray scale display in each value of deviation (from −1 to −10) compared with the healthy subjects database was investigated. We also used this technique to identify the value for distinguishing glaucomatous field loss from the normal pupil field (one point being indicated by one square in to ). The following calculations were performed: ratio of abnormal points to abnormal plots (%) = number of abnormal pupil field points/number of abnormal probability plots. The proportion of the normal visual field was also calculated: ratio of normal points to normal plots (%) = number of normal pupil field points (indicated by white)/number of normal probability plots (indicated by dots [total 74 test points – number of abnormal probability plots]). Comparisons of these two ratios were performed using a Student’s t-test. Results are presented as mean ± standard deviation.
Figure 2 The ratio of abnormal to normal points identified by respective numerical values is shown in each deviation.
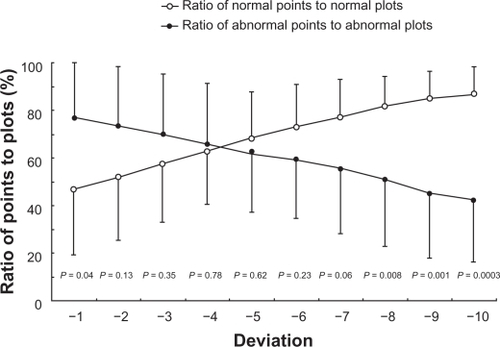
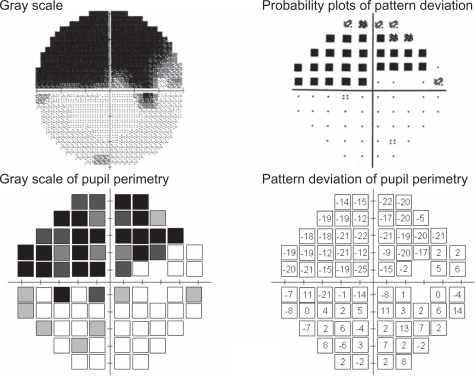
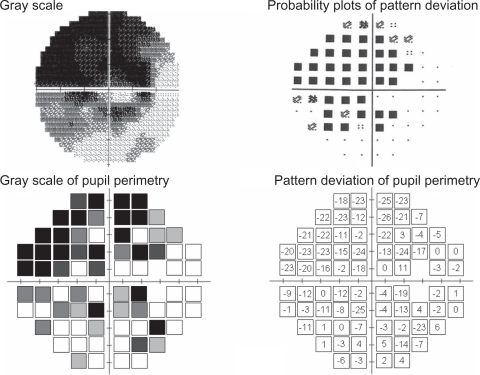
Figure 3 Example of good correspondence with pupil perimetry and Humphrey Field Analyzer in a glaucoma patient (male, 52 years old, NTG, MD −14.02 dB).
Based on the above results, pupil perimetry gray scales were assessed in the following five grades so as to correspond with the probability plots of the HFA: white, gray 1 (25% of black), gray 2 (50% of black), gray 3 (75% of black) and black.
Results
shows the ratio of abnormal to normal points identified by respective numerical values for distinguishing glaucomatous field loss from the normal pupil field. The value to identify the test points with abnormal and normal values was −4 of deviation. This value was associated with the ratio of abnormal points to abnormal plots (66.0 ± 25.5%) and the ratio of normal points to normal plots (62.6 ± 22.2%). The difference between these two ratios was the least significant (P = 0.78).
On the basis of this result, pupil perimetry gray scale values were assessed in the following five grades: white (negative deviation of less than 4: <−4), 25% gray (from −4 to −8), 50% gray (from −9 to −13), 75% gray (from −14 to −18) and black (negative deviation of more than −19).
The results of three patients are presented here, since they were typical of our patients. They include a superior and an inferior arcuate defect, and a nasal step. The visual field results obtained with the Humphrey Field Analyzer (gray scale and pattern deviation plot) together with the pupil perimetry results (gray scale and pattern deviation values compared with our healthy subject database) are presented for each patient. Patient 1 (a 52-year-old man, NTG, MD −14.02 dB, ) showed glaucomatous field losses almost completely distinguished from the normal pupil field. The ratio of abnormal points to abnormal plot detection defects and the ratio of normal points to normal plot normal pupil field detection were 91.4% (31/35) and 66.7% (28/39), respectively. Patient 2 (female, 68 years old, NTG, MD −7.63 dB, ) had visual field loss with diffuse defects with Humphrey standard automated perimetry. This patient had incomplete detection (especially, abnormal test points) between these two perimeters. These above-mentioned two ratios were 38.1% (8/21) and 86.8% (46/53). Despite his age (78 years), patient 3, who had POAG with MD −16.86 dB had a generally well-detected visual field and pupil field defects (). These ratios of abnormal to normal points were 76.6% (36/47) and 70.4% (19/27), respectively.
Figure 4 Incomplete visual field detection was seen in a woman (68 years old, NTG, MD −7.63 dB) with diffuse defects by standard automated perimetry.
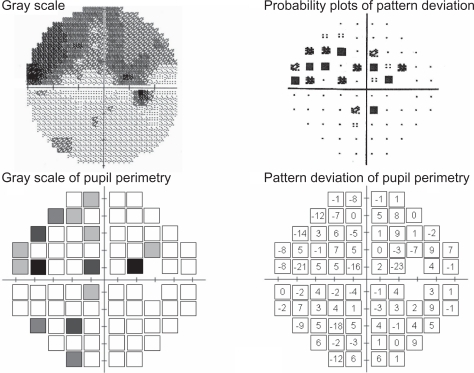
Figure 5 The patient in this case was the oldest of our group (male, 78 years old, POAG, MD −16.86 dB). Pupil field defects were present in the visual field
Discussion
In past pupil field study, pupil perimetry for glaucoma patients has provided details on the variability and difficulty, which limits its use in a clinical setting. The problems involved anatomical differences in the characteristics of the retinal ganglion cells and the visual and light reflex pathways. Additionally, standard pupil constriction values cannot be established because the pupil field varies considerably between individuals, and because of variations within the same individual also.Citation6,Citation15,Citation16 Furthermore, the pupil fields exhibited a maximal percentage of pupil constriction as the white portion of the gray scale. When artifacts were included, the gray scale maps indicated pupil field deficits even in the normal test points. With regard to pupil perimetry data analysis, Schmid et alCitation9 proposed that each matching defect in the pupil and visual fields be evaluated independently by three doctors as a good or a poor match without applying statistical criteria. Therefore, not only was it impossible to compare the results with those of other subjects, but also, in clinical settings, it became necessary to depend upon subjective data obtained from raw pupillary traces and percentage pupil constriction.
In this study, we evaluated the pattern deviation of pupil perimetry, and also determined the gray scale display for differentiating a glaucomatous pupil field loss from a normal pupil field in each patient. The results of our study demonstrate the accuracy of the clinical assessments that can be successfully performed and used as values of gray scale in pupil perimetry. However, not every patient showed good correspondence between results for pupil field and light threshold. Although pupil perimetry generally well detected visual field defects in glaucoma with absolute scotoma, diffuse visual field defects exhibited various patterns. Moreover, our results also show that in all patients, there was a pronounced decrease of pupil constriction from the center to the periphery.
The question that is raised by these results is whether or not neuronal cell loss,Citation17 increased cataractCitation18 or decreased pupil sizeCitation19,Citation20 are responsible for the reduction of the pupil response that occurs with age. With regard to the conditions of light stimulation, it is possible that the use of a small or dim light stimulus might be below the minimum level required to cause pupil constriction. Conversely, the use of brighter or bigger stimuli increased the amount of stray light, so that the maximal level of stimulus brightness that can be used is limited. Furthermore, other characteristics such as the Stiles-Crawford effect on the pupil field might possibly be involved, thereby limiting the data that can be obtained. Previous studies on the visual field have reported that with ageing there was a steeper decline of the light sensitivity towards the periphery,Citation21,Citation22 and that this decline was due to the loss of peripheral photoreceptors and ganglion cells as compared to the central cones.Citation23,Citation24 Thus, further studies using improved measuring apparatus that is capable of evaluating the field periphery are required.
Moreover, unfortunately, the design of this study does not permit claims of true test sensitivity and specificity to be made. To overcome this problem, further studies establishing clinical criteria similar to those of Anderson and PatellaCitation13 for diagnosing glaucoma using pupil perimetry are needed.
However, our objective method of pupil perimetry also has several advantages. Most patients stated that they preferred undergoing this automated perimetry examination because it was free of decision-making and performance pressure. The method requires no special technical expertise, and the patient need only fixate the eye on a central red point. Also, the time required for measurement (almost 4 minutes) is considerably shorter than that for automated perimetry. Our pupil perimetry glaucoma detection and pattern deviation analysis methods (pupil perimetry glaucoma detection analysis, PPGDA), can therefore be used for reliable detection and confirmation of visual field loss in glaucoma patients.
Conclusions
Our results demonstrate that, with the use of our technique of pattern deviation and the pupil perimetry gray scale, the glaucomatous pupil field losses can generally be distinguished from the normal pupil field in glaucoma patients, and also that there is a need to establish the optimal conditions and test points for pupil field periphery detection.
Acknowledgements
The authors are grateful to Mr CWP Reynolds for linguistic assistance with the manuscript. Also, the author is deeply indebted to his co-author Mr Akihiro Tanakadate, who died last year before the conclusion of this study.
Disclosures
The authors have no proprietary or commercial interest in any materials mentioned in this article. The authors have no industry relationships to disclose.
References
- HeijlALindgrenGOlssonJThe effect of perimetric experience in normal subjectsArch Ophthalmol198910781862642703
- YoungWOStewartWCHuntHCrosswellHStatic threshold variability in the peripheral visual field in normal subjectsGraefes Arch Clin Exp Ophthalmol19902284544572227491
- HongSNarkiewiczJKardonRHComparison of pupil perimetry and visual perimetry in normal eyes: decibel sensitivity and variabilityInvest Ophthalmol Vis Sci20014295796511274072
- KardonRHKirkaliPAThompsonHSAutomated pupil perimetry: Pupil field mapping in patients and normal subjectsOphthalmology1991984854952052302
- YoshitomiTMatsuiTTanakadateAIshikawaSComparison of threshold visual perimetry and objective pupil perimetry in clinical patientsJ Neuroophthalmol199919899910380129
- WilhelmHNeitzelJWilhelmBPupil perimetry using M-sequence stimulation techniqueInvest Ophthalmol Vis Sci2000411229123810752964
- SchmidRCeurremansPLuedtkeHWilhelmBWilhelmHEffect of age on the pupillomotor fieldJ Neuroophthalmol20042422823415348991
- KawasakiACrippaSAndersonSKardonRHThe pupil response to large regional stimuli in patients with focal visual field lossNeuroophthalmology200529143147
- SchmidRLuedtkeHWilhelmBWilhelmHPupil campimetry in patients with visual field lossEur J Neurol20051260260816053467
- SkorkovskáKLüdtkeHWilhelmHWilhelmBPupil campimetry in patients with retinitis pigmentosa and functional visual field lossGraefes Arch Clin Exp Ophthalmol200924784785319096865
- PapageorgiouEWermundTWilhelmHPupil perimetry demonstrates hemifield pupillary hypokinesia in a patient with a pretectal lesion causing a relative afferent pupil defect but no visual field lossJ Neuroophthalmol200929333619458574
- AsakawaKShojiNIshikawaHTanakadateAEvaluation of age-related pupil light reflex on pupil perimetryJ Jpn Ophthalmol Soc2009113727731
- AndersonDRPatellaVMAutomated Static Perimetry2nd edMosbySt. Louis1999
- LeskeMCHeijlAHymanLBengtssonBEarly manifest glaucoma trial: Design and baseline dataOphthalmology19991062144215310571351
- LoewenfeldIENewsomeDAIris mechanics. I. Influence of pupil size on dynamics of pupillary movementsAm J Ophthalmol1971713473625100474
- KawasakiAMoorePAKardonRHVariability of the relative afferent pupillary defectAm J Ophthalmol19951206226337485364
- BalazsiAGRootmanJDranceSMSchulzerMDouglasGRThe effect of age on the nerve fiber population of the human optic nerveAm J Ophthalmol1984977607666731540
- HennellyMLBarburJLEdgarDFWoodwardEGThe effect of age on the light scattering characteristics of the eyeOphthalmic Physiol Opt1998181972039692043
- ThompsonHSAfferent pupillary defects: Pupillary findings associated with defects of the afferent arm of the pupillary light reflex arcAm J Ophthalmol1966628608735928836
- BitsiosPPrettymanRSzabadiEChanges in autonomic function with age: A study of pupillary kinetics in healthy young and old peopleAge Ageing1996254324389003878
- KatzJSommerAAsymmetry and variation in the normal hill of visionArch Ophthalmol198610465683942546
- ZulaufMNormal visual fields measured with Octopus programm G1. I. Differential light sensitivity at individual test locationsGraefes Arch Clin Exp Ophthalmol19942325095157959088
- CurcioCAAllenKATopography of ganglion cells in human retinaJ Comp Neurol19903005252229487
- JonasJBSchneiderUNaumannGOCount and density of human retinal photoreceptorsGraefes Arch Clin Exp Ophthalmol19922305055101427131