 ?Mathematical formulae have been encoded as MathML and are displayed in this HTML version using MathJax in order to improve their display. Uncheck the box to turn MathJax off. This feature requires Javascript. Click on a formula to zoom.
Abstract
Developing diagnostic scores for prediction of clinical outcomes uses medical knowledge regarding which variables are most important and empirical/statistical learning to find the functional form of these covariates that provides the most accurate prediction (eg, highest specificity and sensitivity). Given the variables chosen by the clinician as most relevant or available due to limited resources, the job is a purely statistical one: which model, among competitors, provides the most accurate prediction of clinical outcomes, where accuracy is relative to some loss function. An optimal algorithm for choosing a model follows: (1) provides a flexible, sequence of models, which can ‘twist and bend’ to fit the data and (2) use of a validation procedure that optimally balances bias/variance by choosing models of the right size (complexity). We propose a solution to creating diagnostic scores that, given the available variables, will appropriately trade-off model complexity with variability of estimation; the algorithm uses a combination of machine learning, logistic regression (POLYCLASS) and cross-validation. For example, we apply the procedure to data collected from stroke victims in a rural clinic in India, where the outcome of interest is death within 30 days. A quick and accurate diagnosis of stroke is important for immediate resuscitation. Equally important is giving patients and their families an indication of the prognosis. Accurate predictions of clinical outcomes made soon after the onset of stroke can also help choose appropriate supporting treatment decisions. Severity scores have been created in developed nations (for instance, Guy’s Prognostic Score, Canadian Neurological Score, and the National Institute of Health Stroke Scale). However, we propose a method for developing scores appropriate to local settings in possibly very different medical circumstances. Specifically, we used a freely available and easy to use exploratory regression technique (POLYCLASS) to predict 30-day mortality following stroke in a rural Indian population and compared the accuracy of the technique with these existing stroke scales, resulting in more accurate prediction than the existing scores (POLYCLASS sensitivity and specificity of 90% and 76%, respectively). This method can easily be extrapolated to different clinical settings and for different disease outcomes. In addition, the software and algorithms used are open-source (free) and we provide the code in the appendix.
Introduction
The general problem of creating diagnostic scores for prediction of clinical outcomes can be divided into two parts: (1) choosing the most medically relevant set of variables regarding the outcome of interest (clinical expertise) and (2) combining these variables in a functional form (model) that provides the most accurate future prediction of the outcome (statistical expertise). This paper proposes a general solution to (2), which can be applied to any setting and any outcome. For general purposes of illustrating the power of the method, we use prediction of 30-day mortality following stroke in a rural Indian population as an example.
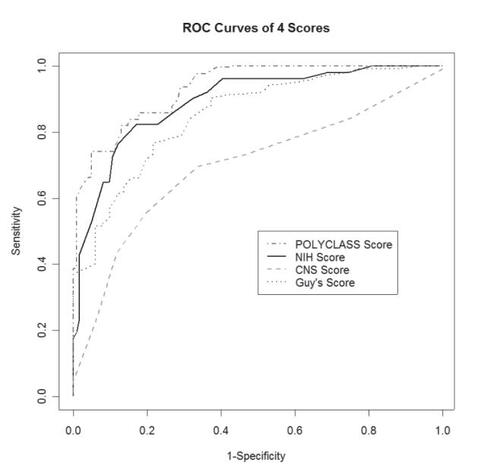
Figure 1 Receiver operating characteristic (ROC) curves on the full data for the 4 scores.
Strokes account for 5.54 million deaths worldwide (CitationWHO 2004), being the second commonest cause of mortality. Recent data suggest that two-thirds of these deaths occur in less developed countries (CitationWHO 1989). Risk factors for poor outcome following stroke include age, severity of stroke, impaired consciousness on admission (measured by Glasgow Coma Scale [GCS]; CitationTeasdale and Jennett 1974), atrial fibrillation, previous stroke, hyperglycemia (CitationWeir et al 1997), fever (CitationReith et al 1996; CitationKammersgaard et al 2002), and urine incontinence (CitationBarer 1989). GCS score, developed to predict outcomes after head injury, has also been used to predict mortality in stroke. The scale is simple and can be used both for management as well as prognosis (CitationWeir et al 2003).
A quick and accurate diagnosis of stroke is important for immediate resuscitation. Equally important is giving patients or their families an indication of the prognosis. Accurate predictions of outcome made soon after the onset of stroke can also help choose appropriate supporting treatment decisions. To be clinically meaningful, a model used to predict outcome following stroke needs to be simple, accurate, and reliable, and been validated in diverse clinical settings. Because the profile of stroke in the developed and developing world is different, it is important to have a model which predicts mortality accurately in developing countries (CitationWang et al 2001). In this paper, we present a black-box statistical method for stroke prediction in a rural hospital in Sevagram, India.
Black-box means there is a fixed algorithm applied to data where the data is fed and both the diagnostic score function and its estimated precision are returned. In this case, the outcome is binary (yes/no) so we use a previously published logistic regression model selection tool, POLYCLASS, which searches through a sequence of models to find the best among that sequence. POLYCLASS (CitationKooperberg et al 1997) is an exploratory, data-adaptive regression technique that can be used to predict categorical (including binary) outcomes. This technique has been used recently to predict treatment failure in malaria (CitationDorsey et al 2004). By using a forward addition and backward deletion approach, it searches through a series of models defined by main effects, splines, and cross-products to create a logistic regression model. The procedure uses cross-validation to choose the complexity (number of basis functions for the model), implicitly balancing the variance versus bias of the classification error. We used this technique to predict 30-day mortality following stroke in a rural Indian population and compared the accuracy of the technique with three stroke scales (Guy’s prognostic score [GHS], Canadian Neurological Score [CNS], and the National Institute of Health Stroke Scale [NIHSS]).
Data
Setting and study design
The Mahatma Gandhi Institute of Medical Sciences (MGIMS), Sevagram, India is a 648-bed teaching institution. The institution is a rural center with 300,000 patient visits per year, and about 5500 patient admissions to medicine wards per year. Residents, supervised by the internal medicine faculty, evaluate all stroke patients. We prospectively recruited consecutive patients with suspected stroke admitted to the MGIMS hospital between December 1999 and March 2001. Stroke was defined according to the World Health Organization (WHO) definition as the clinical syndrome of rapid onset of focal (or global, as in subarachnoid hemorrhage) cerebral deficit, lasting more than 24 hours or leading to death, with no apparent cause other than a vascular one (CitationWHO 1989). We excluded patients presenting 24 hours after the onset of stroke, those who have had a past stroke, those whose complete data were not available, those whose residence precluded follow-up, and those who either died before complete data could be collected or had an alternate diagnosis on computed tomography (CT) brain scan.
Definitions and baseline measures
We prospectively collected the following data at the time of admission: age at the time of stroke, sex, axillary temperature, GCS, systolic blood pressure (SBP), diastolic blood pressure (DBP), pattern of breathing (rate and rhythm were measured and rate between 10 to 14, and absence of abnormal pattern was classified as normal), admission blood sugar level, and urine incontinence. All variables except GCS, temperature, SBP, and DBP were dichotomized. The pattern of breathing was categorized as normal or abnormal. Hyperglycemia was defined as admission blood sugar of >180 mg/dL. Urine incontinence was defined as any episode of incontinence during the first 48 hours after stroke—patients with a urinary catheter or penile sheath were classified as incontinent. The presence of following comorbid conditions was assessed: history of hypertension, diabetes, rheumatic heart disease, atrial fibrillation, and coronary artery disease.
Computation of stroke scores
We assessed the extent of neurologic deficit by using the GCS (CitationTeasdale and Jennett 1974) and three stroke scales (NIHSS, GHS, and CNS). Two investigators (VS and PB) prospectively collected the clinical data required for the three standard stroke scores. The assessment was done within 24 hours after the event. The NIHSS has scores ranging from 0 to 42 (0 indicates no neurologic deficit and 42 indicates coma and quadriplegia). A score greater than 25 indicates very severe impairment, between 15 and 25 severe impairment, between 5 and 15 mild to moderately severe impairment, and less than 5 mild impairment. The CNS evaluates six clinical signs: a score of <4.5 will identify patients with poor outcome. The GHS uses 10 variables and categorizes patients on admission into groups with a good, intermediate, or poor chance of recovery: a score of −2.5 implies an even chance of recovery, and scores of −15 and +10 suggest a 95% likelihood of poor and good outcome, respectively.
Outcome assessment
The primary outcome was 30-day mortality categorized as alive or dead. We assessed the outcome during the 30-day follow-up visits of the patients to the hospital; we visited within a week after day 30 those who could not come to the hospital.
Method
To evaluate the risk factors associated with 30-day mortality, we used POLYCLASS regression analysis. This data-adaptive logistic regression technique combines stepwise (hierarchical) addition and deletion of variables and finds a linear combination of variables that provides a better predictor of outcome event (Appendix A). The final result is a logistic regression model where the relevant information for creating a prediction model is (1) the basis functions chosen (eg, main effects, interactions, etc) and (2) the associated coefficients. Given the resulting model, a set of predictors for a new subject can be converted to a single score based on this model, corresponding to the estimated probability of mortality.
To compare the predictive accuracy of the final POLYCLASS model with that of three stroke scoring scales (NIHSS, GHS, and CNS), we plotted receiver operating characteristic (ROC) curves. We defined sensitivity and specificity for the cut point on a stroke scoring system, as the respective proportion of survivors and deaths that were correctly predicted. We defined the positive predictive value as the proportion of patients predicted to die who actually died and negative predictive value as proportion of patients who were predicted to survive and actually survived. The area under the curve and its standard error was calculated to measure the prognostic information provided by each of the scores (CitationDeLong et al 1988).
We assessed the accuracy of the final POLYCLASS model by using V-fold cross-validation method (Citationvan der Laan and Dudoit 2003) (Appendix B). The performance measures of interest were the sensitivity and specificity as applied to the validation sets for each of the candidate scores (NIHSS, GHS, CNS, and POLYCLASS).
Cross-validation is a technique that has been used to determine the best fit model given a particular dataset. This method is used to select among various models, otherwise known as estimators, in the statistical framework. Citationvan der Laan and Dudoit (2003) proposed a unified cross-validation methodology for the selection among estimators. These authors propose a specific framework known as the estimation road map. The road map will be discussed below.
Estimation road map
Initially, the observed data will be defined as O = (Y, X), where Y corresponds to the outcome variable and X = X1,…, Xp are the covariates of interest. The initial step of this road map involves defining the parameter of interest in terms of a loss function, which measures the performance of the parameter. In the case of regression, the parameter of interest can be defined as ψ(X) = E(Y∣X), and corresponds to a regression model. The loss function in a regression model could be defined as the squared error loss function L(Y, X, ψ) = (Y−ψ(X))2.
The second step of the methodology constructs candidate estimators based on the defined loss function. Therefore, a set of candidate estimators are constructed for a parameter of interest. Black box algorithms, such as POLYCLASS (CitationKooperburg et al 1997), MARS (CitationFriedman 1991), or the D/S/A algorithm (CitationSinisi and van der Laan 2004) are examples of data adaptive methods which can be implemented to determine a candidate estimator.
The third step of the road map involves cross-validation estimator selection. This method will use the cross-validation methodology to assess the performance of each estimator based on a loss function of the observed data. This is performed by initially defining the training and validation sets of the observed data. In the case of 5-fold cross-validation, the sample will be broken into fifths. The training set will consist of 4/5 of the data and the validation set will correspond to 1/5 of the data. Over all combinations, there exist 5 validation sets and 5 corresponding training sets. A model will be built on the training set (4/5 of the data), and this model will subsequently be applied on the corresponding validation set and the respective loss function will be evaluated on this latter set. The method will be repeated over the five combinations of training and validation sets and the final cross-validated loss function will be the average of these 5 individual loss functions. The estimator with the smallest cross-validated risk will be chosen as the optimal model.
Optimality properties
Citationvan der Laan and Dudoit (2003) have also proven asymptotic optimality of the cross-validated selector under general conditions. This optimality principle states that this cross-validated selector asymptotically performs as well as the estimator that would have been chosen if the true data generating distribution was known (the so-called oracle estimator). This methodology is easily adapted to a variety of applied situations, eg, varying models, and can be easily adapted to machine learning algorithms to determine the optimal model.
We used two steps to find a specific cut-off to predict scores. First, we constructed the score. This was done for the NIHSS, GHS, CNS scores and the predicted probabilities of mortality from resulting logistic regression model were used for the POLYCLASS alternative. Second, we chose a cutpoint that will allow us to discriminate between survival and death for our future patients. To compare the scores, we decided that the cut-off value chosen from each score type would be one for which the smallest value resulted in at least 90% estimated sensitivity on the training data set. This cut-off value was then applied to the remaining validation fifth of the data and the number in each cell of a 2 × 2 table corresponding to the predicted (the rows) and the observed (the columns) mortality of subjects in the validation set were recorded. This was repeated for all possible 5 configurations of training and validation sets and each time the 2 × 2 table for each score was updated by adding to the appropriate cells (Appendix B regarding the construction of a training and validation set). We then calculated the sensitivity and specificity of the competing scores in these summary tables. The statistical analyses were performed using R 2.01 (R Foundation for Statistical Computing, Vienna, Austria). The detailed code of the implementation for this specific data is included in Appendix B.
Results
Baseline characteristics and stroke outcome
Between December 1999 and January 2001, a total of 206 stroke patients were admitted to the hospital, of them 31 were excluded from the study (11 had a previous stroke, 9 died before complete data could be collected, 4 had an alternate diagnosis on CT brain scan, 7 could not be followed up). The remaining 175 patients meeting the study criteria consisted of 67 women and ranged in age from 18 and 90 years of age (mean [SD] age 59.3 [13.4] years). Most patients (81%) were from rural areas. All except 16 were followed up at home. CT scan confirmation was obtained for 52% of them. The CT scan showed intracerebral hemorrhage in 58 patients (33.1%; 95% CI: 26.2, 40.6) and infarction in 117 (66.8%; 95% CI: 59.3, 73.7). There was no significant age difference between those patients who underwent a scan and those who did not. Also, the mean GCS scores did not differ much between those who underwent a CT scan and those who did not (11.8 vs 11.6, respectively).
The final model chosen by POLYCLASS included four predictors (GCS score, temperature, abnormal respiration, and incontinence) and one interaction term. The GCS score and the temperature were continuous variables; we created dummy variables (yes = 1, no = 0) for abnormal respiration and incontinence, and a multiplicative interaction term: incontinence * temperature. The model had the following form:
shows the area under the curve (AUC) for the three scores and the POLYCLASS technique. The POLYCLASS model had the largest empirical AUC (0.93) as compared with the other 3 scoring techniques. Because AUC for POLYCLASS does not take into account that the data were used to fit the model, we also compared the predictive accuracy of the models using the cross-validation method. compares the sensitivity and specificity of the scores with that of POLYCLASS technique. All scores had similar sensitivity (around 90%), but compared with the specificity of the three stroke scale scores that ranged between 43.6% and 64.6%, POLYCLASS technique was more specific (75.8%).
Table 1 Estimated area under the ROC and inference for the four scoring methods. The standard error was estimated using method proposed by CitationDeLong and colleagues (1988)
Table 2 Results from cross-validation showing the specifi city for fi xed sensitivities that are at least 90% on the training data sets for the 3 scores and POLYCLASS. The resulting sensitivities and specifi cities are shown for the validation data sets (those data not used for determining the cut-offs)
Discussion
The final model chosen by the POLYCLASS technique suggests that GCS, admission temperature, abnormal breathing pattern, and urine incontinence are key predictors of 30-day stroke mortality among patients in this data. Previous statistical models that predicted 30-day mortality for stroke patients have been developed in the Western world, but these measures may not be appropriate in the developing countries. Patients in developing the countries tend to be younger, often report late to the hospital and may have significant co-morbid diseases. Also, patients reporting to the hospital in central India are more likely to have haemorrhagic stroke compared to the western patients (CitationBadam et al 2003). Therefore the scoring techniques developed in Western countries may not always accurately predict short term mortality in stroke patients from developing countries, such as India. We have proposed an existing powerful and flexible regression technique, POLYCLASS, which predicts stroke by including both nonlinear dose-response terms (splines) and multiplicative interactions. In addition, the procedure uses cross-validation to choose the optimal predictive model.
As further validation of the technique, beyond its relative accuracy at prediction, is that the risk factors chosen by POLYCLASS have been noted before as predictors of death. For instance, fever has been previous associated with higher stroke mortality; among 260 patients with acute stroke, mortality at 3 months was 1% in normothermic patients compared with 16% in patients with fever (>37·5 °C) in the first 72 hours (CitationCastillo et al 1998). In addition, in a meta-analysis of nine studies with a total of 3790 patients with stroke, CitationHajat and colleagues (2000) concluded that fever after stroke onset is associated with a substantial increase in stroke morbidity and stroke mortality (relative risk 1· 19). The GCS, widely used to assess consciousness after stroke, has been shown to be a good predictor of short-term mortality. For instance, CitationWeir and colleagues (2003), showed that the total GCS score had positive and negative predictive value 73% and 70% respectively for predicting 3-month mortality in stroke (area under the curve 0.74). Urine incontinence, a strong marker of stroke severity, has previously been reported as a strong predictor of mortality (CitationKhan et al 1981; CitationWade and Hewer 1985; CitationWeen et al 1996; CitationBrittain et al 1998; CitationWang et al 2001; CitationWalker et al 2003).
Several studies have developed multivariate models to predict death following stroke. (CitationOxbury et al 1975; CitationAllen 1984; CitationHenon et al 1995; CitationBrittain et al 1998; CitationAdams et al 1999; CitationSzczudiik et al 2000; CitationWang et al 2001, Citation2003; CitationEngstad et al 2003, CitationWeir et al 2003, CitationBhatia et al 2004). CitationWang and colleagues (2001), for example, used regression to create a prognostic index by assigning points to the variables in a Cox model. The index included impaired consciousness (5 points), dysphagia (3 points), urinary incontinence (4 points), admission body temperature >36.5 °C (2 points), and hyperglycemia without a clinical history of diabetes (2 points). A score of 11 or more defined a high-risk group. The index achieved a sensitivity, specificity, and positive predictive value of 68%, 98%, and 75%, respectively, in the derivation sample and 57%, 97%, and 68%, respectively, in the validation sample. Another study (CitationCounsell et al 2002) showed that six simple predictors (age, living alone, independence on activities of daily living before stroke, the verbal component of the GCS, arm power, and ability to walk) could predict death rates just as accurately as the studies that used more and complex variables. In another study (CitationOxbury et al 1969) any combination of impaired consciousness, hemiplegia, and conjugate gaze palsy nearly doubled the odds of death during the first three weeks after stroke (positive LR = 1.8, 95% CI, 1.2–2.8), while the absence of any of these features decreased the odds by one third (negative LR = 0.36, 95% CI, 0.13–1.0).
Our approach differs in that we used a data-adaptive procedure that chooses among a wide variety of models to find the model that minimizes classification error. We also illustrate an approach using existing machine learning techniques that are freely available and can be used easily to compute new diagnostic scores applicable to local settings. Our approach concurs with an earlier suggestion (CitationCounsell et al 2002) that mortality from stroke could be accurately predicted by only a few easy-to-collect risk variables. Our model uses only four risk factors: GCS, fever, urine incontinence, and abnormal breathing. These variables can be easily captured by a healthcare worker, require no training and have proven reproducibility. Our method is simple, easy to use and can be applied in those clinical settings where physicians may not have access to sophisticated technology such as magnetic resonance imaging, used recently (CitationBaird et al 2001) to predict mortality after stroke. More prospective studies are needed to assess validity of our technique in diverse clinical settings.
References
- AdamsHPJDavisPHLeiraECBaseline NIH Stroke Scale score strongly predicts outcome after stroke: a report of the Trial of Org 10172 in Acute Stroke Treatment (TOAST)Neurology1999531263110408548
- AllenCMCPredicting the outcome of acute stoke: a prognostic scoreJ Neurology Neurosurgery19844747580
- BadamPSolaoVPaiMPoor accuracy of the Siriraj and Guy’s hospital stroke scores in distinguishing haemorrhagic from ischaemic stroke in a rural, tertiary care hospitalNatl Med J India20031681212715949
- BairdAEDambrosiaJJanketSA three-item scale for the early prediction of stroke recoveryLancet20013572095911445104
- BarerDHContinence after stroke: useful predictor or goal of therapy?Age Ageing198918183912782216
- BhatiaRSGargRKGaurSPPredictive value of routine hematological and biochemical parameters on 30-day fatality in acute strokeNeurol India200452220315269476
- BrittainKRPeetSMCastledenCMStroke and incontinenceStroke19982952489472900
- CastilloJDavalosAMarrugatJTiming for fever-related brain damage in acute ischemic strokeStroke1998292455609836750
- CounsellCDennisMMcDowallMPredicting outcome after acute and subacute stroke: Development and validation of new prognostic modelsStroke2002331041711935058
- DelongERDelongDMClarke-PearsonDLComparing the areas under two or more correlated receiver operating characteristic curves: a nonparametric approachBiometrics198844837453203132
- DorseyGGasasiraAFMachekanoRThe impact of age, temperature, and parasite density on treatment outcomes from antimalarial clinical trials in Kampala, UgandaAm J Trop Med Hyg200471531615569778
- EngstadTViitanenMArnesenEPredictors of death among long-term stroke survivorsStroke20033428768014615622
- FriedmanJHMultivariate adaptive regression splinesAnn Stat199119167
- HajatCHajatSSharmaPEffects of poststroke pyrexia on stroke outcome: a meta-analysis of studies in patientsStroke2000314101410657414
- HenonHGodefroyOLeysDEarly predictors of death and disability after acute cerebral ischemic eventStroke19952639287886712
- KammersgaardLPJorgensenHSRungbyJAAdmission body temperature predicts long-term mortality after acute stroke: The Copenhagen Stroke StudyStroke20023317596212105348
- KhanZHertanuJYangWCPredictive correlation of urodynamic dysfunction and brain injury after cerebrovascular accidentJ Urol19811268687253085
- KooperbergCBoseSStoneCJPolychotomous regressionJ Am Stat Assoc19979211727
- van der LaanMLDudoitSUnified cross-validation methodology for selection among estimators and a general cross-validated adaptive epsilon-net estimator: Finite sample oracle inequalities and examples. UC Berkeley Division of Biostatistics Working Paper Series. Working Paper 130 [online]2003 Accessed on 24 April, 2005. URL: http://www.bepress.com/ucbbiostat/paper130
- OxburyJMGreenhallRCDGraingerKMRPredicting the outcome after stroke: acute stage after cerebral infarctionBMJ197531251271139257
- ReithJJorgensenHSPedersenPMBody temperature in acute stroke: relation to stroke severity, infarct size, mortality, and outcomeLancet199634742258618482
- SinisiSEvan der LaanMLoss-based cross-validated deletion/substitution/addition algorithms in estimation. 1968 to 1994. UC Berkeley Division of Biostatistics Working Paper Series. Working Paper 143 [online]2004 Accessed on 24 April, 2005. URL: http://www.bepress.com/ucbbiostat/paper143
- SzczudiikASlowikATurajWEarly predictors of 30-day mortality in supratentorial ischemic stroke patients—first episodeMed Sci Monit20006758011208287
- TeasdaleGJennettBAssessment of coma and impaired consciousness. A practical scaleLancet197428144136544
- WadeDTHewerRLOutlook after an acute stroke: urinary incontinence and loss of consciousness compared in 532 patientsQ J Med19855660184059507
- WalkerRWRolfeMKellyPJMortality and recovery after stroke in the GambiaStroke2003341604912817107
- WangYLimLLHellerRFA prediction model of 1-year mortality for acute ischemic stroke patientsArch Phys Med Rehabil20038410061112881825
- WangYLimLLLeviCA prognostic index for 30-day mortality after strokeJ Clin Epidemiol2001547667311470384
- WeenJEAlexanderMPD’EspositoMIncontinence after stroke in a rehabilitation setting: outcome associations and predictive factorsNeurology199647659638797460
- WeirCJBradfordAPLeesKRThe prognostic value of the components of the Glasgow Coma Scale following acute strokeQJM200396677412509651
- WeirCJMurrayGDDykerAGIs hyperglycaemia an independent predictor of poor outcome after acute stroke? Results of a long-term follow up studyBMJ1997314130369158464
- [WHO] World Health OrganisationReport of the WHO Task Force on Stroke and other Cerebrovascular Disorders. Recommendations on stroke prevention, diagnosis, and therapyStroke1989201407102799873
- [WHO] World Health OrganisationWorld health report 2004: Changing history [online]2004GenevaWHO Accessed on April 24, 2007. URL: http://www.who.int/whr/2004/en/
Appendix A
POLYCLASS technique
For the addition steps, proposed new predictors are either (1) main effects not already in the model, (2) knots to existing main effects creating linear spline terms, or (3) any product of terms already in the model. For the deletion step, terms are removed hierarchically (eg, a main effect term is not removed before its corresponding spline term). Among all the models fit (during both the addition and deletion stages of model building), the final (best) model is chosen by using Akakie Information Criterion.
Appendix B
V-fold cross-validation method
The V-fold cross validation method is based on dividing the available data set into V sets. For each iteration, one chooses V-1 to comprise ‘the training set’ and the remaining data is called the ‘validation set’. Observations in the training set are used to compute, and therefore train, the estimators and the validation set is used to assess the performance of, and therefore validate, the estimators. This is done for each of the V possible validation sets (ie, each of the partitions is chosen once as a validation set). The performance is assessed by examining the average performance among the V validation sets. In this case, the data set was randomly divided into mutually exclusive and exhaustive fifths, with one-fifth being the validation set and four-fifths being the training set.
R-code for cross-validation and POLYCLASS
#1. Fit the Polyclass model:
library(polspline)
Y=#vector of outcome measure
X=#matrix of covariates
model= polyclass(Y, X)
#2. Split data in order to perform cross-validation:
#dataset:
D<-cbind(Y,X)
#indices of dataset:
n=1:length(Y)
#number of splits (5-fold in this case)
v<-5
Sn<-split(sample(1:length(n)),1:v)
#Splits data in 5 sections:
data1=D[as.matrix(Sn$”1”),]
data2=D[as.matrix(Sn$”2”),]
data3=D[as.matrix(Sn$”3”),]
data4=D[as.matrix(Sn$”4”),]
data5=D[as.matrix(Sn$“5”),]
split1=rbind(data1,data2, data3,data4)
split2=rbind(data5,data2, data3,data4)
split3=rbind(data1,data2, data3,data5)
split4=rbind(data1,data2, data4,data5)
split5=rbind(data1,data4, data3,data5)
#3. With 4/5 of data (place in model) pick the predicted probability which gives 90% sensitivity.
pp1=ppolyclass(split1[,1], split1[,-1], model)
pp2=ppolyclass(split2[,1], split2[,-1], model)
pp3=ppolyclass(split3[,1], split3[,-1], model)
pp4=ppolyclass(split4[,1], split4[,-1], model)
pp5=ppolyclass(split5[,1], split5[,-1], model)
#4. On 1/5 of data apply this cut-off (those above the score are predicted dead) and determine specificity and sensitivity:
test1=ppolyclass(data5[,1], data5[,-1], model)
test2=ppolyclass(data1[,1], data1[,-1], model)
test3=ppolyclass(data4[,1], data4[,-1], model)
test4=ppolyclass(data3[,1], data3[,-1], model)
test5=ppolyclass(data2[,1], data2[,-1], model)
#sensitivity: predicted dead/total dead
#specificity: predicted alive/total alive
#5. Repeat 3 and 4 five times and average of the sensitivity and specificity.