
Abstract
Aim: We performed an epigenome-wide association study within the Finnish Health in Teens cohort to identify differential DNA methylation and its association with BMI in adolescents. Materials & methods: Differential DNA methylation analyses of 3.1 million CpG sites were performed in saliva samples from 50 lean and 50 heavy adolescent girls by genome-wide targeted bisulfite-sequencing. Results: We identified 100 CpG sites with p-values < 0.000524, seven regions by ‘bumphunting’ and five CpG islands that differed significantly between the two groups. The ten CpG sites and regions most strongly associated with BMI substantially overlapped with obesity- and insulin-related genes, including MC2R, IGFBPL1, IP6K1 and IGF2BP1. Conclusion: Our findings suggest an association between the saliva methylome and BMI in adolescence.
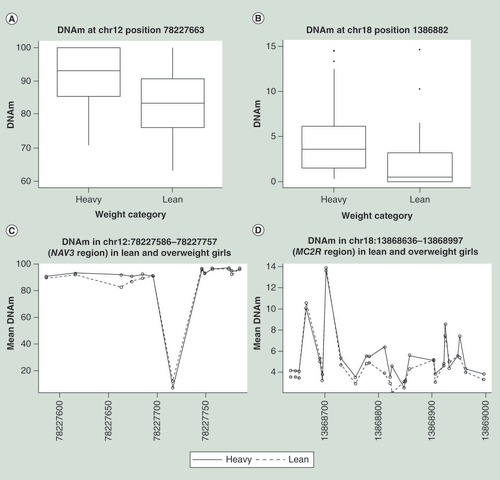
A boxplot of DNAm values for the lean and heavy group for: (A) position chr12:78227663 and (B) chr18:13868825. The targeted bisulfite sequencing also captures DNAm of the surrounding regions, here showing difference in mean DNAm in the lean group (dashed line) and heavy group (solid line) for: (C) chr12:78227586–78227757 and (D) chr18:13868730–13868997.
chr: Chromosome; DNAm: DNA methylation.
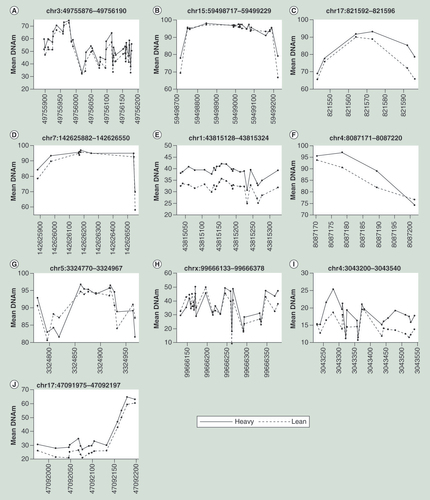
The difference in DNA methylation means are due to a consecutive difference in the same direction (C), (E), (F) and (J), differences with intermediate non-different CpGs in (D) and (I), DNA methylation difference in a few CpGs illustrated by (B), or alternating methylation levels illustrated by (A), (G) and (H).
chr: Chromosome; DNAm: DNA methylation.
First draft submitted: 21 April 2016; Accepted for publication: 17 August 2016; Published online: 20 October 2016
The worldwide prevalence of obesity has more than doubled since 1980, and in 2013 there were 2.1 billion overweight and obese people worldwide [Citation1]. Obesity rates have increased in most populations and in all age groups worldwide, and Finland is no exception [Citation2,Citation3]. Overweight and obese children are likely to stay obese into adulthood, and they tend to develop conditions such as Type 2 diabetes and cardiovascular diseases more frequently and at a younger age [Citation4]. Heritability of obesity has been estimated at about 50–70% [Citation5], and more than 90 genetic loci have been associated with obesity-related traits [Citation6]. However, these genetic loci account for only 2.7% of variation in BMI [Citation6]. This suggests that nongenetic factors, such as epigenetics, may be important determinants of obesity. DNA methylation (DNAm) varies by genotype, sex, age [Citation7,Citation8], cell type [Citation9] and environmental influences, such as smoking [Citation10]. DNAm is more plastic in utero and early life, potentially in response to environmental factors [Citation11,Citation12]. DNAm is cell type specific and can vary in samples of mixed cell types, such as saliva and blood samples [Citation13,Citation14]. However, most sites in the genome have a common methylation profile across cell types [Citation15–17].
Associations between epigenetic marks and adiposity have been shown in animal models [Citation18,Citation19] and humans [Citation14,Citation20], although it is not always clear if these epigenetic changes preceded obesity, or vice versa [Citation14]. Differential DNAm between lean and heavy individuals in metabolically important genes has also been identified in several different cell types [Citation14], and consistent findings have been shown for altered methylation in the IGF2/H19 imprinted region [Citation21,Citation22]. Genome-wide studies of peripheral blood cells have shown extensive, but small DNAm alterations in genes related to obesity, immune response, cell differentiation and regulation of transcription [Citation14,Citation23–24]. Tissue-specific differential DNAm has been found in leptin, pro-opiomeanocortin, glucose transporter-4 and insulin [Citation20,Citation25–26]. A large epigenome-wide association study (EWAS) on whole blood from European cohorts showed obesity-associated DNAm in HIF3A, which was replicated in other studies and tissues [Citation27,Citation28].
In adolescents, five gene regions showed differential DNAm between those that lost weight in an intervention study and those that did not [Citation29]. One study reported that DNAm at the RXRA locus at birth accounted for 26% of the variation in obesity at age 9 years [Citation30]. Moreover, DNAm in cord blood has been associated with body size and composition in childhood, although few CpG sites were significant after correcting for multiple testing [Citation31].
We performed an EWAS study of saliva DNAm in lean and heavy adolescent girls from the Finnish Health in Teens (Fin-HIT) cohort with the aim to identify differential DNAm and its association with body size. In addition, we aimed to show the usefulness of saliva as a source of DNA in EWAS studies.
Materials & methods
Participants
The Fin-HIT study included about 11,000 adolescents aged 9–12 years from schools throughout Finland. Within the framework of the Fin-HIT study, all adolescents received a measuring tape and written detailed instructions, including pictures, on how to measure and report height, weight and waist circumference at home with the assistance of an adult. We used this information to calculate BMI (weight in kg/height in m2). For the present analysis, we randomly selected 100 Fin-HIT cohort members aged 11 years: 50 from the tenth percentile of BMI (<15 kg/m2) and 50 from the 90th percentile of BMI (>21.9 kg/m2), referred to as lean and heavy girls, respectively (). The Fin-HIT participants reported their menarcheal status in the baseline electronic questionnaires, answered at school on tablets. Of the girls included in this study 60 had reached puberty (menarche = yes), 35 had not (menarche = no) and five did not answer the question (missing). The menarche status was included as a covariable in the model to adjust for weight differences due to puberty.
The Coordinating Ethics Committees of the Hospital Districts of Helsinki and Uusimaa approved the study, and informed consent was obtained from all adolescents and one of their legal guardians.
Procedures
All Fin-HIT cohort members provided saliva samples at baseline using the Oragene DNA Self-Collection Kit (OG-500, DNAgenotek). DNA was extracted from these samples using an automated protocol and chemagic DNA Saliva Kit (PerkinElmer, MA, USA). Three μg of DNA were used as an input in the targeted bisulfite sequencing (TBS) protocol. The SureSelectXT Human Methyl-Seq (Agilent, CA, USA) protocol, including DNA shearing, ligation of methylated adapters, capturing by hybridization, bisulfite conversion using Zymo Research’s EZ DNA Methylation-Gold Kit (Zymo, CA, USA), PCR amplification, indexing and sample pooling, was used according to the manufacturer’s recommendations. The predesigned target system captured a 84 Mb target and 3.7 million CpG sites. This includes CpG islands (20 Mb), cancer and tissue specific differential methylated regions (10 Mb), Gencode promoters (37 Mb), CpG island shores and shelves, DNase I hypersensitive sites, Refseq genes and Ensembl regulatory features (48 Mb) (Supplementary Information 1). The libraries were sequenced on a HiSeq (Illumina, CA, USA) with a 2 × 93-101 bp length and an average depth of 13 gigabases per sample. TBS produces DNAm values for all CpGs within its target, yielding a consecutive high-resolution view of the DNAm over entire regions.
Bioinformatics & statistical analyses
A custom script produced β-methylation values from raw sequencing data by combining open-source softwares. First, low-quality sequences and adaptors were removed using the Nesoni clip (version 0.115) [Citation32]. After removal of duplicate sequences, the bisulfite-converted sequence reads were then mapped to the human genome (hg19) using Bismark (version 0.10) [Citation33]. This software transformed the sequences into a C–T and G–A version and each of the transformed sequences were aligned to equivalently preconverted reference genome using four parallel instances of the short read aligner Bowtie2 (version 2.0.5) [Citation34]. The Bismark methylation extractor and custom formatting scripts were used to calculate β-methylation values for CpG sites. The first seven bases of each sequence were ignored, as a strong bias toward nonmethylation was caused by the insertion of unmethylated cytosines during end-repair in the sequencing library preparation. CpG sites at which more than 25% of the samples had less than 10× coverage were discarded. Cytosines in a non-CpG context and mitochondrial DNA is only methylated to a small extent, thus hypermethylation can be interpreted as less than optimal efficiency of the of bisulfite conversation reaction. Methylation of non-CpG cytosines and mitochondrial CpG were highly correlated among the samples (r2 = 0.99) (Supplementary Information 2). We used the average level of mitochondrial DNAm in the sample as a measurement of bisulfite conversation efficiency in the model.
Differential DNAm at CpG sites between lean and heavy girls was identified using a logistic regression model adjusting for puberty status and mitochondrial DNAm. The accumulation of the samples at the extreme end of the waist circumference or BMI range makes linear regression unsuitable. Thus, a case–control design with logistic regression was found most appropriate to identify differentially methylated CpG sites. After adjustment for multiple testing with a false discovery rate, no individual CpG site was significant.
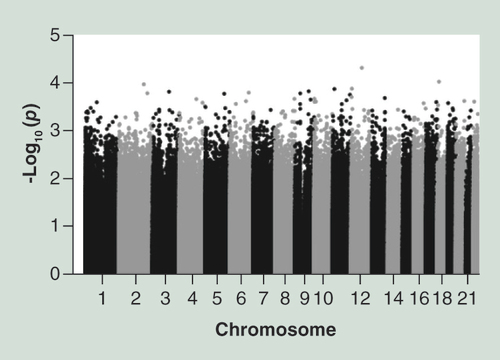
To identify differentially methylated regions by combining near-by CpG sites, we used two different approaches: Bumphunter and Fisher’s method [Citation35,Citation36]. Bumphunter was used to identify differentially methylated regions independent of gene annotation, as implemented in R by Aryee et al. [Citation37]. We used the same covariates as in the logistic regression model described above, and set a cut-off for the first screening step at the top 0.1% of signals. The maximum allowed distance between CpG sites within the same regions was set to 1500 bp, and the number of bootstraps to 500. Since this approach is independent of gene annotation, and can give results that are difficult to interpret in a biological setting, we also tested each CpG island for any enrichment of p-values. This was done by aggregating the p-values from all CpG sites within each island, and applying an extension of Fisher’s method [Citation36], to summarize the individual CpG-wise p-values in to one p-value for each CpG Island. The correlation between the p-values was assumed to be the same as the correlation between the methylation values, estimated using the Spearman’s rank correlation coefficient. The qq-man application in R was used to produce Manhattan plots and QQ-plots [Citation38].
Pathways enriched for differential DNAm were evaluated using the improved gene set enrichment analysis for genome-wide association studies (i-GSEA4GWAS v1.1) [Citation39]. Predefined biological pathways and processes, including Biocarta, KEGG, Reactome pathways and gene ontology gene sets were assessed for enrichment. CpG sites up to 10 kb upstream and downstream of a given gene were mapped to the gene and the maximum -log (p-value) of all the CpG sites mapped to that gene was used to represent the gene. i-GSEA4GWAS uses site label permutation. We report the p-value and false discovery rate for the statistically significant gene sets < 0.001 and the associations for each CpG site and island for the outcome variable BMI.
Results
The difference in mean BMI between lean and heavy girls was 9.7 kg/m2, and the difference in waist circumference was 21.4 cm. Menarche was reported by 64% of lean girls and 78% of heavy girls (). We sequenced 3.1 million CpG sites with the minimum 10× coverage, and 1.2 million of these sites had more than 50× coverage. The mean DNAm on autosomal CpG sites for all samples was 49.2%, and we could not identify a statistically significant difference between the global autosomal DNAm levels between the groups. As expected, most mitochondrial CpGs were hypomethylated.
The genome-wide differential DNAm analyses between lean and heavy girls, adjusted for menarcheal status and bisulfite conversion, resulted in a top list of 100 CpG sites with p-values below 5.28 × 10⁻⁴ (), but none that were genome-wide significant. More than 300 CpG had a p-value lower than 10-3. The two differential CpG sites (chr12: 78227663; p-value 4.90 × 10⁻⁵ and chr18: 13868825; p-value 9.53 × 10-05) most strongly associated with BMI were located within the NAV3 intronic region and within the CpG island upstream of the obesity-related MC2R gene (). For both sites a significant hypermethylation in heavy relative to lean girls was observed (A & B). The difference in DNAm varied across the groups in at least three closely related sites between 13868800 and 13868800 on chromosome 18 (MC2R region), with position 13868825 (cg27031837) showing the strongest association (D). No notable difference in DNAm was observed surrounding chromosome 12 position 78227663 (C). The top ten list of strongest associated CpG sites included four sites that were located in or nearby obesity-related genes (MC2R, TMOD1, SLC35D3 and IGFBPL1), and two sites (MICAL2 and NRP2) were located in or nearby genes of interest in obesity research. Four CpG sites overlapped with targets on the 450K array (cg27031837, cg24371251, cg02203665 and cg01154445).
Significant differences in DNAm were observed in genomic regions and CpG islands associated with BMI. Seven regions, independent of annotation, were identified with the software bumphunter to have a significant aggregation of closely located differential DNAm sites (). The region with the strongest association with BMI was located in a gene-dense region upstream of the diabetes-related IP6K1 gene. ‘Bumphunting’ also identified a region including 18 CpG sites within the CpG island upstream of the MPL gene to be significantly different methylated in lean and heavy girls. The annotation specific analyses using the extended Fishers method identified five CpG islands to have genome-wide significant differential DNAm associated with BMI (). Notably, the CpG islands upstream of the IGF2BP1 gene was among the top five hits (). The TBS allowed a detailed view of correlation between differential DNAm within genomic locations. A consecutive mean difference in DNAm throughout the regions was observed in proximity of NXN, MPL, ABLIM2 and IGF2BD1 (C, E, F & J, respectively). A few colocalized sites were driving the DNAm difference over the regions close to MYO1E/LDHAL6B and TRPV5 (B & D, respectively). No clear correlation in differential DNAm could be observed in proximity of AMIGO03, CpG island 24 (6512) on chromosome 5, PCDH19 and GRK4 (A, G, H & I, respectively).
Gene set enrichment analysis identified pathways enriched for genes in a 10-kb range of CpG sites with differential DNAm. Pathways such as metabolism of androgen and estrogen, starch and sucrose, and porphyrin and chlorophyll were enriched with nominally significant CpG sites (). All these gene sets contained the genes UGT1A1–10.
Discussion
We identified genomic sites, regions and pathways that differed in saliva DNAm between 11-year-old lean and heavy Finnish girls by investigating 3.1 million CpG sites. Many of the sites and regions were colocated with known obesity-related genes, predominantly in the insulin-melanocotin pathway. Considering the limited sample size of 50 girls in each group, we identified a number of noteworthy CpG sites and regions. Colocation of the ten CpG sites most strongly associated with BMI and obesity-related gene regions [Citation40–45], as well as the fact that our results replicate previous findings [Citation31], strengthening the probability that the observed associations were true associations. We observed differential DNAm at chr12:78227663 nearby the gene NAV3, which, to our knowledge, has not been previously associated with body size. It is plausible that differential DNAm at chr12:78227663 may affect the expression of SYT1, which is located 500 kb downstream of NAV3. SYT1 is a regulator of exocytosis and endocytosis of insulin-containing vesicles [Citation46] and is associated with eating behavior in pigs [Citation47].
The MC2R CpG island harbored the second strongest signal from a CpG site. The melanocortin system plays an important role in the pathogenesis of obesity and in metabolic syndrome [Citation40]. Mutations in the MC4R gene are the most common cause of monogenic obesity in humans, and play a role in regulating energy expenditure and energy intake through the control of satiety. MC3R has a more subtle role in energy homeostasis [Citation48], whereas MC2R is involved in the regulation of steroidogenesis and has recently been indicated to have a direct effect on adipose insulin sensitivity, endocrine function and thermogenesis [Citation40]. Our findings support a role for MC2R in key adipose functions and further suggest that all melanocortin receptors play crucial roles in the regulation of energy balance [Citation48]. Our data show that DNAm differs in at least three CpG sites within the CpG island upstream of MC2R, thus these entire regions should be investigated further. Most of the genes with the strongest associations (MICAL2, TMOD1, SLC35D3, NRP2, IGFBPL1) have been linked to obesity either directly or as a receptor of an obesity-related gene. IGF has consistently been identified as a differentially methylated region associated with BMI regardless of cell type [Citation21,Citation22], which we have now replicated in saliva.
TBS enables DNAm association analyses of single CpG sites, but also enables assessment of aggregated or correlated methylation within genes and regulatory regions, or regional assessment independent of annotation. With increased statistical power from aggregation of DNAm independently of annotation using ‘Bumphunting’ the strongest association was found upstream of the insulin-stimulated gene IP6K1 [Citation49]. We replicated the findings of Relton et al., which showed associations between core blood MPL differential DNAm and childhood obesity [Citation31], using ‘Bumphunting’. Since our results based on saliva DNA replicated associations identified in core-blood DNAm [Citation31], we might speculate that the differential DNAm found in saliva cells may already be present in utero. A detailed look at this region (E) showed that lean adolescents had lower DNAm throughout a 200 bp region. A recent study indicated that a variant in the GRK4 gene and high intake of sodium increase the risk of obesity [Citation50]. Our CpG island association results, also benefitting from increased statistical power due to aggregation of methylation at CpG islands, indicate that DNAm in the upstream CpG island GRK4 (I) might also be of interest. The CpG island nearby IGF2BP1 also demonstrated an association between the insulin pathway and DNAm in saliva. This finding replicates previous associations between IGF2BP1 DNAm and body mass [Citation51], as well as a recent study on monozygotic twins, which indicated that the differences in DNAm are due to nonshared environmental factors that influence body weight [Citation52].
Three pathways were enriched for differential DNAm, and previous studies have also shown obesity-related epigenetic changes in some of these pathways [Citation53,Citation54]. However, the enrichment in all three pathways was driven mainly by DNAm differences in the genes UGT1A1–10; thus further studies on these genes are warranted.
Several studies have identified associations between BMI and DNAm in the H19/IGF2 region on chromosome 11 [Citation21,Citation22] and more recently in the ABCG1 gene region on chromosome 21 [Citation27,Citation55]. None of these gene regions had signals among our top 100 findings, although two signals downstream of H19 (chromosome 11, 2020577 and 2020553) were nominal significant (both with p-value = 0.002). We also identified a signal downstream of the ABCG1 CpG island (p-value = 0.003). Lack of power and difference in tissue type (blood vs saliva) may explain why we did not replicate these findings.
All individuals in this study were girls born in the same year, removing potential confounding by age [Citation8] and sex. 11-year-olds are also less likely to have a history of potential DNAm confounders such as dieting, medication use and smoking than older girls and adults [Citation56,Citation57]. Menarche was used as an indicator of puberty onset and likely effects DNAm levels [Citation58,Citation59]; hence, menarche status was included in the analytical models. This adjustment might conceal associations with regions such as the CYP19A1 promoter CpG island, which has previously been found to be associated with puberty [Citation58]. The study design used the extremes of the BMI curve. This design was chosen to compensate for the relatively small sample size but may mask similarities in DNAm among lean and heavy girls that differ in normal-weight adolescents. Although BMI is only an indicator of body fat in adolescents [Citation60], it is likely that the substantial difference in BMI between the tenth and 90th percentiles indicates a clear distinction in body size between these groups.
Gene expression in saliva and DNAm may be influenced by factors such as diet. However, evaluating the potential role of reverse causation is an issue outside the scope of this study. Varying cell-type composition is a challenge in analyses of the saliva methylome, as it is in analyses of the blood methylome. There is a good reference cell-type composition for the blood methylome. A similar good reference does not exist for the saliva methylome. This, in combination with a lack of knowledge on the CpG sites outside the 450K array target [Citation61], made a reference-free cell-type adjustment approach [Citation62] impossible. A correlation between BMI in adolescents and cell-type composition in saliva is unlikely, thus we believe the results without this adjustment are valid.
Most recent EWAS studies were based on the Infinium human Methylation 450K or the older 27K array. However, our study used a TBS approach, which covered 84 Mb of the genome and enabled the detection of differential DNAm with high genomic resolution. While the 450K covers about approximately 1.7%, the TBS covered about 11.1% of the CpG sites in the human genome. Considering that most of the identified regions of interest presented here are not covered by 450K, this difference in resolution is important. It will be of great clinical interest to confirm the saliva DNAm associations to body size and the directionality of these findings. Further investigations of the epigenetic mechanisms of body mass regulation for each of the associations are warranted.
Conclusion & future perspective
In summary, the saliva methylome EWAS of 50 lean and 50 heavy Finnish girls identified differentially methylated CpG sites. The two strongest signals were located near NAV3 and MC2R. The substantial overlap with obesity- and insulin-related genes, including MC2R, IGFBPL1, IP6K1 and IGF2BP1, and the replication of MPL, indicate true associations between the saliva methylome and BMI. Saliva is a readily available source of DNA that can shed light on the etiology of DNAm and obesity. In the future, saliva DNAm could be used as a biomarker to identify persons at risk of developing obesity.
Table 1. Overview of the characteristics of the 100 11-year-old girls from the Finnish Health in Teens study and corresponding saliva samples.
Table 2. The ten DNA methylation sites most strongly associated with BMI.
Table 3. The differential DNA methylation regions most strongly associated with BMI identified by Bumphunter or CpG island analyses.
Table 4. Gene set enrichment analyses of CpG sites and islands associated to BMI and waist circumference.
An epigenome-wide association study between lean and heavy 11-year-old girls identified differential DNA methylation in 100 CpG sites with p-values below 5.28 × 10⁻⁴.
The two differential DNA methylation sites with the strongest association with BMI were located within the NAV3 and MC2R genes.
Our finding support a role for MC2R in key adipose functions.
‘Bumphunting’ identified seven associated regions; the region with the strongest association with BMI was located close to the diabetes-related IP6K1 gene.
Associations between the MPL gene region and childhood obesity, previously shown in blood, were replicated in saliva.
The CpG islands upstream of IGF2BP1 were among those that were most significantly associated with body size.
Gene set enrichment analysis identified diet-related pathways associated with body size.
Associations between body size and methylation of CpG sites close to obesity- and insulin-related genes indicate an effect of the saliva methylome on BMI or vice versa.
Ethical conduct of research
The Coordinating Ethics Committees of the Hospital Districts of Helsinki and Uusimaa approved the study, and informed consent was obtained from all adolescents and one of their legal guardians.
Supplemental Document
Download PDF (8.5 MB)Supplemental Document
Download PDF (9.9 KB)Acknowledgements
The authors would like to thank the participants of the Fin-HIT study and the steering committee: S Simola, S Von Kreamer, J Skand, C Sarkkola and S Raju, for coordinating samples and data management; and J Erikson, E Roos and A-E Lehesjoki for supporting the study. The authors further thank the Institute for Molecular Medicine Finland (FIMM) biobank for sample handling and DNA extraction, and the FIMM technology center for sequencing and providing computational resources.
Supplementary data
To view the supplementary data that accompany this paper please visit the journal website at: www.tandfonline.com/doi/full/10.2217/epi-2016-0045
Financial & competing interests disclosure
This work was supported by the Folkhälsan Research Foundation: The Academy of Finland (grant number 250704); The Life and Health Medical Fund (grant number 1-23-28); The Swedish Cultural Foundation in Finland (grant number 15/0897); The Signe and Ane Gyllenberg Foundation (grant number 37-1977-43); and The Yrjö Jahnsson Foundation (grant number 11486). The authors have no other relevant affiliations or financial involvement with any organization or entity with a financial interest in or financial conflict with the subject matter or materials discussed in the manuscript apart from those disclosed.
Writing assistance was provided by Trudy Perdrix-Thoma at Professional Standards Editing, Inc. and was funded by the above-mentioned grants.
Additional information
Funding
References
- Ng M , FlemingT , RobinsonMet al. Global, regional, and national prevalence of overweight and obesity in children and adults during 1980–2013: a systematic analysis for the Global Burden of Disease Study 2013 . Lancet6736 , 1 – 16 ( 2014 ).
- Vuorela N , SahaM-T , SaloM . Prevalence of overweight and obesity in 5- and 12-year-old Finnish children in 1986 and 2006 . Acta Paediatr.98 , 507 – 512 ( 2009 ).
- Vuorela N , SahaMT , SaloMK . Change in prevalence of overweight and obesity in Finnish children – comparison between 1974 and 2001 . Acta Paediatr.100 , 109 – 115 ( 2011 ).
- Park MH , SovioU , VinerRM , HardyRJ , KinraS . Overweight in childhood, adolescence and adulthood and cardiovascular risk in later life: pooled analysis of three British birth cohorts . PLoS ONE8 , 3 – 8 ( 2013 ).
- Hebebrand J , HinneyA . Environmental and genetic risk factors in obesity . Child Adolesc. Psychiatr. Clin. N. Am.18 , 83 – 94 ( 2009 ).
- Locke AE , KahaliB , BerndtSIet al. Genetic studies of body mass index yield new insights for obesity biology . Nature518 , 197 – 206 ( 2015 ).
- Boks MP , DerksEM , WeisenbergerDJ , StrengmanE , JansonE , IrisE . The relationship of DNA methylation with age, gender and genotype in twins and healthy controls . PLoS ONE4 , 21 – 23 ( 2009 ).
- Horvath S . DNA methylation age of human tissues and cell types . Genome Biol.14 , R115 ( 2013 ).
- Meissner A , MikkelsenTS , GuHet al. Genome-scale DNA methylation maps of pluripotent and differentiated cells . Nature454 , 766 – 770 ( 2010 ).
- Breitling LP , YangR , KornB , BurwinkelB , BrennerH . Tobacco-smoking-related differential DNA methylation: 27K discovery and replication . Am. J. Hum. Genet.88 , 450 – 457 ( 2011 ).
- Wang D , LiuX , ZhouYet al. Individual variation and longitudinal pattern of genome-wide DNA methylation from birth to the first two years of life . Epigenetics7 , 594 – 605 ( 2012 ).
- Alisch RS , BarwickBG , ChopraPet al. Age-associated DNA methylation in pediatric populations age-associated DNA methylation in pediatric populations . Genome Res.22 , 623 – 632 ( 2012 ).
- Jacoby M , GohrbandtS , ClausseV , BronsNH , MullerCP . Interindividual variability and co-regulation of DNA methylation differ among blood cell populations . Epigenetics7 , 1421 – 1434 ( 2012 ).
- van Dijk SJ , MolloyPL , VarinliH , MorrisonJL , MuhlhauslerBS . Epigenetics and human obesity . Int. J. Obes. (Lond.)39 , 1 – 13 ( 2014 ).
- Ziller MJ , GuH , MüllerFet al. Charting a dynamic DNA methylation landscape of the human genome . Nature500 , 477 – 481 ( 2013 ).
- Adalsteinsson BT , GudnasonH , AspelundTet al. Heterogeneity in white blood cells has potential to confound DNA methylation measurements . PLoS ONE7 , 1 – 9 ( 2012 ).
- Talens RP , BoomsmaDI , TobiEWet al. Variation, patterns, and temporal stability of DNA methylation: considerations for epigenetic epidemiology . FASEB J.24 , 3135 – 3144 ( 2010 ).
- Dolinoy DC . The agouti mouse model: an epigenetic biosensor for nutritional and environmental alterations on the fetal epigenome . Mutr. Rev.29 , 997 – 1003 ( 2008 ).
- Öst A , LempradlA , CasasEet al. Paternal diet defines offspring chromatin state and intergenerational obesity . Cell159 , 1352 – 1364 ( 2014 ).
- Lavebratt C , AlmgrenM , EkströmTJ . Epigenetic regulation in obesity . Int. J. Obes.36 , 757 – 765 ( 2012 ).
- Drake AJ , McPhersonRC , GodfreyKMet al. An unbalanced maternal diet in pregnancy associates with offspring epigenetic changes in genes controlling glucocorticoid action and foetal growth . Clin. Endocrinol. (Oxf.)77 , 808 – 815 ( 2012 ).
- Huang R-C , GalatiJC , BurrowsSet al. DNA methylation of the IGF2/H19 imprinting control region and adiposity distribution in young adults . Clin. Epigenetics4 , 21 ( 2012 ).
- Almén MS , NilssonEK , JacobssonJAet al. Genome-wide analysis reveals DNA methylation markers that vary with both age and obesity . Gene548 , 61 – 67 ( 2014 ).
- Xu X , SuS , BarnesVAet al. A genome-wide methylation study on obesity: differential variability and differential methylation . Epigenetics8 , 522 – 533 ( 2013 ).
- Plagemann A , HarderT , BrunnMet al. Hypothalamic proopiomelanocortin promoter methylation becomes altered by early overfeeding: an epigenetic model of obesity and the metabolic syndrome . J. Physiol.587 , 4963 – 4976 ( 2009 ).
- Kuroda A , RauchTA , TodorovIet al. Insulin gene expression is regulated by DNA methylation . PLoS ONE4 , e6953 ( 2009 ).
- Demerath EW , GuanW , GroveMLet al. Epigenome-wide association study (EWAS) of BMI, BMI change, and waist circumference in African American adults identifies multiple replicated loci . Hum. Mol. Genet.24 , 4464 – 4479 ( 2015 ).
- Dick KJ , NelsonCP , TsaprouniLet al. DNA methylation and body-mass index: a genome-wide analysis . Lancet6736 , 1 – 9 ( 2014 ).
- Moleres A , CampiónJ , MilagroFIet al. Differential DNA methylation patterns between high and low responders to a weight loss intervention in overweight or obese adolescents: the EVASYON study . FASEB J.27 , 2504 – 2512 ( 2013 ).
- Godfrey KM , SheppardA , GluckmanPDet al. Epigenetic gene promoter methylation at birth is associated with child’s later adiposity . Diabetes60 , 1528 – 1534 ( 2011 ).
- Relton CL , GroomA , St PourcainBet al. DNA methylation patterns in cord blood DNA and body size in childhood . PLoS ONE7 , e31821 ( 2012 ).
- GitHub: Victorian-Bioinformatics-Consortium . https://github.com/Victorian-Bioinformatics-Consortium/nesoni .
- Krueger F , AndrewsSR . Bismark: a flexible aligner and methylation caller for Bisulfite-Seq applications . Bioinformatics27 , 1571 – 1572 ( 2011 ).
- Langmead B , SalzbergS . Fast gapped-read alignment with Bowtie 2 . Nat. Methods9 , 357 – 359 ( 2012 ).
- Jaffe AE , MurakamiP , LeeHet al. Bump hunting to identify differentially methylated regions in epigenetic epidemiology studies . Int. J. Epidemiol.41 , 200 – 209 ( 2012 ).
- Hou C-D . A simple approximation for the distribution of the weighted combination of non-independent or independent probabilities . Stat. Probab. Lett.73 , 179 – 187 ( 2005 ).
- Aryee MJ , JaffeAE , Corrada-BravoHet al. Minfi: a flexible and comprehensive bioconductor package for the analysis of Infinium DNA methylation microarrays . Bioinformatics30 , 1363 – 1369 ( 2014 ).
- Turner SD . qqman: an R package for visualizing GWAS results using Q-Q and manhattan plots . bioRxiv doi:10.1101/005165 ( 2014 ) ( Epub ahead of print ).
- Zhang K , CuiS , ChangS , ZhangL , WangJ . i-GSEA4GWAS: a web server for identification of pathways/gene sets associated with traits by applying an improved gene set enrichment analysis to genome-wide association study . Nucleic Acids Res.38 , 90 – 95 ( 2010 ).
- Iwen KAH , SenyamanO , SchwartzAet al. Melanocortin crosstalk with adipose functions: ACTH directly induces insulin resistance, promotes a pro-inflammatory adipokine profile and stimulates UCP-1 in adipocytes . J. Endocrinol.196 , 465 – 472 ( 2004 ).
- Li W , JiaoH , WangKet al. A genome wide association study of plasma uric acid levels in obese cases and never-overweight controls . Obesity21 , 490 – 494 ( 2013 ).
- Turcot V , GroomA , McConnellJCet al. Bioinformatic selection of putative epigenetically regulated loci associated with obesity using gene expression data . Gene499 , 99 – 107 ( 2012 ).
- Zhang Z , HaoC , LiCet al. Mutation of SLC35D3 causes metabolic syndrome by impairing dopamine signaling in striatal D1 neurons . PLoS Genet.10 , e1004124 ( 2014 ).
- Schmidt AM , MooreKJ . The semaphorin 3E/PlexinD1 axis regulates macrophage inflammation in obesity . Cell Metab.18 , 461 – 462 ( 2013 ).
- Hoeflich A , RussoVC . Physiology and pathophysiology of IGFBP-1 and IGFBP-2 – consensus and dissent on metabolic control and malignant potential . Best Pract. Res. Clin. Endocrinol. Metab.29 , 685 – 700 ( 2015 ).
- Gauthier BR , WollheimCB . Synaptotagmins bind calcium to release insulin . Am. J. Physiol. Endocrinol. Metab.295 , E1279 – E1286 ( 2008 ).
- Do DN , StratheAB , OstersenT , JensenJ , MarkT . Genome-wide association study reveals genetic architecture of eating behavior in pigs and its implications for humans obesity by comparative mapping . PLoS ONE8 , e71509 ( 2013 ).
- Girardet C , ButlerAA . Neural melanocortin receptors in obesity and related metabolic disorders . Biochim. Biophys. Acta1842 , 482 – 494 ( 2014 ).
- Chakraborty A , KoldobskiyMA , BelloNTet al. Inositol pyrophosphates inhibit akt signaling, thereby regulating insulin sensitivity and weight gain . Cell143 , 897 – 910 ( 2010 ).
- Lee M , KimMK , KimS , ParkH , ParkC , ParkHK . Gender-based differences on the association between salt-sensitive genes and obesity in Korean children aged between 8 and 9 years . PLoS ONE10 , e0120111 ( 2015 ).
- Hoyo C , FortnerK , MurthaAPet al. Association of cord blood methylation fractions at imprinted and birth weight . Cancer Causes Control2 , 635 – 645 ( 2012 ).
- Cordova-Palomera A , AlemanyS , FatjoM , NenadicI , FanL , GonzaA . Birth weight, working memory and epigenetic signatures in IGF2 and related genes: a MZ twin study . PLoS ONE9 , e103639 ( 2014 ).
- Martínez JA , MilagroFI , ClaycombeKJ , SchalinskeKL . Epigenetics in adipose tissue, obesity, weight loss, and diabetes . Adv. Nutr.5 , 71 – 81 ( 2014 ).
- Movérare-Skrtic S , MellströmD , VandenputL , EhrichM , OhlssonC . Peripheral blood leukocyte distribution and body mass index are associated with the methylation pattern of the androgen receptor promoter . Endocrine35 , 204 – 210 ( 2009 ).
- Hidalgo B , IrvinMR , ShaJet al. Epigenome-wide association study of fasting measures of glucose, insulin, and HOMA-IR in the genetics of lipid lowering drugs and diet network study . Diabetes63 , 801 – 807 ( 2014 ).
- Breton C V , SiegmundKD , JoubertBRet al. Prenatal tobacco smoke exposure is associated with childhood DNA CpG methylation . PLoS ONE9 , e99716 ( 2009 ).
- Besingi W , JohanssonÅ . Smoke-related DNA methylation changes in the etiology of human disease . Hum. Mol. Genet.23 , 2290 – 2297 ( 2014 ).
- Stueve TR , WolffMS , PajakA , TeitelbaumSL , ChenJ . CYP19A1 promoter methylation in saliva associated with milestones of pubertal timing in urban girls . BMC Pediatr.14 , 78 ( 2009 ).
- Lomniczi A , LocheA , CastellanoJMet al. Epigenetic control of female puberty . Nat. Neurosci.16 , 281 – 289 ( 2013 ).
- Freedman DS , WangJ , MaynardLMet al. Relation of BMI to fat and fat-free mass among children and adolescents . Int. J. Obes.29 , 1 – 8 ( 2004 ).
- Houseman EA , AccomandoWP , KoestlerDCet al. DNA methylation arrays as surrogate measures of cell mixture distribution . BMC Bioinformatics13 , 86 ( 2012 ).
- Zou J , LippertC , HeckermanD , AryeeM , ListgartenJ . Epigenome-wide association studies without the need for cell-type composition . Nat. Methods11 , 309 – 311 ( 2014 ).