
Abstract
Aim: To analyze the m6A methylome of osteosarcoma stem cells (OSCs). Materials & methods: Chemoresistant OSCs were enriched by doxorubicin treatment. Expression of m6A-related enzymes was detected by quantitative real-time-PCR and western blot. MeRIP-seq and RNA-seq were performed to identify differences in m6A methylation and gene expression. Data analysis was conducted to explore the modified genes and their clinical significance. Results: Three m6A-related enzymes were altered in OSCs. Differentially methylated genes were enriched in some pathways regulating pluripotency of stem cells. The expression of several candidate genes were found consistent with that in GSE33458 dataset, and associated with poor prognosis in osteosarcoma patients. Conclusion: m6A may play a role in the emergence and maintaining of OSCs and affect the prognosis.
Osteosarcoma (OS) is the most common malignant bone tumor and occurs during the adolescent growth spurt [Citation1]. It is the second leading cause of cancer-related death in children and young adults [Citation2]. Currently, the primary management strategy for OS is incorporated neoadjuvant chemotherapy and surgical removal of the primary lesion followed by adjuvant chemotherapy [Citation3]. Nevertheless, the overall 5-year survival rate is only about 20%, due to the metastasis and relapse [Citation4]. Emerging evidences have indicated that osteosarcoma stem cells (OSCs) represent a subpopulation of cells attributed to critical roles in this malignant neoplasm, including tumorigenesis, therapy resistance, relapse and metastasis before or after surgery [Citation5,Citation6]. Unfortunately, the cytotoxic drugs having been used to kill OS in clinical treatment, such as doxorubicin (DXR), cisplatinum (DDP) and methotrexate (MTX), have been found to induce stemness in OS cells by activating Wnt/β-catenin or Notch signaling [Citation7–9]. However, the mechanisms behind the OSCs are still mysterious.
N 6.methyladenosine (m6A), as the most prominent modification in poly-adenylated mRNAs and long-noncoding RNAs in higher eukaryotes, was already identified in the 1970s [Citation10]. Recently, it has been rediscovered to play a significant role in multiple aspects of RNA metabolism, including RNA localization, transport, splicing, stability and translation [Citation11]. Remarkably, m6A modification of mRNA was found to have a crucial effect in regulating pluripotency in murine stem cell [Citation12,Citation13]. Accordingly, the investigation about the function of m6A modification in the context of cancer stem cells (CSCs) have logically entered the research spotlight. METTL3 and METTL14, as the key component of the methyltransferase complex that catalyze m6A modification, have been reported to inhibit myeloid differentiation of normal hematopoietic and leukemia cells, as well as promote leukemogenesis [Citation14–16]. FTO as well as ALKBH5, acting as demethylases to remove m6A modification, have been found to induce glioblastoma stem cell growth, self-renewal and tumor progression [Citation17,Citation18]. Given the noteworthy functions of m6A modification in regulating the fate of the CSCs, it is legitimately to propose that m6A modification might also be involved with OSCs. To our knowledge, there is no report about the association between m6A modification and OSCs.
The detection of m6A sites in transcriptome is required for exploring the biological role of RNA m6A modification. Methylated RNA immunoprecipitation combined with next-generation sequencing (MeRIP-seq) was developed in 2012 by Dominissini and Meyer et al. to localize transcriptome-wide m6A sites [Citation19,Citation20]. Meyer et al. found that m6A sites are mainly enriched around stop codons and in 3′-untranslated regions (3′-UTRs), and discovered the association between microRNA binding sites and m6A deposition within 3′-UTRs, suggesting the crucial role that m6A modification plays in post-transcriptional regulation of gene expression [Citation19]. Luo et al. uncovered a positive correlation between m6A residues and mRNA abundance in Arabidopsis thaliana by using MeRIP-seq [Citation21]. These creative researches demonstrate that constructing transcriptome-wide m6A methylome mapped/depicted by MeRIP-seq is favorable for further revealing the potential biological functions of m6A modification in a new research area.
To further investigate the role of m6A in OSCs, we initially enriched a multidrug-resistant cell population from OS cell line MG63 by gradually adding DXR with an increasing concentration, and named it as MG63/DXR, which was further proved to have the characteristics of OSCs. Furthermore, MeRIP-seq was used to establish the first known transcriptome-wide m6A methylome profiles of OSCs. RNA-seq was performed to detect the differentially expressed genes (DEGs). Additionally, two publicly available datasets were used to testify the candidate genes and explore their clinical significance. From this study, it could be speculated that m6A methylation may be a breakthrough point to improve treatment of OS.
Materials & methods
Cell line & cell culture
Human OS cell line MG63, purchased from the Chinese Academy of Sciences (Shanghai, China), was cultured in Dulbecco’s modified Eagle’s medium (DMEM) (Hyclone, Tauranga, New Zealand) supplemented with 10% fetal bovine serum (FBS) (Gibco, NY, USA), as well as penicillin (100 U/ml) and streptomycin (100 μg/ml) (Invitrogen, CA, USA) at 37°C in a humidified 5% CO2 atmosphere.
Enrichment of multidrug-resistant cell subpopulation
Multidrug-resistant cell subpopulation was enriched by multiple steps of selection in the presence of increasing doses of DXR, according to the method described previously [Citation22]. Briefly, MG63 growing exponentially in 100-mm dish were treated with 2.5 ng/ml DXR to remove the drug-sensitive cells until its growth rate was similar to the untreated counterpart. At that time, the concentration of DXR was increased stepwise from 2.5 to 1000 ng/ml: 2.5, 5, 10, 20, 40, 80, 100, 200, 400, 800 and 1000 ng/ml. Clones selected at 1000 ng/ml of DXR were purified and stably subcultured in the culture medium described above, named as MG63/DXR.
Cell Counting Kit-8 assay
For proliferation assay, cells were seeded in 96-well microplates at a density of 2000 cells/well. Every 24 h until day fifth, the cell viability were evaluated quantitatively by using cell Counting Kit-8 assay (Cell Counting Kit-8 [CCK-8], Dojindo, Japan). Briefly, the culture medium was removed, and the cells were washed with phosphate-buffer saline (PBS) before 100 μl culture medium with 10% CCK-8 solution were added to each well, followed by incubation at 37°C for 2.5 h. The optical density (OD) at 450 nm was detected by using a microplate reader (BIOTEK, Vermont, USA). Finally, the OD value of resistant group (MG63/DXR) were divided by that of parental group (MG63) to obtain the ratio of viable cells, as published previously [Citation23].
For drug sensitivity assay, 5000 cells/well were treated with DXR with a concentration gradient, for 48 h, followed by CCK-8 assay as described above. The half inhibitory concentration (IC50) of each drug were calculated. Each experiment was performed in triplicate and repeated three times. The cytotoxicity of DDP, MTX and ifosfamide (IFO) were measured according to the same procedure.
Sphere formation assay
Cells seeded in 6-well ultra-low attachment plates (Corning, NY, USA) at a density of 2000 cells per well, were cultured in DMEM/F12 medium mixed with 2% B27 NeuroMix (Absin, Shanghai, China), human 10 ng/ml EGF (Peprotech, CO, USA) and 10 ng/ml human 10 ng/ml bFGF (Peprotech). After 14 days, an inverted phase contrast microscope (Nikon, Tokyo, Japan) was used to count the sarcospheres.
Flow cytometry analysis
For analysis of CD133, CD117 and Stro-1 expression, cells were detached using the 0.04% Trypsin-EDTA (Gibco, NY, USA) in PBS, counted and washed in 0.1% bull serum albumin (BSA) in PBS. 5 × 10⁵ cells were incubated with fluorescent-labelled monoclonal antibodies or isotype controls, for 30 min at 4°C in dark. After washing, the labelled cells were analyzed by using FC 500 Flow Cytometer (Beckman Coulter, CA, USA).The antibody used were PE-CD133 antibody (BD), BB515 Mouse Anti-Human CD117 (BD) and Human STRO-1 Alexa Fluor® 647-conjugated antibody (R & D Systems, MN, USA).
RNA extraction & quantitative real-time-PCR
TRIzol Reagent (Life Technologies, CA, USA) was used to isolate total RNA, which was then used to synthesize complementary DNA by using the iScript cDNA Synthesis Kit (Bio-Rad, CA, USA). Real-time PCR was performed subsequently, by using an SYBR premix Ex Taq (Takara, Liaoning, China) and ABI 7500 Sequence Detection System (Thermo Fisher Scientific, MA, USA). All procedures were done according to the manufacture’s protocols. The sequences of primers used are presented in .
Table 1. Primers used for quantitative real-time-PCR.
Western blot analysis
Cells were washed using PBS and dissolved in lysis buffer with protease inhibitor (Roche, Grenzach, Germany). The Bicinchonimic acid Protein Assay Kit (Pierce, IL, USA) were used to assess protein concentrations. Cell homogenates containing equal amounts of protein were separated on 10% SDS-PAGE and then transferred on 0.22-μm polyvinylidene difluoride membranes. The membranes were blocked with 5% skimmed milk for 1 h at room temperature. Primary antibody (all at 1:1000 dilution) were incubated overnight at 4°C. Secondary antibodies (all at 1:5000) were incubated for 2 h at room temperature. Finally, membranes were developed using an enhanced chemiluminescence substrate. Positive immunoreactive bands were quantified and normalized to GAPDH. The primary antibodies used were rabbit monoclonal anti-METTL3 (Abcam, Cambridge, UK), rabbit monoclonal anti-METTL14 (Abcam), mouse monoclonal anti-FTO (Abcam) and rabbit monoclonal anti-ALKBH5 (Abcam), and mouse anti-GAPDH (Cell Signaling Technology [CST], MA, USA). The secondary antibodies used were anti-mouse IgG, HRP-linked antibody (CST) and anti-rabbit IgG, HRP-linked antibody (CST).
In vivo tumorigenicity assay
According to the method published previously [Citation24], exponentially growing MG63 and MG63/DXR were harvested, counted with trypan blue to show cells with at least 95% viability, and then resuspended at a final amount from 5 × 10⁶ to 5 × 10³ in 100 μl Matrigel (Corning, NY, USA) before being injected subcutaneously into 5-week-old female nude mice (BALB/c, nu/nu; SIPPR-BK Laboratory Animal Co. Ltd, Shanghai, China). The mice were monitored once every 3 days until the 60th day, and euthanized humanely after the experiment. All animal operations were approved by Institutional Animal Care and Use Committee (IACUC) of Shanghai Jiaotong University affiliated Shanghai Sixth People’s Hospital.
MeRIP-seq & data analysis
Cloudseq Biotech Inc. (Shanghai, China) provided MeRIP-Seq service. Briefly, three biological replicates were used for resistant (MG63/DXR) and parental (MG63) groups. Total RNA was extracted from the two groups of cells by using TRIzol Reagent (Life Technologies). The quality and quantity of total RNA were assessed by using NanoDrop ND-2000 (Thermo Fisher Scientific, MA, USA). The RNA integrity was measured using denaturing agarose. Seq-Star T M poly(A) mRNA Isolation Kit (Arraystar, MD, USA) was used to isolate mRNA from total RNA. The GenSeq™ m6A RNA IP Kit (GenSeq Inc., China) was used to perform m6A RNA immunoprecipitation by following the manufacturer’s instructions. The input samples without immunoprecipitation and the m6A IP samples were both used for library construction with NEBNext® Ultra II Directional RNA Library Prep Kit (New England Biolabs, Inc., MA, USA). The library quality was evaluated with BioAnalyzer 2100 system (Agilent Technologies Inc., CA, USA). Library sequencing was performed on an Illumina Hiseq instrument with 150 bp paired-end reads.
Paired-end reads were harvested from Illumina HiSeq 4000 sequencer, and were quality controlled by Q30. After 3′ adaptor-trimming and low quality reads removing by cutadapt software (v1.9.3). First, clean reads of all libraries were aligned to the reference genome (HG19) by Hisat2 software (v2.0.4). Methylated sites on RNAs (peaks) were identified by MACS software [Citation25]. Identified m6A peaks were subjected to motif enrichment analysis by HOMER [Citation26], and metagene m6A distribution was characterized by R package MetaPlotR [Citation27]. Differentially methylated sites (fold change ≥2 and p < 0.05) were identified by diffReps [Citation28]. These peaks identified by both softwares overlapping with exons of mRNA were figured out and chosen by homemade scripts. The gene ontology (GO) analysis and pathway enrichment analysis were performed on the differentially methylated protein coding genes by using GO (www.geneontology.org) and Kyoto Encyclopedia of Genes and Genomes (KEGG) database (www.genome.jp/kegg).
RNA-seq & data analysis
Total RNA was extracted from biological samples using Trizol Regeant (Life Technologies) according to Manufacturer’s protocol. Denatured agarose gel electrophoresis was applied to evaluate integrity of total RNA. Seq-Star T M poly(A) mRNA Isolation Kit (Arraystar, MD, USA) was used to purify mRNA from total RNA after confirming its quantity and quality by NanoDrop ND-2000. Then fragmented mRNA was subjected to 50-bp single-end sequencing with a BGISEQ-500 platform. Adapter and low quality reads were trimmed by SOAPnuke [Citation29], and trimmed reads were aligned to reference genome by bowtie2 [Citation30]. RSEM [Citation31] was used to calculate expression levels, and DEGs were identified by DEGseq [Citation32].
Public datasets & analysis
GSE33458 derived from GEO datasets [Citation33] was explored to testify the differential expression of some candidate genes between PKH26Hi cells (tumor-initiating cells [TICs]) and PKH26Lo cells (non-TICs), which were harvested from five orthotopic tumors established by MNNG/HOS and 143B cells [Citation34]. Besides, to generate Kaplan–Meier survival curves, a dataset, Mixed Osteosarcoma–Kuijjer–127–vst–ilmnhwg6v2, which contains genome-wide gene expression data of OS patient biopsy samples, was explored by using R2: Genomics Analysis and Visualization Platform (http://r2.amc.nl).
Statistical analyses
Unless stated otherwise, data from all experiments are expressed as mean ± standard deviation (SD) of at least three replicates in each group, and analyzed by using GraphPad Prism Version 7.0 software. The significance of differences between resistant and parental groups were tested by using unpaired two-tailed Student’s t-test. Tumor-free survival was calculated by Kaplan–Meier analysis and compared by using log-rank test. The differences were considered significant if p-value <0.05.
Results
A multidrug-resistant OS cell line MG63/DXR was established
A multidrug-resistant MG63/DXR was established by stepwise inducement on exposure to increasing concentration DXR, to which the half inhibition concentration (IC50) and resistance index (RI) of four first-line chemotherapy drugs were further assessed and displayed in & . From the dose-response curves of DXR (A), MTX (B), DDP (C) and IFO (D), a higher IC50 value to MG63/DXR compared with MG63, was observed, and the differences were significant (E). The gene involved with multidrug resistance, ABCB1 was significantly upregulated in MG63/DXR (F). In addition, MG63/DXR was found to exhibit a little bit lower proliferating ability than MG63 (G).
After MG63/DXR was harvested, its drug sensitivity was compared with the parental cell line MG63, by performing CCK8 assays when they were exposed to drugs with different concentration gradient for 48 hours. The dose-response curves of DXR (A), MTX (B), DDP (C) and IFO (D) are displayed respectively. (E) IC50 values for MG63/DXR are significantly higher than MG63. (F)ABCB1, a gene related to multidrug resistance is significantly upregulated in MG63/DXR when assessed by quantitative real-time-PCR. The data were normalized by level of GAPDH. (G) Proliferation assay using CCK8 showed that MG63/DXR exhibit a little bit lower proliferation ability compared with MG63.
Except for proliferation assay, whose data were shown as mean ± standard deviation (n = 4), all data are presented as mean ± standard deviation (n = 3). The data of A∼D and G were analyzed using two-way analysis of variance followed by Sidak’s multiple comparisons test. Other data were analyzed using unpaired two-tailed Student’s t-test.
*p < 0.05; **p < 0.01; ***p < 0.001; ****p 0.0001.
DDP: Cisplatin; DXR: Doxorubicin; IFO: Ifosfamide; MTX: Methotrexate.
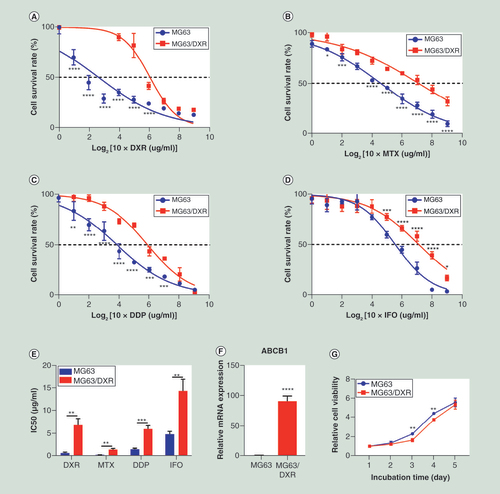
Table 2. IC50 values of four chemotherapy drugs.
MG63/DXR displayed the characteristics of OSCs
The CSC properties that MG63/DXR possessed were testified according to the methods described by Tirino et al. [Citation24]. Initially, specific cell surface markers, CD133 [Citation35] and CD117/STRO-1 [Citation36] were analyzed. MG63/DXR contains a higher percentage of CD133+ and CD117+/STRO-1+ cells subpopulation (A). Furthermore, the stem-cell associated genes, SOX2, POU5F1, NANOG and KLF4 were all found upregulated in MG63/DXR (B). Additionally, MG63/DXR was able to generate far more sarcospheres than MG63 (C). Finally, compared with MG63, MG63/DXR showed a higher tumorigenic potential when injected into nude mice subcutaneously, with much lower tumor-free survival rate (D & .). Collectively, these results demonstrated that MG63/DXR possessed the properties of OSCs.
(A) Flow cytometry analysis showed the ratio of CD133 positive cells and CD117/Stro-1 double positive cells was increased in MG63/DXR compared with MG63. (B) Stem cell related genes were upregulated in MG63/DXR compared with MG63 when assessed by quantitative real-time-PCR. (C) Sphere formation assay showed the self-renewal ability in vitro was enhanced in MG63/DXR. (D)In vivo tumorigenicity assay showed, for MG63/DXR, 5 × 10⁴ cells were enough to form tumors, whereas for MG63, 5 × 10⁶ cells were needed, and tumor-free survival curves of nude mice showed MG63/DXR displayed higher tumorigenic capacity.
Except for in vivo tumorigenicity assay, whose were data analyzed using Log-rank test, other data were presented as mean ± standard deviation (n = 3), and analyzed using unpaired two-tailed Student’s t-test.
*p < 0.05; **p < 0.01; ***p < 0.001; ****p < 0.0001.
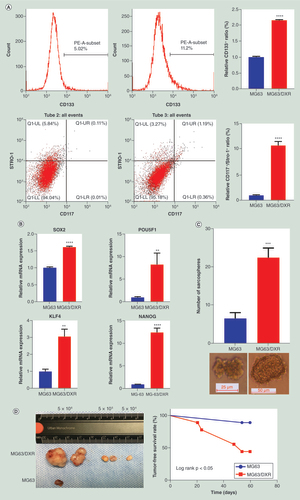
Table 3. Tumorigenic potential following subcutaneous injection into nude mice.
Overview of m6A methylation map in MG63 & MG63/DXR
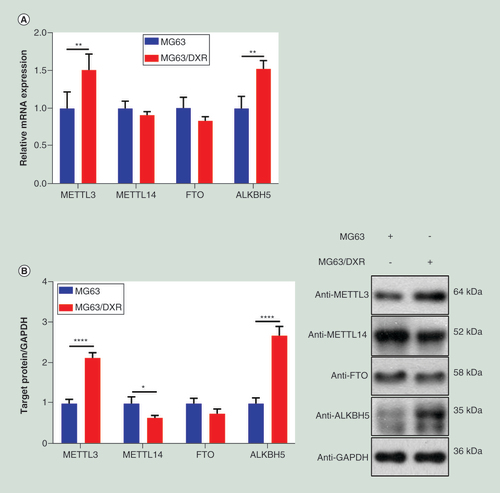
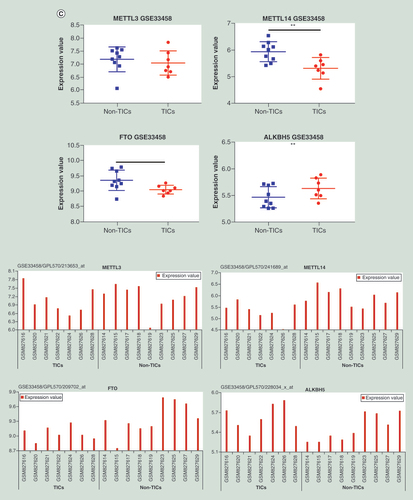
By using quantitative real-time-PCR and western blot, the expressions of four major enzymes involved with m6A methylation including METTL3, METTL14, FTO and ALKBH5 were compared between MG63 and MG63/DXR. As showed in A & B, in MG63/DXR, METTL3 and ALKBH5 were significantly upregulated at both mRNA and protein levels, whereas FTO was downregulated not significantly at both levels, and METTL14 was downregulated at protein levels significantly, in despite its mRNA change was not significant enough. Besides, a publicly available dataset (GSE33458) was analyzed [Citation33], which showed that the expression of METTL14 and FTO are downregulated markedly in OS TICs, compared with non-TICs, however, the differences of METTL3 and ALKBH5 expression are indistinctive (C). Thus, it is speculated that the difference of m6A methylation between OSCs and non-OSCs might exist, which was further detected by using MeRIP-seq.
(A) The expressions of METTL3 and ALKBH5 were significantly upregulated in MG63/DXR, whereas those of METTL14 and FTO were downregulated without significance when assessed by quantitative real-time-PCR. (B) Histogram plot showing relative band intensities for target protein/GAPDH from the right western-blot analysis for MG63 and MG63/DXR (C) scatter plot showing the expression value of four m6A-related genes from the right GEO2R analysis for nontumor initiating cells and tumor initiating cells in GSE33458. All data are presented as mean ± SD (n = 3, except for C), and analyzed using unpaired two-tailed Student’s t-test. (D) Volcano plots displaying the distinct m6A peaks (fold change ≥ 2 and p < 0.05). (E) Distribution of differentially methylated m6A sites with significance in chromosomes of human beings. (F) Accumulation of m6A peaks along transcripts. Each transcript is divided into three parts including 5′untranslated region, coding DNA sequence and 3′untranslated region. (G) Pie charts showing m6A peaks distribution in different gene context. (H) The top five motifs enriched across m6A peaks identified from MG63/DXR. (I) Data visualization of KLF4 mRNA m6A modification in MG63 and MG63/DXR.
*p < 0.05; **p < 0.01; ***p < 0.001; ****p < 0.0001.
CDS: Coding DNA sequence; DXR: Doxorubicin; UTR: Untranslated region; TIC: Tumor-initiating cell.
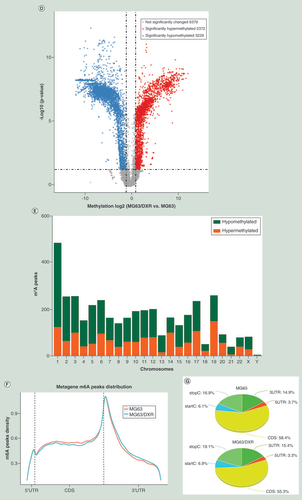
As D displayed, compared with MG63, 2372 significantly hypermethylated m6A peaks and 3229 significantly hypomethylated m6A peaks were harvested in MG63/DXR (fold change ≥2 and p < 0.05). The top 20 differently methylated m6A peaks are listed in . The altered m6A peaks were further found to be transcribed from all chromosomes, especially chr1 (D). To recover the preferential distribution of m6A in transcripts, the metagene profiles of all identified m6A peaks was investigated in the entire transcriptome, which exhibited that m6A peaks were mainly enriched in coding sequence (CDS), stop codon and beginning of 3′ untranslated regions (3′ UTRs) in both groups (F & G). To determine if the identified m6A peaks shared the conserved motif, enrichment analysis result revealed m6A RRACH (R represents purine, A is m6A and H is a nonguanine bas) consensus sequences (H), that is consistent with former studies, reinforcing the authenticity of the data. KLF4, a significantly hypermethylated peak is showed in I.
Table 4. The top 20 differently methylated m6A peaks (resistant/parental).
GO & KEGG pathway analysis of differentially methylated genes
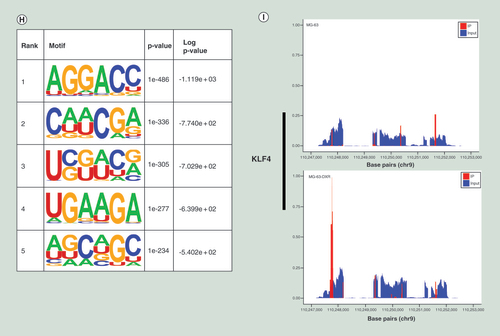
In order to reveal the biological significance of m6A methylation in MG63/DXR, the genes containing significantly altered m6A peaks (differentially methylated genes, DMGs) were analyzed by performing GO and KEGG pathway analysis. GO analysis uncovered that the hypermethylated genes in MG63/DXR were significantly involved with cellular macromolecule metabolic process (ontology: biological process), intracellular organelle (ontology: cellular component), nucleic acid binding (ontology: molecular function; A). The hypomethylated genes were significantly associated with regulation of nucleobase-containing compound metabolic process (ontology: biological process), intracellular (ontology: cellular component), nuclear acid binding (ontology: molecular function; B).
(A) Major gene ontology terms were significantly enriched for the hypermethylated genes. (B) Major gene ontology terms were significantly enriched for the hypomethylated genes. (C) The top ten significantly enriched pathways for the hypermethylated genes. (D) The top ten significantly enriched pathways for the hypomethylated genes.
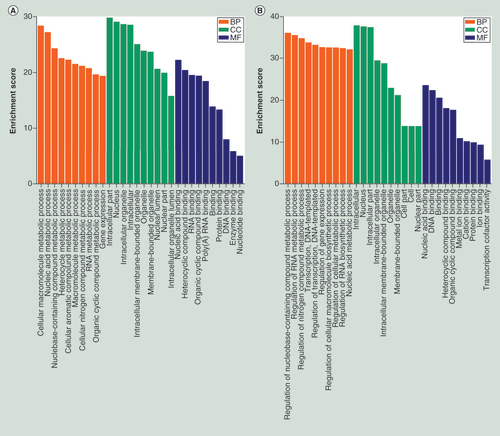
Remarkably, KEGG pathway analysis demonstrated that both of the hypermethylated genes (C), and the hypomethylated genes (D) were significantly associated with signaling pathway regulating pluripotency of stem cells, Wnt signaling pathway, and Notch signaling pathway (not shown in top 10).
Conjoint analysis of DMGs & DEGs
RNA-seq was used to detect the DEGs between MG63 and MG63/DXR, which was exhibited in A. Compared with MG63, 10,350 genes were differentially expressed in MG63/DXR (fold change ≥2 and p < 0.05), including 7602 genes downregulated and 2748 genes upregulated. The top twenty GO and KEGG pathways involved with DEGs are displayed in Supplementary Figures 1 & 2. By conjoint analysis of DMGs and DEGs, all genes were mainly divided into four groups, including 263 hypermethylated as well as upregulated genes (hyper-up), 324 hypomethylated as well as downregulated genes (hypo-down), 61 hypermethylated but downregulated genes (hyper-down) and 16 hypomethylated but upregulated genes (hypo-up) (B). The top twenty differently expressed genes containing differently methylated peaks are listed in . The differentially methylated and synchronously DEG associated with signaling pathway regulating pluripotency of stem cells were selected and performed hierarchical cluster analysis (C), in which eight upregulated genes in resistant group (MG63/DXR) and 18 upregulated genes in parental group (MG63) were respectively performed GO analysis to uncover the biological process that they are associated with. The genes upregulated in parental group were found to positively regulate osteoblast differentiation and negatively regulate cell proliferation (D), whereas those upregulated in resistant group were revealed to positively regulate cell cycle, maintain stem cell population and belong to canonical Wnt signaling pathway (E). BMP2 and SMAD5, two candidate genes selected from the 18 upregulated genes in MG63, were also found to be upregulated in non-TICs in GSE33458 dataset (F). FZD8 and KLF4, two candidate genes, selected from the eight upregulated genes in MG63/DXR were significantly upregulated in TICs in GSE33458 dataset (G).
(A) Scatter plots showing the differentially expressed genes (DEG) (fold changes ≥2 and p < 0.05). (B). Four quadrant graph exhibiting the DEGs containing differentially methylated m6A peaks. (C) Hierarchical clustering analysis of the DEGs containing differentially methylated m6A peaks selected from the signaling pathway regulating pluripotency of stem cells, including eight upregulated genes in MG63/DXR and 18 upregulated genes in MG63. (D) The top twenty gene ontology terms of biological process were significantly enriched for the 18 upregulated genes in MG63. (E) The top twenty gene ontology terms of biological process were significantly enriched for the eight upregulated gene in MG63/DXR. (E) Scatter plots showing the expression value of four candidate genes from the below GEO2R analysis for non-tumor-initiating cells and tumor-initiating cells in GSE33458.
TIC: Tumor-initiating cell.
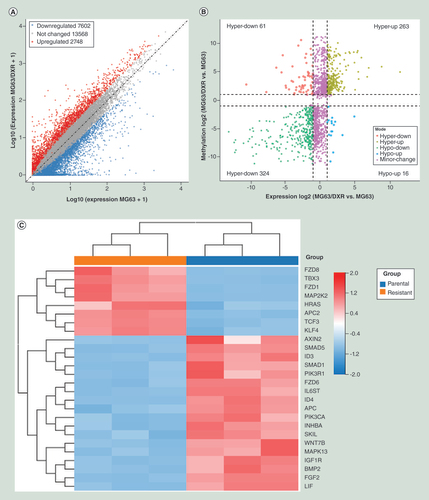
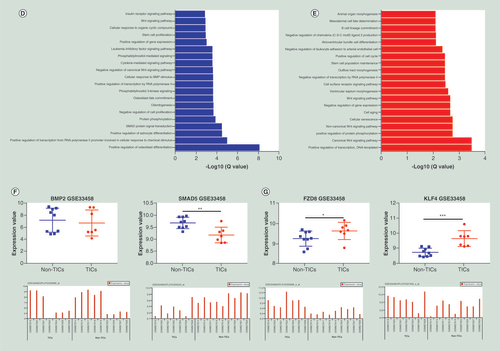
Table 5. The top 20 differently expressed genes containing differently methylated peaks (resistant/parental).
Expression of candidate genes correlates with worse metastasis-free survival in OS patients
To confirm the clinical significance of the candidate genes discovered in this study, a dataset, Mixed OS (Mesenchymal) – Kuijjer – 127 – vst – ilmnhwg6v2) from the R2: Genomics Analysis and Visualization Platform (http://r2.amc.nl) was explored. Kaplan–Meier analysis extracted from this dataset uncovered that a high expression of METTL3, ALKBH5, FZD8, KLF4, but a low expression of BMP2 and SMAD5, showed a tendency to associate with worse metastasis-free survival in OS patients ().
(A) The high expression of METTL3 and ALKBH5 in mRNA level correlate with worse metastasis-free survival. (B) Whereas, low BMP2 and SMAD5 mRNA expression levels showed a tendency to correlate with worse metastasis-free survival. (C) High expression of FZD8 and KLF4 in mRNA level associate with worse metastasis-free survival, and the differences are significant which were tested using log-rank test. p-value are displayed in the lower right corner of the each picture.
bonf p: Adjusted p-value for multiple comparisons (Bonferroni method); Raw p: Raw p-value.
Discussion
Chemotherapy resistance in OS is still a challenge in clinical administration [Citation37]. What is even more frustrating is that a randomized controlled trial demonstrated that reinforced postoperative chemotherapy for OS patients whose tumor showed a poor response to neoadjuvant chemotherapy did not improve event-free survival [Citation38], in which the underlying mechanism demand to be clarified urgently. Increasing evidence demonstrates that cancer cells can be reprogrammed to primitive cancer cell state (namely CSC) in a variety of ways, including transcription factor reprogramming [Citation39], epithelial–mesenchymal transition [Citation40], conditional reprogramming [Citation41,Citation42], hypoxia [Citation43] and chemotherapy [Citation7,Citation8], which gives rise to drug resistance and tumor relapse [Citation44]. It has been shown that m6A methylation could dynamically regulate cellular responses to environmental stressors, including traumatic injury [Citation45], high-fat feeding [Citation46], heat shock [Citation47], hypoxic stress [Citation48] and oxidative stress [Citation49]. In this study, the changes of m6A methylation was first found to happen when OS cells was treated with chemotherapy drugs, and may be associated with the emergence of stemness and acquired chemoresistance.
In the current study, in order to enrich OSCs, a multidrug-resistant MG63/DXR was established, whose chemoresistance and stemness were further testified according to the methods reported previously [Citation7–9,Citation22,Citation24]. Compared with parental cell line MG63, the resistant cell sub-population MG63/DXR enriched in this study showed a multidrug resistance, decreased proliferative capacity and upregulated expression of ABCB1, which is consistent with the former reports [Citation9,Citation22,Citation50]. Besides, it is confirmed that the cell subpopulation enriched by chemotherapy displayed stem cell-like characteristics, including possessing much higher proportion of CD133+ and CD117+/Stro-1+ cell sub-population, upregulated expression of SOX2, POU5F1, NANOG and KLF4, increasing sphere formation and in vivo engraftment capacity, which corresponds with the results reported by Yu et al. [Citation8] and Martins-Neves et al. [Citation7]. It was reported that inhibition of ABCB1 by the clustered regularly interspaced short palindromic repeats associated Cas9 system (CRISPR-Cas9) reversed the drug resistance in OS MDR cell lines to DXR but not DDP [Citation51]. OSCs enriched by chemotherapy is a possible mechanism to explain why MG63/DXR displayed cross resistance to DDP, MTX and IFO [Citation52].
Increasing evidences suggest that m6A modification is strongly associated with the tumorigenesis and progression of a variety of cancer. METTL3 was reported as an oncogene in human lung cancer cells by promotes translation of certain mRNAs, such as epidermal growth factor receptor and Hippo pathway effector TAZ [Citation53]. METTL3 depletion was shown to promote cell cycle arrest, differentiation and apoptosis and postpone leukemia progression in xenograft mice [Citation14,Citation15]. Recently, it was reported that METTL3 promoted OS progression by targeting LEF1 [Citation54]. METTL14 was found to act as a tumor suppressor gene by interacting with the microprocessor protein DGCR8 to facilitate primary microRNA-126 process in an m6A-dependent manner, so that the metastasis of hepatocellular carcinoma is inhibited [Citation55]. But in leukemia stem cells, METTL14 exerts its oncogenic function by targeting MYB and MYC mRNA [Citation16]. In breast CSCs, ALKBH5 function as an oncogene, whose upregulation induced by hypoxia reduces the level of m6A in NANOG mRNA, which in reverse increases its stability and its expression in protein levels [Citation56]. ALKBH5 was also confirmed to maintain tumorigenicity in glioblastoma stem-like cells by sustaining FOXM1 expression [Citation18]. For our data, METTL14 and FTO (without significance) are downregulated in MG63/DXR, which is coincident with those in TICs in GSE33458. METTL3 and ALKBH5 are significantly upregulated in MG63/DXR, but not in TICs, which were isolated by PKH26 staining and did not undergo the stress of chemotherapy [Citation34], by which the inconformity can be explained. The data available suggest that m6A methylation is strongly associated with OSCs, although these two results do not overlap absolutely.
The KEGG pathway analysis demonstrated that DMGs significantly associated with signaling pathway regulating pluripotency of stem cells, in which the most DMGs were also found to be differentially expressed between MG63 and MG63/DXR. By GO analysis, the eight upregulated genes in MG63/DXR were uncovered to participate in maintaining stem cell population and belong to canonical Wnt signaling pathway, and the 18 upregulated genes in MG63 were found to positively regulate osteoblast differentiation. Selected from the genes enriched in maintaining stem cell population, KLF4, whose mRNA is hypermethylated with a 13-fold change, and upregulated with a 3.2-fold change in MG63/DXR, was reported as a typical oncogene promoting CSC-like characteristic in OS cell [Citation57,Citation58]. FZD8, selected from canonical Wnt signaling pathway, whose mRNA is found with 554-fold-change hypermethylation and 30-fold-change upregulation, was reported as a target of miroRNA-520b to inhibit OS cell proliferation, migration and invasion [Citation59]. BMP2 is a representative in the genes promoting osteoblast differentiation, whose mRNA is hypomethylated with 516-fold change, and downregulated with over 8-fold change in MG63/DXR. SMAD5 is an important component that constitutes heteromeric complexes with other SMADs to transduce BMP signals to nucleus [Citation60]. Its mRNA is found to be hypomethylated with 161-fold change, and downregulated with 2.8-fold change. Furthermore, the expression changes of these four candidate genes in TICs in GSE 33458 are consistent with our data. In fact, it has been shown that canonical Wnt signaling regulates embryonic stem cell differentiation and self-renewal via β-catenin regulation, and maintain the expression of specific pluripotency transcription factors [Citation61–64]. A report showed BMP2 downregulated POU5F1, SOX2 and NANOG expression in OS cells, as well as upregulated transcription of osteogenic markers, resulting in decreased tumorigenesis potential [Citation65]. Besides, it was reported that a novel anticancer diterpenoid inhibits OS growth by inducing BMP2-dependent differentiation [Citation66]. From these findings, we speculate that the activation of canonical Wnt signaling and the inactivation of BMP signaling via m6A methylation might play a critical role in the advent and maintaining of OSCs.
OSCs appear to play central roles not only in chemoresistance but also in metastases, which is the main cause of death in OS patient [Citation6]. It has been reported that the OSCs induced by transforming growth factor β1 (TGF-β1) signaling combined with a hypoxic environment displayed increased chemoresistance, tumorigenicity and metastatic potential [Citation67]. Besides, He et al. reported that CD133+ subpopulations in OS cell exhibited higher migration and invasive properties, especially in lung metastasis [Citation68]. To testify clinical significance of the candidate genes differentially expressed in MG63/DXR, we explored the relationship between their expression level in biopsy specimens and the metastasis-free survival rate in 88 OS patient. As the results show, these m6A related enzyme and the genes regulated by m6A do correlate with poor prognosis in OS patients. But, METTL14 and FTO do not exist in the dataset used, so we do not know whether they are related to the clinical prognosis. In addition, we think it is necessary to compare the expression of these genes between diagnostic biopsy specimens and surgical resection specimens to further testify whether chemotherapy induce the same changes of m6A methylation. Taken together, in despite of some deficiencies, our results provide the first proof of a link between m6A methylation and OSCs, and their potential clinical significance for OS patients. Therefore, it is worth taking more effort to clarify the precise mechanism underlying the effects that m6A exerts on OSCs.
Conclusion
Our research, for the first time, integrally analyzed the transcriptome-wide m6A methylome of OSCs enriched by chemotherapy, revealing a tight relationship between m6A methylation and the emergence and maintaining of OSCs. Besides, the candidate genes were further proved to be associated with poor prognosis of OS patients. Altogether, our results provided a fundamental contribution for further researches aimed to find novel therapeutic targets for overcoming OS.
Future perspective
M6A is known as an important part of post-transcriptional regulation, which is associated with regulating cellular responses to environmental stressors, and maintaining of various CSCs. This study illustrated that the changes of m6A methylation happened in OS cells treated by chemotherapeutic drugs, which was further found to correlate with the advent and maintaining of OSCs Furthermore, the expressions of some m6A-related genes and the DEGs regulated by m6A were uncovered to associate with worse prognosis. Therefore, m6A methylation may be a breakthrough point to improve treatment of OS. In order to further testify the findings in this study, we are trying to establish several models of OSCs by using multiple reported methods, including chemotherapy, spheres formation assay and sorting by Cell surface markers or aldehyde dehydrogenase. Although Yamanaka factors are currently used as a way to identify OSCs by detecting their expression, it may be a brand new method to isolate OSCs after some exploratory research. In addition, the RNA banding proteins of differentially methylated mRNAs found in this study have been identified by using RMBase v2.0 database, whose functions may need further research to clarify, which will be reported in future work.
The expression of some m6A-related enzyme were significantly changed in osteosarcoma (OS) stem cells harvested by different methods and derived from different parental cell lines.
Compared with MG63, 2372 hypermethylated and 3229 hypomethylated m6A peaks were identified in MG63/DXR (fold change ≥2 and p < 0.05).
Both of the hypermethylated genes and hypomethylated genes were significantly associated with the signaling pathway regulating pluripotency of stem cells.
Compared with MG63, 2748 upregulated genes and 7602 down regulated genes were detected in MG63/DXR (fold change ≥2 and p < 0.05).
The differentially methylated genes selected from the signaling pathway regulating pluripotency of stem cells were also differentially expressed in MG63/DXR, compared with MG63.
The activation of canonical Wnt signaling and the inactivation of BMP signaling may play a critical role in the advent and maintaining of OS stem cells.
The expressions of some m6A-related genes and the differentially expressed genes regulated by m6A were uncovered to associate with worse metastasis-free survival in OS patient.
Author contributors
Y Dong, S Tu contributed to design the research; Y Wang, L Zeng and C Liang conducted the experiments; Y Wang and L Zeng analyzed and interpreted the data, and drafted the manuscript. R Zan, Y Wei, W Ji and Z Zhang helped to polish the manuscript. All authors read and approved the final manuscript.
Ethical conduct of research
All the procedures regarding animal maintenance and experiments are in strict accordance with the policy of the Institutional Animal Care and Use Committee of Shanghai Jiaotong University affiliated Shanghai Sixth People’s Hospital. The Institutional Animal Care and Use Committee has approved this study. All surgery was performed under Pentobarbital sodium injection anesthesia, and all efforts were made to minimize suffering.
Supplemental document 1
Download PDF (5.6 MB)Supplemental document 2
Download PDF (866.3 KB)Supplemental information 3
Download Zip (6 MB)Supplementary data
To view the supplementary data that accompany this paper please visit the journal website at: www.tandfonline.com/doi/full/10.2217/epi-2019-0262
Financial & competing interests disclosure
This research was supported by Interdisciplinary Research Fund of Translational Medicine From Shanghai jiao Tong University (ZH2018QNB06) and the grants from the National Natural Science Foundation of China (NSFC61802256). The authors have no other relevant affiliations or financial involvement with any organization or entity with a financial interest in or financial conflict with the subject matter or materials discussed in the manuscript apart from those disclosed.
No writing assistance was utilized in the production of this manuscript.
Additional information
Funding
References
- Gianferante DM , MirabelloL , SavageSA. Germline and somatic genetics of osteosarcoma - connecting aetiology, biology and therapy. Nat. Rev. Endocrinol.13(8), 480–491 (2017).
- Siclari VA , QinL. Targeting the osteosarcoma cancer stem cell. J. Orthop. Surg. Res.5, 78 (2010).
- Isakoff MS , BielackSS , MeltzerP , GorlickR. Osteosarcoma: current treatment and a collaborative pathway to success. J. Clin. Oncol.33(27), 3029–3035 (2015).
- Kansara M , TengMW , SmythMJ , ThomasDM. Translational biology of osteosarcoma. Nat. Rev. Cancer14(11), 722–735 (2014).
- Brown HK , Tellez-GabrielM , HeymannD. Cancer stem cells in osteosarcoma. Cancer Lett.386, 189–195 (2017).
- Yan GN , LvYF , GuoQN. Advances in osteosarcoma stem cell research and opportunities for novel therapeutic targets. Cancer Lett.370(2), 268–274 (2016).
- Martins-Neves SR , Paiva-OliveiraDI , Wijers-KosterPMet al. Chemotherapy induces stemness in osteosarcoma cells through activation of Wnt/beta-catenin signaling. Cancer Lett.370(2), 286–295 (2016).
- Yu L , FanZ , FangSet al. Cisplatin selects for stem-like cells in osteosarcoma by activating Notch signaling. Oncotarget7(22), 33055–33068 (2016).
- Tang QL , LiangY , XieXBet al. Enrichment of osteosarcoma stem cells by chemotherapy. Chin. J. Cancer30(6), 426–432 (2011).
- Wei CM , GershowitzA , MossB. Methylated nucleotides block 5′ terminus of HeLa cell messenger RNA. Cell4(4), 379–386 (1975).
- Zhao BS , HeC. Fate by RNA methylation: m6A steers stem cell pluripotency. Genome Biol.16, 43 (2015).
- Geula S , Moshitch-MoshkovitzS , DominissiniDet al. Stem cells. m6A mRNA methylation facilitates resolution of naive pluripotency toward differentiation. Science347(6225), 1002–1006 (2015).
- Zhang C , ChenY , SunBet al. m(6)A modulates haematopoietic stem and progenitor cell specification. Nature549(7671), 273–276 (2017).
- Vu LP , PickeringBF , ChengYet al. The N(6)-methyladenosine (m(6)A)-forming enzyme METTL3 controls myeloid differentiation of normal hematopoietic and leukemia cells. Nat. Med.23(11), 1369–1376 (2017).
- Barbieri I , TzelepisK , PandolfiniLet al. Promoter-bound METTL3 maintains myeloid leukaemia by m(6)A-dependent translation control. Nature552(7683), 126–131 (2017).
- Weng H , HuangH , WuHet al. METTL14 inhibits hematopoietic stem/progenitor differentiation and promotes leukemogenesis via mRNA m(6)A modification. Cell Stem Cell22(2), 191–205.e199 (2018).
- Cui Q , ShiH , YePet al. m(6)A RNA methylation regulates the self-renewal and tumorigenesis of glioblastoma stem cells. Cell Rep.18(11), 2622–2634 (2017).
- Zhang S , ZhaoBS , ZhouAet al. m(6)A demethylase ALKBH5 maintains tumorigenicity of glioblastoma stem-like cells by sustaining FOXM1 expression and cell proliferation program. Cancer Cell31(4), 591–606.e596 (2017).
- Meyer KD , SaletoreY , ZumboP , ElementoO , MasonCE , JaffreySR. Comprehensive analysis of mRNA methylation reveals enrichment in 3′ UTRs and near stop codons. Cell149(7), 1635–1646 (2012).
- Dominissini D , Moshitch-MoshkovitzS , SchwartzSet al. Topology of the human and mouse m6A RNA methylomes revealed by m6A-seq. Nature485(7397), 201–206 (2012).
- Luo GZ , MacqueenA , ZhengGet al. Unique features of the m6A methylome in Arabidopsis thaliana. Nat. Commun.5, 5630 (2014).
- Oda Y , MatsumotoY , HarimayaK , IwamotoY , TsuneyoshiM. Establishment of new multidrug-resistant human osteosarcoma cell lines. Oncol. Rep.7(4), 859–866 (2000).
- Han XG , DuL , QiaoHet al. CXCR1 knockdown improves the sensitivity of osteosarcoma to cisplatin. Cancer Lett.369(2), 405–415 (2015).
- Tirino V , DesiderioV , PainoF , PapaccioG , DeRosa M. Methods for cancer stem cell detection and isolation. Methods Mol. Biol.879, 513–529 (2012).
- Zhang Y , LiuT , MeyerCAet al. Model-based analysis of ChIP-Seq (MACS). Genome Biol.9(9), R137 (2008).
- Heinz S , BennerC , SpannNet al. Simple combinations of lineage-determining transcription factors prime cis-regulatory elements required for macrophage and B cell identities. Mol. Cell38(4), 576–589 (2010).
- Olarerin-George AO , JaffreySR. MetaPlotR: a Perl/R pipeline for plotting metagenes of nucleotide modifications and other transcriptomic sites. Bioinformatics33(10), 1563–1564 (2017).
- Shen L , ShaoNY , LiuX , MazeI , FengJ , NestlerEJ. diffReps: detecting differential chromatin modification sites from ChIP-seq data with biological replicates. PLoS ONE8(6), e65598 (2013).
- Chen Y , ChenY , ShiCet al. SOAPnuke: a MapReduce acceleration-supported software for integrated quality control and preprocessing of high-throughput sequencing data. Gigascience7(1), 1–6 (2018).
- Langmead B , SalzbergSL. Fast gapped-read alignment with Bowtie 2. Nat. Methods9(4), 357–359 (2012).
- Li B , DeweyCN. RSEM: accurate transcript quantification from RNA-Seq data with or without a reference genome. BMC Bioinformatics12, 323 (2011).
- Wang L , FengZ , WangX , WangX , ZhangX. DEGseq: an R package for identifying differentially expressed genes from RNA-seq data. Bioinformatics26(1), 136–138 (2010).
- Edgar R , DomrachevM , LashAE. Gene expression omnibus: NCBI gene expression and hybridization array data repository. Nucleic Acids Res.30(1), 207–210 (2002).
- Rainusso N , ManTK , LauCCet al. Identification and gene expression profiling of tumor-initiating cells isolated from human osteosarcoma cell lines in an orthotopic mouse model. Cancer Biol. Ther.12(4), 278–287 (2011).
- Tirino V , DesiderioV , D’aquinoRet al. Detection and characterization of CD133+ cancer stem cells in human solid tumours. PLoS ONE3(10), e3469 (2008).
- Adhikari AS , AgarwalN , WoodBMet al. CD117 and Stro-1 identify osteosarcoma tumor-initiating cells associated with metastasis and drug resistance. Cancer Res.70(11), 4602–4612 (2010).
- Chou AJ , GorlickR. Chemotherapy resistance in osteosarcoma: current challenges and future directions. Expert. Rev. Anticancer Ther.6(7), 1075–1085 (2006).
- Marina NM , SmelandS , BielackSSet al. Comparison of MAPIE versus MAP in patients with a poor response to preoperative chemotherapy for newly diagnosed high-grade osteosarcoma (EURAMOS-1): an open-label, international, randomised controlled trial. Lancet Oncol.17(10), 1396–1408 (2016).
- Suva ML , RheinbayE , GillespieSMet al. Reconstructing and reprogramming the tumor-propagating potential of glioblastoma stem-like cells. Cell157(3), 580–594 (2014).
- Mani SA , GuoW , LiaoMJet al. The epithelial-mesenchymal transition generates cells with properties of stem cells. Cell133(4), 704–715 (2008).
- Liu X , KrawczykE , SuprynowiczFAet al. Conditional reprogramming and long-term expansion of normal and tumor cells from human biospecimens. Nat. Protoc.12(2), 439–451 (2017).
- Saenz FR , OryV , AlotaibyMet al. Conditionally reprogrammed normal and transformed mouse mammary epithelial cells display a progenitor-cell-like phenotype. PLoS ONE9(5), e97666 (2014).
- Wang P , WanWW , XiongSL , FengH , WuN. Cancer stem-like cells can be induced through dedifferentiation under hypoxic conditions in glioma, hepatoma and lung cancer. Cell Death Discov.3, 16105 (2017).
- Wan ACA . Primitive cancer cell states: a target for drug screening?Trends Pharmacol. Sci.40(3), 161–171 (2019).
- Wang Y , MaoJ , WangXet al. Genome-wide screening of altered m6A-tagged transcript profiles in the hippocampus after traumatic brain injury in mice. Epigenomics11(7), 805–819 (2019).
- Luo Z , ZhangZ , TaiL , ZhangL , SunZ , ZhouL. Comprehensive analysis of differences of N(6)-methyladenosine RNA methylomes between high-fat-fed and normal mouse livers. Epigenomics11(11), 1267–1282 (2019).
- Zhou J , WanJ , GaoX , ZhangX , JaffreySR , QianSB. Dynamic m(6)A mRNA methylation directs translational control of heat shock response. Nature526(7574), 591–594 (2015).
- Fry NJ , LawBA , IlkayevaOR , HolleyCL , MansfieldKD. N(6)-methyladenosine is required for the hypoxic stabilization of specific mRNAs. Rna23(9), 1444–1455 (2017).
- Anders M , ChelyshevaI , GoebelIet al. Dynamic m(6)A methylation facilitates mRNA triaging to stress granules. Life Sci. Alliance1(4), e201800113 (2018).
- Kun-Peng Z , Xiao-LongM , LeiZ , Chun-LinZ , Jian-PingH , Tai-ChengZ. Screening circular RNA related to chemotherapeutic resistance in osteosarcoma by RNA sequencing. Epigenomics10(10), 1327–1346 (2018).
- Liu T , LiZ , ZhangQet al. Targeting ABCB1 (MDR1) in multi-drug resistant osteosarcoma cells using the CRISPR-Cas9 system to reverse drug resistance. Oncotarget7(50), 83502–83513 (2016).
- Li S , SunW , WangH , ZuoD , HuaY , CaiZ. Research progress on the multidrug resistance mechanisms of osteosarcoma chemotherapy and reversal. Tumour Biol.36(3), 1329–1338 (2015).
- Lin S , ChoeJ , DuP , TribouletR , GregoryRI. The m(6)A methyltransferase METTL3 promotes translation in human cancer cells. Mol. Cell62(3), 335–345 (2016).
- Miao W , ChenJ , JiaL , MaJ , SongD. The m6A methyltransferase METTL3 promotes osteosarcoma progression by regulating the m6A level of LEF1. Biochem. Biophys. Res. Commun.516(3), 719–725 (2019).
- Ma JZ , YangF , ZhouCCet al. METTL14 suppresses the metastatic potential of hepatocellular carcinoma by modulating N(6) -methyladenosine-dependent primary MicroRNA processing. Hepatology65(2), 529–543 (2017).
- Zhang C , SamantaD , LuHet al. Hypoxia induces the breast cancer stem cell phenotype by HIF-dependent and ALKBH5-mediated m(6)A-demethylation of NANOG mRNA. Proc. Natl Acad. Sci. USA113(14), E2047–E2056 (2016).
- Qi XT , LiYL , ZhangYQet al. KLF4 functions as an oncogene in promoting cancer stem cell-like characteristics in osteosarcoma cells. Acta Pharmacol. Sin.40(4), 546–555 (2019).
- Martins-Neves SR , CorverWE , Paiva-OliveiraDIet al. Osteosarcoma stem cells have active Wnt/beta-catenin and overexpress SOX2 and KLF4. J. Cell. Physiol.231(4), 876–886 (2016).
- Wang J , PangW , ZuoZ , ZhangW , HeW. MicroRNA-520b suppresses proliferation, migration, and invasion of spinal osteosarcoma cells via downregulation of Frizzled-8. Oncol. Res.25(8), 1297–1304 (2017).
- Wakefield LM , HillCS. Beyond TGFbeta: roles of other TGFbeta superfamily members in cancer. Nat. Rev. Cancer13(5), 328–341 (2013).
- Kielman MF , RindapaaM , GasparCet al. Apc modulates embryonic stem-cell differentiation by controlling the dosage of beta-catenin signaling. Nat. Genet.32(4), 594–605 (2002).
- Cheng Y , CheungAK , KoJMet al. Physiological beta-catenin signaling controls self-renewal networks and generation of stem-like cells from nasopharyngeal carcinoma. BMC Cell Biol.14, 44 (2013).
- Sato N , MeijerL , SkaltsounisL , GreengardP , BrivanlouAH. Maintenance of pluripotency in human and mouse embryonic stem cells through activation of Wnt signaling by a pharmacological GSK-3-specific inhibitor. Nat. Med.10(1), 55–63 (2004).
- Ten Berge D , KurekD , BlauwkampTet al. Embryonic stem cells require Wnt proteins to prevent differentiation to epiblast stem cells. Nat. Cell Biol.13(9), 1070–1075 (2011).
- Wang L , ParkP , ZhangHet al. BMP-2 inhibits the tumorigenicity of cancer stem cells in human osteosarcoma OS99-1 cell line. Cancer Biol. Ther.11(5), 457–463 (2011).
- Geng S , SunB , LuR , WangJ. Coleusin factor, a novel anticancer diterpenoid, inhibits osteosarcoma growth by inducing bone morphogenetic protein-2-dependent differentiation. Mol. Cancer Ther.13(6), 1431–1441 (2014).
- Zhang H , WuH , ZhengJet al. Transforming growth factor beta1 signal is crucial for dedifferentiation of cancer cells to cancer stem cells in osteosarcoma. Stem Cells31(3), 433–446 (2013).
- He A , QiW , HuangYet al. CD133 expression predicts lung metastasis and poor prognosis in osteosarcoma patients: a clinical and experimental study. Exp. Ther. Med.4(3), 435–441 (2012).