
 ?Mathematical formulae have been encoded as MathML and are displayed in this HTML version using MathJax in order to improve their display. Uncheck the box to turn MathJax off. This feature requires Javascript. Click on a formula to zoom.
Abstract
Aim: To identify patients with colorectal cancer (CRC) who are at a truly higher risk of progression, which is key for individualized approaches to precision therapy. Materials & methods: We developed a predictor associated with progression-free interval (PFI) using The Cancer Genome Atlas CRC methylation data. Results: The risk score was associated with PFI in the whole cohort (p < 0.001). A nomogram consisting of the risk score and other significant clinical features was generated to predict the 3- and 5-year PFI in the whole set (area under the curve: 0.79 and 0.71, respectively). Conclusion: The risk score based on 23 DNA-methylation sites may serve as the basis for improved prediction of progression in patients with CRC in future clinical practice.
GLOBOCAN 2018 estimates that colorectal cancer (CRC) is the third most common cancer and the second leading cause of cancer-associated death worldwide [Citation1]. Distant metastasis and other progression events (such as local recurrence, new primary tumors at all sites or death from the cancer without a new tumor event) occur frequently in patients with CRC [Citation2–Citation4]. With the advancement of comprehensive therapeutic strategies, the prognosis of CRC has improved significantly. Prognostic evaluation is vital for making appropriate therapeutic decisions in patients with CRC. However, the current classification system, such as based on the primary tumor (T), regional lymph nodes (N) and distant metastases (M) to describe the extent of a cancer (TNM staging), is limited regarding clinical prognostication, thus highlighting the need for additional prognostic markers to select suitable therapeutic strategies for these patients. Many studies have reported that a series of changes at the epigenetic level are the hallmark events in the carcinogenic process of, and are prognostic for, CRC. Moreover, epigenetic regulation has become increasingly prominent in the research field of identification and development of diagnostic, prognostic for cancer [Citation5,Citation6].
DNA methylation, which is one of the major epigenetic mechanisms, can change the activity of a DNA segment without changing its sequence by adding a methyl group at cytosine residues. Over time, the dysregulation of DNA methylation plays a key role in the development and progression of cancer. Gene-specific hypermethylation is always focused on promoters and can cause transcription silencing of tumor suppressor genes; conversely, hypomethylation can lead to the upregulation of oncogenes. In addition, hypomethylation is primarily involved in chromosome instability, the reactivation of transposons and loss of genomic imprinting.
Dysregulation of DNA methylation contributes to CRC, as first proposed by Goelz et al. [Citation7]. Previous studies have shown that the promoters of certain suppressor genes, such as APC, SFRP2, SEPT and CDH1 [Citation8–Citation11], are hypermethylated in CRC. However, few methylation markers of CRC are widely accepted and applied in clinical practice. The high-throughput technologies provide the potential for the identification of reliable markers. To date, several genome-wide studies have explored the value of CpG methylation as a predictor of overall survival (OS), but not of progression-free interval (PFI). OS is easily affected by other factors, whereas PFI can reflect the pathological and biological behavior more accurately for patients with CRC.
To understand better the disease mechanism and provide relevant clues for precision therapies, this study identified and validated progression-related CpGs in patients with CRC using The Cancer Genome Atlas (TCGA) database. For predicting the PFI of these patients, we used machine learning to construct a prognostic risk score.
Materials & methods
Source of data
Genome-wide DNA methylation data (methylation beta values [level 3]) and clinical data for patients with CRC patients were obtained from TCGA GDC Data Portal (https://portal.gdc.cancer.gov/). Clinical data included a series of clinical features, such as sex, age, stage, tumor necrosis, microsatellite instability, tumor history, history of colon polyps, surgical margin residual tumor status, non-nodal tumor deposits and survival information. Methylation beta values were measured using the Illumina Infinium Human Methylation 450 BeadChip array, which contained 485,512 probes for each sample. In our study, PFI (https://wiki.nci.nih.gov/plugins/servlet/mobile#content/view/24279961) was chosen as the outcome (PFI is the period from the date of diagnosis until the date of the first occurrence of a new tumor event [progression of the disease, locoregional recurrence, distant metastasis, new primary tumor or death with a tumor]). Patients who were alive without these event types or died without a tumor were excluded from the study [Citation12].
Study design
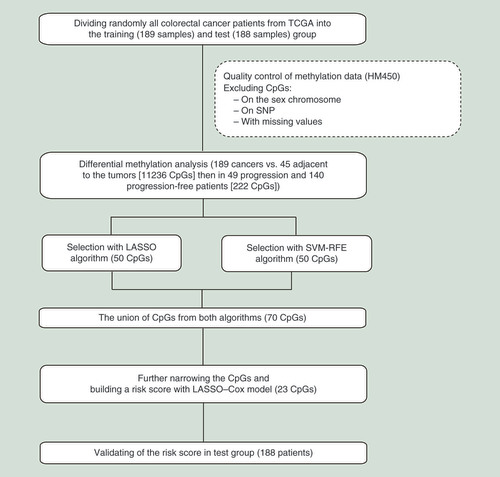
The flowchart of the overall research strategy is shown in . The study was performed over two phases, to identify and validate progression-related CpGs for patients with CRC. Before screening for CpGs, the 377 CRC cases from TCGA were divided randomly into the training (189 samples) and test (188 samples) groups. The first phase consisted mainly of four steps: generation of differential methylation probes (DMPs) for use in differential methylation analysis of cancer tissues versus normal tissues; identification of differentially methylated probes between patients with CRC who exhibited progression and those who did not; application of two algorithms to select significant CpGs; and application of a penalized Cox regression analysis to narrow down CpGs and build a risk score. In the second phase, we validated candidate CpGs using the test cohort.
LASSO: Least absolute shrinkage and selector operation; SVM-RFE: Support vector machine-recursive feature elimination; TCGA: The Cancer Genome Atlas.
Data preprocessing
Sample screening
Several datasets were processed first, as follows. First, 425 samples were retained after the deletion of repeated samples. Second, the tumor samples (n = 380) and normal samples (n = 45) were identified according to TCGA sample id. Finally, we collated and checked the PFI data of patients with CRC; PFI data were not available for three of the 380 tumor samples. Therefore, the data of 377 tumor samples and 45 normal samples were computed in the subsequent steps.
CpG site preprocessing
We divided the 377 tumor samples randomly into a training cohort (189 samples) and a test cohort (188 samples) using a simple randomization method. The initial 485,578 probes were reduced to 349,756 by removing the following probes: those located on the sex chromosome, containing single-nucleotide polymorphisms or with missing values in the training cohort. Next, we used a differential methylation analysis based on CpGs to select candidate CpGs. Threshold values of 0.15 for the average β in each probe, Δβ >0.3 and a false discovery rate–based p < 0.05 were used for filtration in the differential methylation analysis between cancer samples and normal samples in the training cohort; this was followed by a differential methylation analysis between progression and progression-free samples in the training cohort with p < 0.05.
Statistical analysis
Differentially methylated probes based on cancer tissues versus normal tissues were subjected to further prioritization according to the progression status of CRC using the limma package. After preprocessing, the least absolute shrinkage and selector operation (LASSO) algorithm and support vector machine-recursive feature elimination (SVM-RFE) were used to select candidate CpGs using the R package glmnet and e1071, respectively. LASSO was used to conduct penalty parameter tuning and SVM-RFE was used to perform feature ranking; both methods used tenfold cross-validation. Finally, we narrowed down CpGs further by merging the CpGs selected above using an L1 penalized Cox analysis in the training cohort, also via tenfold cross-validation. Next, we proposed a risk score as an integrated indicator, using the penalized Cox regression coefficient (b) in the training cohort as the corresponding weight (Supplementary Table 1). The risk score was calculated as follows: risk score = . The x represents the β value of CpG. According to the risk score, patients with a high risk and low risk of progression were separated using the X-tile software. Combining the clinical features and the risk score would be a better approach to the prediction of CRC prognosis. The Cox univariate regression method was used to analyze the correlation between clinical features and PFI. A nomogram comprising the significant clinical features and the risk score was generated to predict the 3- and 5-year PFI using the rms package. All packages mentioned above were used within the R version 3.5.3 software. Significance was set at p < 0.05.
Results
Clinical characteristics of patients
The clinical features of patients in the training set, test set and whole set are described in . The average PFI was 853 days (28.4 months) in the training set, 800 days (26.7 months) in test set and 826 days (27.5 months) in the whole set.
Table 1. Baseline characteristics of patients in different groups.
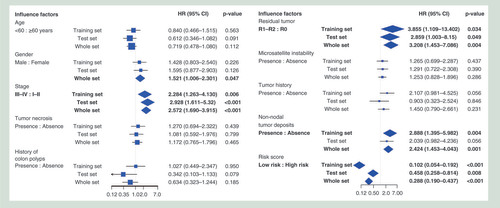
The clinical features, including sex, stage, surgical margin residual tumor status and non-nodal tumor deposits, were significantly associated with PFI. These significant clinical features would be used to predict prognosis in the next steps. No significant association was observed between PFI and these other clinical features (age, tumor necrosis, history of colon polyps, microsatellite instability and tumor history).
Screening DNA methylation sites for potential prognostic factors
A differential methylation analysis was first performed to identify potential CpGs related to the prognosis of CRC. We obtained 11,236 DMPs (Supplementary Figure 1A). Subsequently, to identify DMPs related to PFI status, a differential methylation analysis was performed in progression and progression-free patients. Ultimately, 222 CpGs were identified as being DMPs that were significantly correlated with progression status.
Next, we aimed to identify progression-status-associated CpGs using high-confidence LASSO and SVM-RFE. First, a LASSO algorithm was used to select 50 CpGs showing significance in the training dataset (Supplementary Figure 1B). Second, we used the SVM-RFE algorithm to identify a set of 50 CpGs (Supplementary Figure 1C). A total of 30 CpGs were duplicated in these CpGs obtained from the two algorithms (Supplementary Figure 1D). We applied the merged CpGs from the two algorithms (70 CpGs) as candidate CpGs in the subsequent step. Third, we used a penalized Cox regression model (LASSO–Cox strategy) to reduce the sample further, to 23 CpGs associated with PFI in patients with CRC (Supplementary Figure 1E). This analysis yielded a final list consisting of 23 CpGs (Supplementary Table 1), which were considered as candidate prognostic factors of CRC and were used to build a risk score to facilitate the investigation of the performance of those CpGs in predicting the progression of CRC (Supplementary Figure 1F).
Building a risk score for predicting the progression of CRC
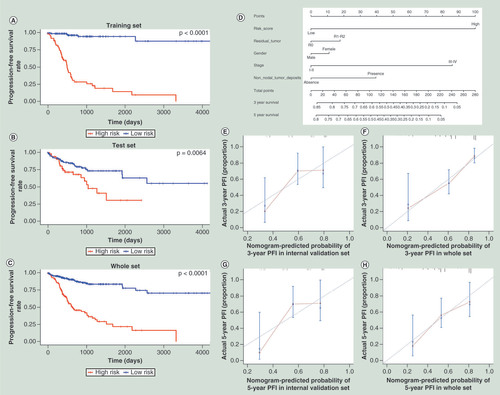
To evaluate the prognostic value of the candidate prognostic CpGs obtained in the step described above, we proposed the use of a risk score as an integrated indicator. Based on the corresponding risk score value, we found that a greater risk score was associated with a worse prognosis. The risk scores of the 189 patients in the training set ranged from -1.819 to 0.743. We segregated patients into a high-risk group and a low-risk group using a cut-off of ≥-0.430; this optimal cut-off value was calculated by the X-tile software. According to the cut-off value, the low-risk group included 127 (67.20%) cases (Supplementary Figure 2). Compared with the patients in the high-risk group, all patients in the low-risk group had a longer PFI (hazard ratio [HR]: 0.102; 95% CI: 0.054–0.192; p < 0.001; ); the Kaplan–Meier curve is shown in –C. DNA methylation can be affected by the age of the patient at the time of diagnosis. We checked the correlation between 23 CpGs/the risk score based on 23 CpGs and the age of the patient, respectively. We found that 5/23 CpGs were associated with the age of the patient (p < 0.05), whereas 18/23 CpGs (p > 0.05) and the risk score based on 23 CpGs (p = 0.68) were not. In addition, we investigated the association between the risk score and the clinical features of the patients, to identify potential confounding effects. We found that sex (p = 0.047), TNM stage (p = 0.002) and microsatellite instability (p = 0.021) were significantly associated with the risk score. Notably, after adjusting for sex, TNM stage and microsatellite instability, the association between the risk score and PFI remained statistically significant (p < 0.001).
HR: Hazard ratio.
(A) The training set; (B) the test set; (C) merged both the training and the test sets. (D) Nomogram to predict the 5- and 3-year PFI. Calibration curve for this nomogram model of predicting the 3-year PFI in (E) test set; (F) whole set and calibration curve for this nomogram model of predicting the 5-year PFI in (G) test set; (H) whole set.
PFI: Progression-free interval.
Validation of the risk score & visualization of predictive models
To verify the stability of the risk score, an additional 188 CRC cases in TCGA dataset, as an internal validation cohort, were used to perform a validation analysis. Patients with a high risk score exhibited an increased risk of progression compared with the low-risk patients (HR: 0.458; 95% CI: 0.258–0.814; p = 0.008). After combining the training and the test cohorts, 262 (69.50%) patients were in the low-risk group and 115 (30.50%) patients were in the high-risk group (HR: 0.288; 95% CI: 0.190–0.437; p < 0.001; ).
Clinical features, such as TNM stage, etc., are commonly used to assess the risk of tumor progression in patients. Therefore, we constructed a nomogram that combined the 23-CpG-based risk score with the clinical risk features (sex, TNM stage, surgical margin residual tumor status and non-nodal tumor deposits) to ascertain how the risk score added prognostic value to the clinicopathological staging system and to provide a comprehensive and quantitative clinical method for predicting the probability of progression in patients with CRC. The nomogram, which combined the risk score with the significant clinical features, was developed to predict the 3- and 5-year PFI using data from 377 cases by combining the training and internal-testing sets (). Moreover, the calibration curve of the nomogram showed good agreement between prediction and observation in the test set and whole set (concordance index: 0.693 for the test set and 0.719 for the whole set; –H).
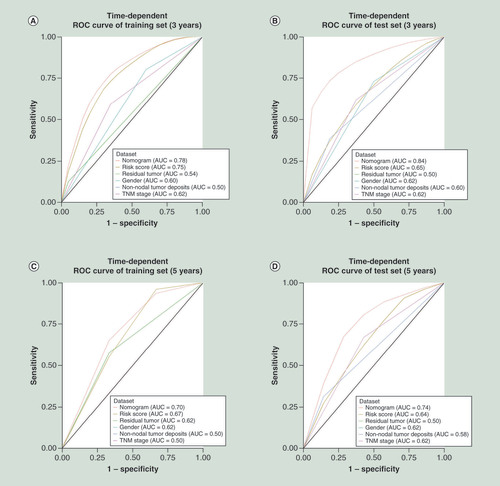
The area under the curves (AUCs) at 3 and 5 years in the nomogram constructed based on risk score in the training set were 0.75 and 0.67, respectively. Considering the clinicopathological risk factors, the AUCs at 3 and 5 years of the nomogram increased to 0.78 and 0.70, respectively. Similarly, the AUCs of the risk score at 3 and 5 years were 0.65 and 0.64, respectively, in the internal validation set; after combination with the clinical risk factors, the AUCs increased to 0.84 and 0.74, respectively (). Furthermore, combining the risk score with the clinical risk features (sex, TNM stage, surgical margin residual tumor status and non-nodal tumor deposits) significantly improved the accuracy of the prediction of tumor progression.
AUC: Area under the curve; ROC: Receiver operating characteristic; TNM: Primary tumor, regional lymph nodes and distant metastases.
Discussion
In this study, we aimed to identify novel DNA methylation markers with prognostic relevance for patients with CRC based on a genome-wide analysis of DNA methylation in tumor tissues. A methylation microarray was used to identify differentially methylated CpG sites between the tumor and normal tissues, as well as between samples with and without disease progression. Moreover, those differential methylation sites were used as a starting point for the study, as reported previously [Citation13–Citation15]. Subsequently, we used two algorithms to select significant CpGs related to PFI and narrowed down the significant candidate CpGs via penalized Cox regression. A total of 23 CpGs were selected and used to build a risk score in the training cohort. The risk score divided the training cohort into high-risk and low-risk progression subgroups. We then validated the risk score in an internal validation cohort. Finally, we combined the risk score and clinical features for a better predicting prognosis for patients with CRC.
We used a methylation microarray to identify the methylation markers, and integrated multiple biomarkers into a single model that would substantially improve prognostic value compared with a single biomarker. In many studies, inappropriate statistical methods were used to mine microarray data. Moreover, the number of covariates is usually close to, or larger than, the number of observations in microarray analyses. During the planning of the survival analysis for modeling covariate information, the Cox proportional hazards regression analysis first occurred to us, as it is the most popular approach; however, is unsuitable for high-dimensional microarray data when the sample-size-to-variable ratio is too low. In addition, this was in contrast to previous studies, which used only one algorithm to select markers, thus potentially missing or ignoring important markers. To overcome these limitations, our study combined two distinct algorithms (SVM-RFE and LASSO) to select markers. In addition, we built a nomogram including the risk score, sex, TNM stage, surgical margin residual tumor status and non-nodal tumor deposits to predict the individual risk of progression of CRC.
Thirteen of the 23 CpGs were located in regions of the RPL39L, PLEKHO1, KIFC3, GUCY1B3, RORA, SYT7, SOX2OT, MYO1B, MOCOS, MCIDAS, SLC9A2, DEFB135, SNHG14 and TRIM31 genes. RPL39L encodes the ribosomal protein L39 like, which shares high sequence similarity with the ribosomal protein L39, thus potentially affecting cancer progression by modulating nitric oxide synthase and the hypoxia signaling pathway [Citation16]. PLEKHO1 (also known as casein kinase-2 interacting protein-1, CKIP-1) acts as a tumor suppressor by suppressing PI3K/Akt/mTOR signaling and enhancing Smurf1 autodegradation [Citation17,Citation18]. KIFC3 encodes a member of the kinesin-14 family of microtubule motors. Members of this family play a role in the formation, maintenance and remodeling of the bipolar mitotic spindle. It has also been reported to be associated with breast cancer cell growth, survival and chemotherapy resistance [Citation19–Citation22]. GUCY1B3 encodes the beta subunit of the soluble guanylate cyclase, which catalyzes the conversion of GTP to cyclic guanosine monophosphate. Soluble guanylyl cyclase–cyclic guanosine monophosphate signaling plays a key role in tumor cell development [Citation23–Citation26]. The protein encoded by RORA is a member of the NR1 subfamily of nuclear hormone receptors and interacts with NM23-1, the product of a tumor metastasis suppressor candidate gene. SYT7 is a member of the synaptotagmin gene family and encodes a protein that is similar to other family members that mediate the calcium-dependent regulation of membrane trafficking in synaptic transmission. Dysregulation of SYT7 will affect the growth and proliferation of various cancer cells [Citation27–Citation29]. SOX2OT can produce alternatively spliced long noncoding RNAs, which are upregulated in tumor cells and positively correlated with the expression of the SRY-box 2 gene. Overexpression of these transcripts may promote cell proliferation. MYO1B, which encodes myosin IB, is associated with the progression of multiple cancers, such as glioma, cervical cancer, prostate cancer, head and neck squamous cell carcinoma and CRC [Citation30–Citation34]. The product of the MCIDAS gene, multiciliate differentiation and DNA synthesis associated cell cycle protein, forms a complex of MCIDAS/E2F/DP1 that activates FOXJ1 and RFX, which are significantly associated with several cancer types [Citation35]. SLC9A2 encodes a member of the sodium–hydrogen exchanger protein family, and aberrant expression of this gene is related to CRC development [Citation36]. SNHG14 is located within the Prader–Willi critical region and produces a long, spliced and paternally-imprinted RNA that initiates within a common upstream promoter region shared by the small nuclear ribonucleoprotein polypeptide N and SNURF genes. The current study showed that SNHG14 may facilitate CRC metastasis [Citation37]. TRIM31 encodes a protein that functions as an E3 ubiquitin–protein ligase and an intestine-specific protein localized in mitochondria [Citation38] and may regulate chronic inflammation via the NF-κB signaling pathway, to promote invasion and metastasis in CRC [Citation39]. To our knowledge, no studies have investigated the association between the MOCOS and DEFB135 genes and cancers.
The limitations of our study should be noted. First, we did not validate these CpG sites and genes using functional experiments. Second, models were not validated in multiple independent cohorts. Third, additional clinical risk features were not considered because of clinical information limitations in TCGA.
Conclusion
Distant metastases and other progression events are common and mortal in CRC patients. A lot of researches showed DNA methylation plays an important role in carcinogenesis in CRC. In our study, we used two machine learning algorithms to identify significant CpGs related to prognosis in CRC and built a risk score to predict it. The risk score achieved high predictive ability and complemented the existing staging system for helping predict individual progression risk of CRC.
Future perspective
The risk score we built may help clinicians manage patients and enable more informed treatment decisions. We will validate the candidate CpGs by an independent dataset and functional experiments in the future. Whether the risk score based on 23 CpGs can be used as a biomarker for the prognosis of CRC, this should be done in a large number of samples. Furthermore, translation of the risk score into clinical application remains challenging and should be validated through large-scale prospective cohorts and randomized clinical trials.
Genome-wide DNA methylation analysis profiled candidate epigenetic CpGs associated with the prognosis of colorectal cancer (CRC).
Two machine learning algorithms were used to select target CpGs associated with the progression of CRC in patients.
A total of 222 CpGs were identified as significant probes related to CRC progression.
Penalized Cox regression selected 23 CpGs as markers and developed a risk score based on the CpGs to classify and predict the risk of progression in the patients with CRC.
The predictive capability of the risk score was well validated in the other two groups (p = 0.008 in the internal validation set, p < 0.001 in the whole set).
The majority of genes in which the 23 CpGs were located contribute to the development and progression of cancer.
Our study found that several clinical features, such as sex, stage, surgical margin residual tumor status and non-nodal tumor deposits, were associated with the progression-free interval of CRC. However, the predictive capability of the clinical features was limited.
The risk score supplemented the current risk classification system. We found that the model that combined the clinical features and the risk score may predict better the prognosis of CRC.
Financial & competing interests disclosure
The authors have no relevant affiliations or financial involvement with any organization or entity with a financial interest in or financial conflict with the subject matter or materials discussed in the manuscript. This includes employment, consultancies, honoraria, stock ownership or options, expert testimony, grants or patents received or pending or royalties.
Writing assistance was utilized in the production of this manuscript from Enago, funded by the authors.
References
- Bray F , FerlayJ , SoerjomataramI , SiegelRL , TorreLA , JemalA. Global cancer statistics 2018: GLOBOCAN estimates of incidence and mortality worldwide for 36 cancers in 185 countries. CA Cancer J. Clin.68(6), 394–424 (2018).
- Russell AH , TongD , DawsonLE , WisbeckW. Adenocarcinoma of the proximal colon. Sites of initial dissemination and patterns of recurrence following surgery alone. Cancer53(2), 360–367 (1984).
- Breugom AJ , SwetsM , BossetJFet al. Adjuvant chemotherapy after preoperative (chemo)radiotherapy and surgery for patients with rectal cancer: a systematic review and meta-analysis of individual patient data. Lancet Oncol.16(2), 200–207 (2015).
- Honore C , GelliM , FrancoualJ , BenhaimL , EliasD , GoereD. Ninety percent of the adverse outcomes occur in 10% of patients: can we identify the populations at high risk of developing peritoneal metastases after curative surgery for colorectal cancer?Int. J. Hyperthermia33(5), 505–510 (2017).
- Carethers JM , JungBH. Genetics and genetic biomarkers in sporadic colorectal cancer. Gastroenterology149(5), 1177–1190 (2015).
- Okugawa Y , GradyWM , GoelA. Epigenetic alterations in colorectal cancer: emerging biomarkers. Gastroenterology149(5), 1204–1225 (2015).
- Goelz SE , VogelsteinB , HamiltonSR , FeinbergAP. Hypomethylation of DNA from benign and malignant human colon neoplasms. Science228(4696), 187–190 (1985).
- Chang E , ParkDI , KimYJet al. Detection of colorectal neoplasm using promoter methylation of ITGA4, SFRP2, and p16 in stool samples: a preliminary report in Korean patients. Hepatogastroenterology57(101), 720–727 (2010).
- Li X , YaoX , WangYet al. MLH1 promoter methylation frequency in colorectal cancer patients and related clinicopathological and molecular features. PLoS ONE8(3), e59064 (2013).
- Ng JM , YuJ. Promoter hypermethylation of tumor suppressor genes as potential biomarkers in colorectal cancer. Int. J. Mol. Sci.16(2), 2472–2496 (2015).
- Lyberopoulou A , GalanopoulosM , AravantinosGet al. Identification of methylation profiles of cancer-related genes in circulating tumor cells population. Anticancer Res.37(3), 1105–1112 (2017).
- Liu JF , LichtenbergT , HoadleyKAet al. An integrated TCGA pan-cancer clinical data resource to drive high-quality survival outcome analytics. Cell173(2), 400–416 (2018).
- Wei JH , HaddadA , WuKJet al. A CpG-methylation-based assay to predict survival in clear cell renal cell carcinoma. Nat. Commun.6, 8699 (2015).
- Gu S , LinS , YeDet al. Genome-wide methylation profiling identified novel differentially hypermethylated biomarker MPPED2 in colorectal cancer. Clin. Epigenetics11(1), 41 (2019).
- Gundert M , EdelmannD , BennerAet al. Genome-wide DNA methylation analysis reveals a prognostic classifier for non-metastatic colorectal cancer (ProMCol classifier). Gut68(1), 101–110 (2019).
- Dave B , Granados-PrincipalS , ZhuRet al. Targeting RPL39 and MLF2 reduces tumor initiation and metastasis in breast cancer by inhibiting nitric oxide synthase signaling. Proc. Natl Acad. Sci. USA111(24), 8838–8843 (2014).
- Tokuda E , FujitaN , Oh-HaraTet al. Casein kinase 2-interacting protein-1, a novel Akt pleckstrin homology domain-interacting protein, down-regulates PI3K/Akt signaling and suppresses tumor growth in vivo. Cancer Res.67(20), 9666–9676 (2007).
- Nie J , LiuL , XingGet al. CKIP-1 acts as a colonic tumor suppressor by repressing oncogenic Smurf1 synthesis and promoting Smurf1 autodegradation. Oncogene33(28), 3677–3687 (2014).
- De S , CiprianoR , JacksonMW , StarkGR. Overexpression of kinesins mediates docetaxel resistance in breast cancer cells. Cancer Res.69(20), 8035–8042 (2009).
- Chang H , JeungHC , JungJJ , KimTS , RhaSY , ChungHC. Identification of genes associated with chemosensitivity to SAHA/taxane combination treatment in taxane-resistant breast cancer cells. Breast Cancer Res. Treat.125(1), 55–63 (2011).
- Tan MH , DeS , BebekGet al. Specific kinesin expression profiles associated with taxane resistance in basal-like breast cancer. Breast Cancer Res. Treat.131(3), 849–858 (2012).
- Zou JX , DuanZ , WangJet al. Kinesin family deregulation coordinated by bromodomain protein ANCCA and histone methyltransferase MLL for breast cancer cell growth, survival, and tamoxifen resistance. Mol. Cancer Res.12(4), 539–549 (2014).
- Saino M , MaruyamaT , SekiyaT , KayamaT , MurakamiY. Inhibition of angiogenesis in human glioma cell lines by antisense RNA from the soluble guanylate cyclase genes, GUCY1A3 and GUCY1B3. Oncol. Rep.12(1), 47–52 (2004).
- Deguchi A , ThompsonWJ , WeinsteinIB. Activation of protein kinase G is sufficient to induce apoptosis and inhibit cell migration in colon cancer cells. Cancer Res.64(11), 3966–3973 (2004).
- Cook T , WangZ , AlberSet al. Nitric oxide and ionizing radiation synergistically promote apoptosis and growth inhibition of cancer by activating p53. Cancer Res.64(21), 8015–8021 (2004).
- Mujoo K , SharinVG , MartinEet al. Role of soluble guanylyl cyclase-cyclic GMP signaling in tumor cell proliferation. Nitric Oxide22(1), 43–50 (2010).
- Xiao B , LiJB , FanYHet al. Downregulation of SYT7 inhibits glioblastoma growth by promoting cellular apoptosis. Mol. Med. Rep.16(6), 9017–9022 (2017).
- Wang K , XiaoH , ZhangJ , ZhuD. Synaptotagmin7 is overexpressed in colorectal cancer and regulates colorectal cancer cell proliferation. J. Cancer9(13), 2349–2356 (2018).
- Kanda M , TanakaH , ShimizuDet al. SYT7 acts as a driver of hepatic metastasis formation of gastric cancer cells. Oncogene37(39), 5355–5366 (2018).
- Farkas SA , VymetalkovaV , VodickovaL , VodickaP , NilssonTK. DNA methylation changes in genes frequently mutated in sporadic colorectal cancer and in the DNA repair and Wnt/beta-catenin signaling pathway genes. Epigenomics6(2), 179–191 (2014).
- Makowska KA , HughesRE , WhiteKJ , WellsCM , PeckhamM. Specific myosins control actin organization, cell morphology, and migration in prostate cancer cells. Cell Rep.13(10), 2118–2125 (2015).
- Ohmura G , TsujikawaT , YaguchiTet al. Aberrant myosin 1b expression promotes cell migration and lymph node metastasis of HNSCC. Mol. Cancer Res.13(4), 721–731 (2015).
- Zhang HR , LaiSY , HuangLJet al. Myosin 1b promotes cell proliferation, migration, and invasion in cervical cancer. Gynecol. Oncol.149(1), 188–197 (2018).
- Zhou XX , WangR , LiXBet al. Splicing factor SRSF1 promotes gliomagenesis via oncogenic splice-switching of MYO1B. J. Clin. Invest.129(2), 676–693 (2019).
- Walentek P . Ciliary transcription factors in cancer--how understanding ciliogenesis can promote the detection and prognosis of cancer types. J. Pathol.239(1), 6–9 (2016).
- Drew JE , FarquharsonAJ , MayerCDet al. Predictive gene signatures: molecular markers distinguishing colon adenomatous polyp and carcinoma. PLoS ONE9(11), e113071 (2014).
- Di W , WeinanX , XinLet al. Long noncoding RNA SNHG14 facilitates colorectal cancer metastasis through targeting EZH2-regulated EPHA7. Cell Death Dis.10(7), 514 (2019).
- Ra EA , LeeTA , WonKim Set al. TRIM31 promotes Atg5/Atg7-independent autophagy in intestinal cells. Nat. Commun.7, 11726 (2016).
- Wang H , YaoL , GongY , ZhangB. TRIM31 regulates chronic inflammation via NF-kappaB signal pathway to promote invasion and metastasis in colorectal cancer. Am. J. Transl. Res.10(4), 1247–1259 (2018).