
Abstract
Aim: Prostate cancer (PCa) is the most common malignancy found in males worldwide. Although it is mostly indolent, PCa still poses a serious threat to long-term health. Materials&methods: The Cancer Genome Atlas data were randomly divided into training and validation groups. Least absolute shrinkage and selection operator regression on DNA methylation data in the training group was conducted to build the model, which was validated in the validation group. Weighted correlation network analysis was conducted on RNA-seq data to identify the therapy target. Functional validation (western blot, quantitative real-time PCR, cell transfection, Cell Counting Kit-8 assay, colony formation assay, wound healing assay and transwell invasion assay) for the target was conducted. Results: The model is an independent predictor of prognosis. The knockdown of FOXD1 inhibits cell proliferation, migration and invasion of PCa. Conclusion: The risk of patients could be evaluated by the model, which revealed that FOXD1 might promote poor prognosis.
Prostate cancer (PCa) is the most common cancer found in men and it ranks second among the highest causes of cancer-related deaths in males in the USA, the first being lung cancer [Citation1]. With the availability of prostate-specific antigen screening, the majority of PCa patients can detect localized PCa in the early stage of the disease. PCa is a highly heterogeneous disease in nature and can progress from indolent and organ confined to aggressive and metastatic. Although it is mostly indolent, PCa still threatens long-term health [Citation2,Citation3]. Some patients with indolent PCa have a slower disease progression and show a better prognosis for treatments. However, others have more aggressive forms of PCa that present with severe clinical symptoms and poor prognosis for treatment that can eventually lead to relapse or even death [Citation4]. Currently, clinicians mainly use the pathological Gleason score, preoperative prostate-specific antigen and clinical stages to assess the risk of PCa in patients and guide clinical treatment [Citation5]. However, these clinicopathological variables have not demonstrated specificity or sensitivity in predicting the prognosis of PCa patients [Citation6]. Therefore, it is essential to develop a new risk assessment system that can effectively predict the prognosis of PCa patients. Based on this risk assessment system, we can then explore new therapeutic targets.
Proper DNA methylation is indispensable during normal development. However, due to its role in the regulation of genomic transcription, abnormal methylation patterns can also cause a variety of diseases, including cancer [Citation7]. Many studies have shown that abnormal DNA methylation is related to irregular gene silencing, which happens when there are high levels of 5-methylcytosine in the promoter region [Citation8]. Hypomethylation in cancer can lead to genomic instability that activates silenced oncogenes. For example, hypomethylation of SAT2 and SAT-α genes promote the development of breast and ovarian cancer [Citation9]. Interestingly, some tumor-suppressor genes can be activated by DNA hypermethylation [Citation10]. Moreover, other studies have found that abnormal de novo DNA methylation also plays a role in tumorigenesis. The expression of some genes in normal progenitor cells is inhibited by a repressive complex, and these genes are activated by removal of the repressor during differentiation into the mature cell type. However, if these genes become de novo methylated, they will not be activated, which prevents cells from differentiating further and they remain proliferative [Citation11]. Due to the relatively stable nature of DNA molecules and the extensive distribution of DNA methylation in the genome, DNA methylation markers play an essential role in the diagnosis and prediction of diseases [Citation12]. DNA methylation has been shown to have great potential in predicting several human phenomena, including postpartum depression, response to treatmenttanu, age, tumor grade and tumor prognosis [Citation12].
In this study, we successfully generated a risk prediction model with six CpG sites through machine learning. We then thought that by stratifying the risk of patients and their gene expression characteristics, we could find therapeutic targets associated with an increased risk of PCa, thus more effectively treating and preventing poor prognosis in high-risk patients. After a series of analysis and verification, FOXD1 was selected as the target to develop therapies for patients with a poor prognosis.
Materials&methods
Data acquisition&processing
In this study, we used data from The Cancer Genome Atlas (TCGA) database (https://portal.gdc.cancer.gov/), which is a landmark cancer genomics program that has molecularly characterized over 20,000 primary cancers and matched normal samples spanning 33 cancer types. DNA methylation, RNA-seq and clinical data from PCa patients were obtained. DNA methylation data were selected based on the Illumina human methylation 450 platform, and a total of 485,577 CpG sites were annotated. Among the 485,577 CpG sites, only 410,260 CpG sites had information about their associated genes. Therefore, these 410,260 CpG sites were selected for analysis. The RNA-seq data were selected in the form of HTSeq-Counts. A total of 60,483 genes were included in the RNA-seq data. We extracted 19,463 protein-coding genes from 60,483 genes using gene annotations from the Ensembl database (http://asia.ensembl.org/index.html). Based on the PCa patient clinical information obtained, we set the criteria for inclusion: Patients undergoing radical prostatectomy were selected. The included patients received no other treatment (radiotherapy, chemotherapy, drug therapy, endocrine therapy and so on) before or after the surgery. Patients who died from noncancer-related events were excluded. Patients with incomplete survival data were excluded. Finally, a total of 201 PCa patients were enrolled in this study ().
Table 1. The clinicopathologic variables of patients with prostate cancer included in the study.
CpG sites for the risk prediction model
There was a total of 543 samples in our DNA methylation data. According to the description of the TCGA barcodes of each sample on the TCGA database (http://docs.gdc.cancer.gov/Encyclopedia/pages/TCGA_Barcode/), there were 50 normal samples and 493 tumor samples among these 543 samples (Supplementary Table 1). The Mann–Whitney U test was used to analyze the difference in CpG site β values between the normal and tumor samples. We used the false-discovery rate to adjust the p-values obtained by the Mann–Whitney U test. CpG sites with adjusted p < 0.05 and absolute value of the logarithmic fold changes (|LFCs|) >2 were defined as differentially methylated [Citation13]. According to the clinical information of the 201 patients included in the study, we used cancer-specific death or biochemical recurrence as the outcomes to represent the prognosis of PCa patients. Survival analysis was then performed on these CpG sites differentially methylated through COX regression and log-rank tests by the survival R package [Citation14]. COX regression is method for investigating the effect of several variables upon the time a specified event takes to happen.
We believe that CpG sites with p < 0.05 in the COX regression and log-rank test are correlated with survival prognosis [Citation15]. Finally, CpG sites that met the criteria described above were employed to train the model by least absolute shrinkage and selection operator (LASSO) regression.
Generation of the risk prediction model
Based on the characteristics of variable selection and regularization, while fitting the generalized linear model, LASSO regression was conducted to construct a model for predicting the prognosis of patients with high performance [Citation16,Citation17]. This method is popular in machine learning and implemented through the glmnet R package [Citation18,Citation19]. To verify the effects of the model after training it, we randomly divided the 201 patients into the training group and the validation group through the caret R package in R 3.5.2. According to the caret package description, this grouping ensures that there is no correlation between the distribution states of the two groups [Citation20]. Patients in the training group and validation group are shown in Supplementary Tables 2A and B, respectively. Univariate survival analysis of the CpG sites in the model was conducted by COX regression to provide more details of the risk prediction model. The risk scores of each patient within both training and validation groups were calculated through the prediction formula of the risk prediction model. We calculated the cut-off value used to determine whether the patient is at high or low risk. Within the training group, the cut-off value was obtained by the receiver operating characteristic curve (ROC) analysis of a 5-year survival rate with the help of the survivalROC R package in R 3.5.2 [Citation21].
Verification of the validity of the risk prediction model
Within the training group, a time-dependent receiver operating characteristic (tdROC) curve analysis was first applied to evaluate the predictive accuracy of the model for cancer-specific death or biochemical recurrence based on the risk scores, with the help of the survivalROC R package in R 3.5.2 [Citation22]. Survival analysis of the two groups was then performed using the COX regression and log-rank test with the survival R package in R 3.5.2 [Citation21]. The survminer R package was used to plot the survival curve by the Kaplan–Meier method. We then integrated the training group and the validation group and conducted a survival analysis on a total of 201 patients based on the model. To investigate the correlation between risk based on the model and clinicopathologic variables associated with prognosis of PCa, we used the Mann–Whitney U test, χ2 test or Fisher’s exact test to analyze the correlation between clinicopathologic variables and risk status in the 201 patients. Unfortunately, the information of tumor, node, metastasis (TNM) (M) was not recorded in M1, so we could not analyze TNM (M) in this study.
Univariate&multivariate COX regression for clinical variables&the risk prediction model
To assess whether the risk prediction model could be used as an independent prognostic indicator for PCa patients, univariate COX regression based on survival data were first performed on 201 patients [Citation23,Citation24]. p < 0.05 was defined as statistically significant. We determined the clinical variables that were statistically significant in following the univariate COX regression. According to the general rule of multivariable analysis, avoiding the number of variables was too many for the number of events and resulted in overfitting of a multivariable model, therefore these selected clinical variables were analyzed by multivariate COX regression. We then performed a multivariate time-dependent receiver operating characteristic (multi-tdROC) curve analysis on the independent prognostic variables from the univariate and multivariate COX regression using the timeROC R package in R 3.5.2 [Citation25].
RNA-seq data were analyzed by weighted correlation network analysis
After demonstrating the effectiveness of the model in predicting the prognosis of patients, we wanted to classify PCa patients through the model to explore hub genes related to patient risks for treatment. The RNA-seq data downloaded from the TCGA database was analyzed by the DESeq2 R package in R 3.5.2 [Citation26] and differentially expressed genes (DEGs) between tumor and normal samples were selected (|LFC| >1 and adjusted p < 0.05) for the weighted correlation network analysis (WGCNA). To keep the gene network close to the scale-free topology and maintain sufficient connectivity, we filtered out four as the best soft power threshold by the WGCNA R package [Citation27]. The other parameters are set as follows: minModuleSize = 30, and mergeCutHeight = 0.25 [Citation28]. We selected a gene module that was most positively correlated with the risk prediction model, and we termed this gene module the key module. Regarding genes in the gene modules, there are two types of connectivity measures in WGCNA [Citation29]. One is kMEi = cor(xi, ME), which is termed gene significance (GS) based on correlating each gene with the respective module eigengene. The other is kIN, which is termed module membership (MM) and represents a sum of adjacencies with respect to the module genes.
Enrichment analysis of the candidate hub genes in Metascape
Metascape (http://metascape.org/gp/index.html#/main/step1) is an online interactive website that helps biologists perform functional enrichment analyses on specific gene sets [Citation30]. We first introduced the 123 candidate hub genes into Metascape and identified all statistically enriched terms. The remaining significant terms were then hierarchically clustered into a tree based on κ-statistical similarities among their gene memberships. We used a 0.3 κ score as the threshold to organize the tree into term clusters.
Identification of the target gene
We first identified genes that were enriched in the key clusters. Furthermore, the ‘ggstatsplot’ R package was used for Spearman correlation analyses between the MM and GS values of the 123 candidate hub genes. Under the screening condition that MM and GS were larger than their mean, the number of the 123 candidate hub genes was reduced, and the number was further reduced by intersections with genes in the key clusters. We inputted the retained candidate core genes into the Gene Expression Profiling Interactive Analysis (GEPIA) (http://gepia.cancer-pku.cn/) database, which jointly analyzed data from TCGA and Genotype-Tissue Expression (GTEx) databses, and tested whether there was any difference in the expression of these candidate hub genes between tumor and normal samples. GEPIA is an interactive website application that recruited the transcriptome data in TCGA and GTEx projects and analyzed them in a widely accepted process [Citation31]. The GTEx database provides correlations between genotype and tissue-specific gene expression levels [Citation32,Citation33]. The TCGA project consists of a large number of tumor samples and relatively less normal samples. For the sake of balance between quantities of the tumor and normal samples, we verified hub gene expression levels by the TCGA and GTEx data in the GEPIA database. Candidate hub genes meeting all the above conditions were selected as hub genes. Through GEPIA, we explored the gene expression profile of hub genes, which have not been studied in the treatment of PCa [Citation31].
Cell culture&transfection
Human PCa cell lines LNCaP, DU145, PC-3, 22RV1 and normal human prostate cell line WPMY-1 were obtained from the Cell Bank of the Chinese Academy of Sciences (Shanghai, China). The cell lines were cultured in Roswell Park Memorial Institute (RPMI)-1640 medium and incubated at 37°C with 5% CO2. FBS (10%) was contained in the culture media.
FOXD1 shRNA (FOXD1-shRNA: 5′-GTCGAGAACTTTACTGCTAGG-3′) was designed and synthesized by GenePharma (Shanghai, China). The sequences of FOXD1-shRNA were inserted into a recombinational lentiviral pHBLV-U6-ZsGreen-puro vector obtained from Hanbio Biotechnology Co. Ltd. (Shanghai, China). The FOXD1-shRNA treatment group was called sh-FOXD1, the negative control group was called sh-control and the blank control group was called control.
RNA extraction&quantitative real-time PCR
Total RNA isolation and quantitative real-time PCR (qRT-PCR) procedures were performed as previously described [Citation34]. The primers sequences of FOXD1 and GAPDH were shown in Supplementary Table 4 (Sangon Biotech Ltd., Shanghai, China). GAPDH was used as an internal control in this study. Relative expression of FOXD1 was calculated using the 2−△△Ct method.
Western blot
We extracted the total protein from the cell lines used in the study. An equal amount of protein (30 µg) was added to per lane and separated by 10% SDS-PAGE. The protein of FOXD1 and GAPDH was detected by their corresponding primary antibodies: FOXD1 (1:500; Santa Cruz Biotechnology, Heidelberg, Germany), GAPDH (1:10,000; Proteintech, Wuhan, China). The expression of GAPDH was used as internal reference. The specific operation process was as described earlier [Citation35].
Cell proliferation assays
We performed the cell proliferation assays using the Cell Counting Kit-8 (CCK-8; Dojindo Molecular Technologies, Japan) and the colony formation assay. During the CCK-8, the cells were cultured in a 96-well plate (5000 cells/well) for 24 and 48 h. When cells attached to the well surface, 10 μl CCK-8 solution was added into each well and incubated for another 2 h at 37°C in 5% CO2. The optical density was measured at 450 nm by microplate spectrophotometer.
Then we conducted the colony formation assay. Cells received different treatments were seeded into the six-well plate (1000Â cells/well) and cultured for 10Â days. Then colonies were fixed with 4% paraformaldehyde and stained with crystal violet.
Wound healing assay
Cells were seeded in the six-well plate and cultured to about 85% density. A straight wound was created manually with a sterile 200 μl plastic pipette tip. The wells were washed with phosphate-buffered saline three-times. Then, 3 ml serum-free medium were added into each well for 24 h. The cell migration areas were recorded by microscope.
Transwell invasion assay
Cultured in serum-free RPMI 1640, about 1 × 105 cells were seeded into each transwell upper chamber (8-μm; Guangzhou Jet Bio-Filtration Co., Ltd., China), which was predealed with Corning Matrigel® (356243). The bottom wells were filled with 600 μl RPMI 1640 containing 30% FBS. After incubation for 24 h, the cells which did not pass through membrane were gently wiped. Then the cells on the membrane were fixed with 4% paraformaldehyde and stained with crystal violet solution. Five random fields were counted in each well.
Statistical analyses
All statistical analyses were performed by the R software (R version 3.5.2). During the analysis of functional validation, two-tailed Student’s t-test or one-way ANOVA test were used for statistical comparisons between different groups. p <0.05 was defined as statistically different and all the experiments were repeated three-times at least.
Results
CpG sites for the risk prediction model
The Mann–Whitney U test was performed on the 410260 CpG sites, having the information about their associated genes, by comparing 493 tumor samples and 50 normal samples. This revealed 2872 CpG sites that were found to be differentially methylated, which were selected for survival analysis. Among these 2872 CpG sites, 120 CpG sites were obtained from the COX regression and log-rank test, associated with the survival prognosis. Finally, these 120 CpG sites were selected to train the model by LASSO regression.
Generation of the risk prediction model
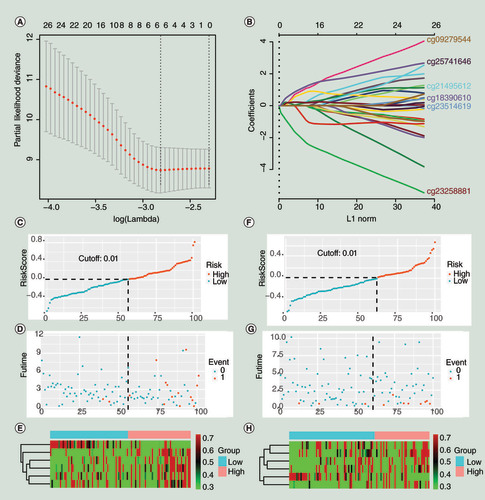
A model that consisted of six CpG sites was eventually generated (&B), and the details of each CpG site in the model are shown in . As shown in the , cg09279544, cg18390610, cg25741646, cg21495612 and cg23514619 promoted the risk of a poor prognosis. The CpG site cg23258881 exhibited a protective effect on prognosis. Risk scores for every patient in the study were the sum of the product of loci β values and the risk coefficient in the risk prediction model. The calculation formula was as follows: Risk scores = 0.304 * cg09279544 + 0.230 * cg18390610 + 0.649 * cg25741646 + 0.147 * cg21495612 + 0.196 * cg23514619 - 1.206 * cg23258881. Based on the ROC curve analysis of the 5-year survival rate for the training group, a cut-off value of 0.01 was obtained, and we used this value in all subsequent studies as a criterion to determine whether the risk of the patient is high or low. In the training and validation groups, the distribution of the survival data and risk values for each patient, as well as the heat maps of the six CpG sites, are shown in –H [Citation36]. Encouragingly, it was observed in &G that most patients with cancer-specific deaths or biochemical recurrences had a risk score greater than 0.01. This phenomenon well supported the performance of the risk prediction model, indicating that the probability of poor prognosis would increase when the individual’s risk score in the model is greater than 0.01.
Table 2. The details of the six CpG sites in the prediction model.
(A) The minimum misclassification error was obtained by cross-validation. (B) Based on the minimum of misclassification error, the inclusion sites and their coefficients of the model were obtained. (C–E). The training group. (F–H) The validation group. (C&F) The distribution of population risk scores and risk classification based on the cut-off value. The population was divided into high-risk and low-risk groups. (D & G) The relationship between the survival outcome of patients and the cut-off value. They indicated that the probability of poor prognosis would increase when the individual’s risk score in the model was greater than 0.01. (E & H) Heat maps for six CpG sites in the model. The expression patterns of six CpG sites were different between the low-risk group and the high-risk group. 0 represents disease free, and 1 represents cancer-specific death or biochemical recurrence.
Verification of the validity of the risk prediction model
TdROC curves for the training group in 3, 5 and 7 years are shown in . The area under curves (AUCs) were equal to 0.823 at 3 years, 0.844 at 5 years and 0.891 at 7 years. The results showed that the model we constructed exhibited good classifier performance. The results of the survival analysis are shown in –D in the form of the Kaplan–Meier curve [Citation37]. The risk scores based on the risk prediction model were associated with prognosis in all groups, and the higher the risk score, the worse the prognosis. In the training group, the p-value of the log-rank test was less than 0.001, and the p-value of the COX regression was less than 0.001, with an HR of 18 (95% CI: 4.2–76). In the validation group, the p-value of the log-rank test was 0.026, and the p-value of the COX regression was 0.016, with an HR of 13 (95% CI: 1.6–100). In all 201 patients, the p-value of the log-rank test less than 0.001, and the p-value of the COX regression was less than 0.001, with an HR of 19 (95% CI: 6–62). The correlation between clinicopathologic variables and risk status in the 201 patients are shown in . For categorical variables, the χ2 test or Fisher’s exact test was applied. For continuous variables, the Mann–Whitney U test was applied. According to the results in , pathological Gleason score (p = 0.009), TNM (T) (p = 0.009), cancer-specific death or biochemical recurrence (p < 0.001) were correlated with the risk of the prediction model. These results further supported the predictive effect of the model for the prognosis of patients.
(A) The receiver operating characteristic curve for the training group (3, 5 and 7 years). (B–D) Kaplan–Meier curve for survival analysis. (B) The curve for the training group. (C) The curve for the validation group. (D) The curve for the total 201 patients (the 201 patients were randomly divided into the training and validation groups in this study).
AUC: Area under curve; TP: True positive.
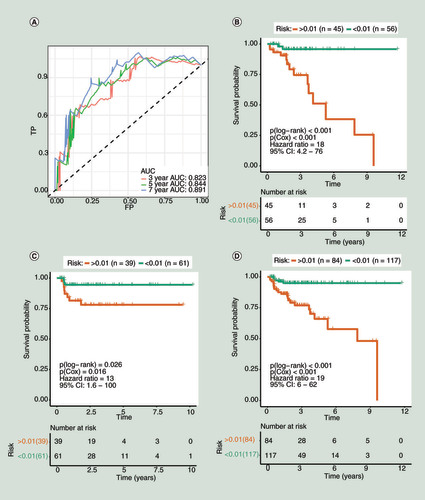
Table 3. The association between methylation status (risk) and clinicopathologic variables of prostate cancer.
Univariate&multivariate COX regression for clinical variables&the risk prediction model
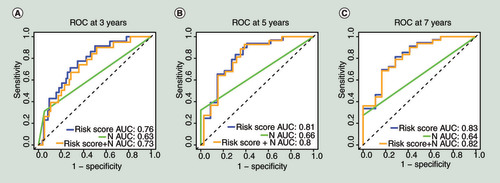
To determine whether our model is an independent predictor of prognosis, we conducted univariate and multivariate COX regression for the risk scores and clinicopathological variables of the 201 patients. The detailed clinicopathological information about the 201 patients is shown in Supplementary Table 3. As shown in , univariate COX regression indicated that the risk prediction model (HR: 19.00; 95% CI: 6.00–62.00, p < 0.001), pathological Gleason score (HR: 1.90; 95% CI: 1.30–2.90, p = 0.002), TNM (T) (HR: 4.10, 95% CI: 1.90–8.60, p < 0.001) and TNM (N) (HR: 6.20, 95% CI: 2.50–16.00, p < 0.001) were risk factors for patient prognosis. According to the general rule of multivariable analysis, to avoid the number of variables was too many for the number of events, resulting in overfitting of a multivariable model, these four variables from univariate COX regression were analyzed by multivariate COX regression. The multivariate COX regression revealed that the risk prediction model (HR: 10.30, 95% CI: 2.43–43.30, p = 0.002) and TNM (N) (HR: 3.70, 95% CI: 1.43–9.50, p = 0.007) were associated with prognosis. These results suggested that our model and TNM (N) can be used as independent prognostic indicators in patients with PCa. Multi-tdROC curves for the 201 patients in 3, 5 and 7 years are shown in . For the risk prediction model, the AUCs were equal to 0.76 at 3 years, 0.81 at 5 years and 0.83 at 7 years. For TNM (N), the AUCs were equal to 0.63 at 3 years, 0.66 at 5 years and 0.64 at 7 years. For the combination of the model and TNM (N), the AUCs were equal to 0.73 at 3 years, 0.80 at 5 years and 0.82 at 7 years. Of note, the risk prediction model had a better classifier effect than TNM (N), and when they were combined, the effect of the classifier is not further improved, which supports that the model can be used to predict prognosis alone.
Table 4. Univariate and multivariate COX regression for clinical variables and the risk prediction model.
(A) The multivariate time-dependent receiver operating characteristic curve (multi-tdROC)Â at 3Â years. (B) The multi-tdROC curve at 5Â years. (C)Â The multi-tdROC curve at 7Â years.
AUC: Area under curves;Â N: TNM (N);Â ROC: Receiver operating characteristic.
The key genetic module associated with the risk prediction model through WGCNA
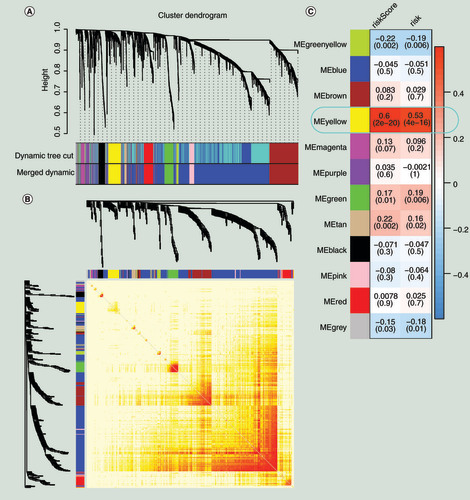
We extracted protein-coding genes from the RNA-seq data and performed differential analysis. According to the screening conditions of adjusted p < 0.05 and |LFCs| >1, we obtained 2976 DEGs between tumor and normal samples. These 2976 DEGs were also used as the input for WGCNA to discover that the genetic coexpression modules positively correlated with the risk prediction module [Citation38]. Topological overlap measure was employed as proximity during WGCNA [Citation39,Citation40]. As shown in , based on the topological overlap measure between genes, these 2976 DEGs were divided into 12 meaningful modules, and the yellow module showed the highest correlation with the risk prediction model (for risk score, Pearson correlation coefficient = 0.6, p < 0.001 and for the risk, Pearson correlation coefficient = 0.53, p < 0.001). There were 180 genes in the yellow module that are shown in Supplementary Table 5. We selected 123 genes from the key module under the conditions of MM > 0, GS > 0 and p < 0.05. We classified these 123 genes as the candidate hub genes.
(A) Gene modules divided by weighted correlation network analysis. (B) The heatmap for the topological overlap measure adjacent matrix. The darker the color, the higher the genetic similarity. (C) Identification of the key module.
Enrichment analysis of the candidate hub genes in Metascape
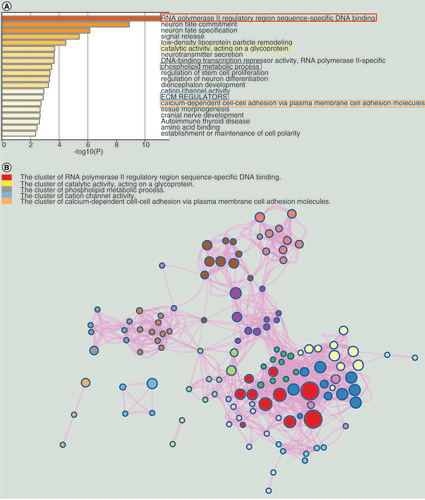
We selected the top 20 terms in the functional enrichment results, shown in . Based on the literature, RNA polymerase II regulatory region sequence-specific DNA binding (GO:0000977), catalytic activity acting on a glycoprotein (GO:0140103), phospholipids and metabolic processes (GO:0006644), NABA ECM REGULATORS (M3468) and calcium-dependent cell–cell adhesion via plasma cell adhesion molecules (GO:0016339) are the five terms associated with the biological mechanisms of PCa [Citation41–44]. Therefore, we were very interested in the genes in these five terms. According to the data processing method described on Metascape, terms with a similarity score >0.3 are linked by an edge, forming a clusters network (). In this network, each term is represented by a circle node, where its size is proportional to the number of input genes that fall into that term, and its color represents its cluster identity. Due to the similarity of terms in the same cluster, we selected the clusters containing the previous five terms and named them as key clusters.
(A) The top 20 enrichment terms. (B) The network of the enrichment terms.
Identification of the target gene
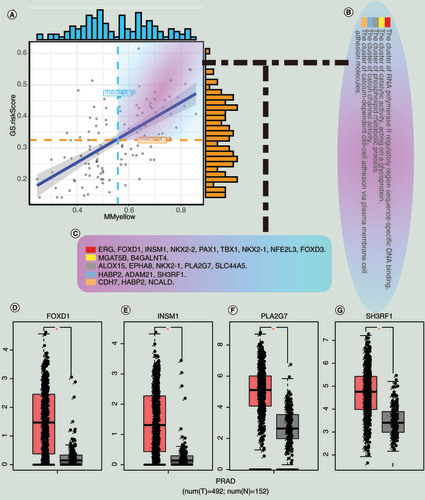
The relationship between MM (mean = 0.56) and GS (mean = 0.32) for the 123 candidate hub genes are shown in , and genes larger than the mean of both MM and GS were selected. We then intersected these genes with genes in the key clusters and obtained 22 candidate hub genes that are shown in &C. The 22 genes were analyzed in the GEPIA database under the condition that |LFC| > 2 and q value < 0.05. Finally, four hub genes (FOXD1, INSM1, PLA2G7 and SH3RF1) were screened and are shown in –G. Of the four hub genes, FOXD1 and INSM1 have not been explored by other studies for their role in the treatment of PCa. The gene expression profile of them across all tumor samples and paired normal tissues were shown in the Supplementary Figure 1–4. We found that FOXD1 was highly expressed in more cancers than INSM1.
(A) Correlation between MM and GS for the risk scores and the yellow module. (B) The enrichment clusters related to PCa. (C) The candidate hub genes. (D) The expression of hub genes between normal and tumor samples in the Gene Expression Profiling Interactive Analysis database.
GS: Gene significance;Â MM: Module membership; N: Normal sample; PCa and PRAD: Prostate cancer; T: Tumor sample.
In vitro, the knockdown of FOXD1 inhibits cell proliferation, migration&invasion of PCa
As shown in &B, the mRNA and protein expression levels of FOXD1 were significantly higher in PCa cell lines than in normal cell lines (p < 0.01). We found the highest expression of FOXD1 in PC-3 cell line, followed by DU145 cell line. PC-3 and DU145 are androgen-independent and highly invasive. To explore the role of FOXD1 in PCa, we used lentiviral FOXD1-shRNA to knockout the FOXD1 gene in PC-3 and DU145 cells. We used qRT-PCR and Western blot to examine the efficiency of knockdown. The results showed that the expression of FOXD1 in the knockdown group was significantly lower than that in the negative control group and the blank control group (p < 0.001) ( and D).
(A) The relative expression of FOXD1 was investigated by quantitative real-time PCR in PCa cell lines LNCaP, DU145, PC-3, 22RV1 and a normal human prostate cell line WPMY-1. GAPDH was used as an internal control. (B) The expression of FOXD1 at protein level was evaluated by Western blot. (C) The relative expression of FOXD1 was investigated by qRT-PCR in PCa cell lines PC-3 and DU145 after lentivirus transfection. (D) The expression of FOXD1 at protein level was evaluated by Western blot after lentivirus transfection. (E) The effects of FOXD1 on the proliferation of PC-3 and DU145 cells were evaluated by Cell Counting Kit-8 tests. (F) The effects of FOXD1 on the proliferation of PC-3 and DU145 cells were evaluated by colony formation tests. (G) Statistical analysis of the results from colony formation assays. (H) The effects of FOXD1 on the migration of PC-3 and DU145 cells were evaluated by wound healing assays. (I) Statistical analysis of the results from wound healing assays. (J) Representative images of transwell assays from control, sh-control and sh-FOXD1 groups of PC-3 and DU145 cells. (K) Statistical analysis of the results from transwell assays. *p < 0.05, **p < 0.01, ***p < 0.001 vs the sh-control group.
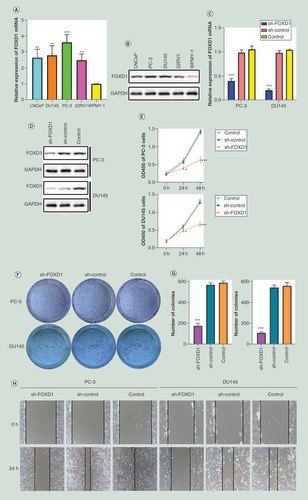
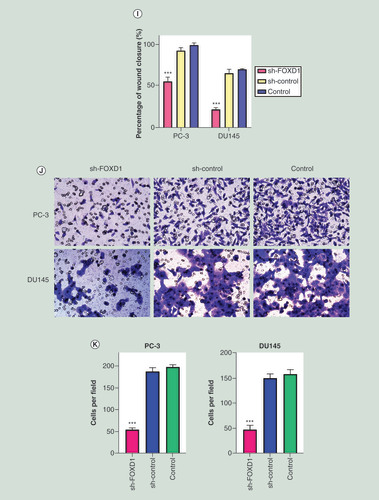
In CCK-8 assay (), the knockdown of FOXD1 resulted in a significant decrease in the proliferation rate of PC-3 and DU145 cells (24 h: p < 0.05; 48 h: p < 0.001). In the colony formation assay (&G), the knockdown of FOXD1 resulted in a significant decrease in the ability of colony formation for PC-3 and DU145 cells (p < 0.001). In the wound healing assay (&I), the knockdown of FOXD1 resulted in a significant decrease in the migration rate of PC-3 and DU145 cells (p < 0.001). In the transwell invasion assay (&K), the knockdown of FOXD1 resulted in a significant decrease in the invasive ability of PC-3 and DU145 cells (p < 0.001).
Discussion
The significant heterogeneity of PCa is a major challenge for clinicians in treating patients [Citation45]. PCa patients who receive the same treatment may have different outcomes, which undoubtedly brings great financial, health and psychological trauma to the patients who suffer from adverse outcomes. Therefore, methods to better predict the prognosis of patients and provide more effective intervention based on different prediction results are needed. In the current clinical risk stratification system for PCa patients, significant clinical heterogeneity still exists even after a given risk [Citation6].
Following the recent development of genomics, a large number of genome-related data have been produced. Behind these genome-related data lie a wealth of undiscovered information that may hold the key to solving the various problems we face today. A large number of studies have reported that the analysis of DNA methylation can help with the diagnosis, treatment and prediction of diseases. For example, the two CpG sites screened by Wang et al. [Citation46] have high diagnostic efficacy for the early diagnosis of colorectal cancer. This study mainly explored the role of CpG sites in the early diagnosis of colorectal cancer, but due to the heterogeneity of PCa, we should pay more attention to the risk stratification of patients when conducting research. Murphy et al. [Citation47] used multiple omics platforms to integrate biomarkers to improve the stratification of patients with aggressive and indolent PCa. This study is of high research value, but its risk stratification of the disease depends on multiple sets of data, which may increase the complexity and cost of diagnosis. Jeyapala et al. [Citation48] identified four methylation drivers to improve the prediction of recurrence in patients with PCa after surgery. However, if this study can explore biomarkers that predispose patients to relapse after surgery, it may provide a better indication of clinical transformation.
In this study, we analyzed DNA methylation and RNA-seq datasets from the TCGA database of PCa. We evaluated the differences in methylation patterns in approximately 500 PCa cases and defined a risk prediction model using the methylation status of six CpG islands. The risk values of patients can be obtained by the risk assessment formula (Risk scores = 0.304 * cg09279544 + 0.230 * cg18390610 + 0.649 * cg25741646 + 0.147 * cg21495612 + 0.196 * cg23514619 – 1.206 * cg23258881). The model performed well as the AUCs were equal to 0.823 at 3 years, 0.844 at 5 years and 0.891 at 7 years. Our goal is not only to accurately predict the outcome of PCa patients, but also to provide effective intervention for patients these patients based on these predictions. Therefore, we wanted to use this model to stratify the risk of patients and find treatment targets for high-risk PCa patients. WGCNA can cluster genes with similar functions in the same gene module through gene expression profile characteristics, and find the gene module most relevant to the risk score according to the gene module characteristics. Such analysis is different from the process of screening differential genes through a threshold setting in difference analysis. Because of the subjective selection in setting the threshold, some meaningful genes may be missed. The WGCNA we choose will not have this problem, allowing us to keep as many meaningful genes as possible. We determined the gene coexpression module that showed the most positive correlation with the risk predicted by the model.
Finally, FOXD1, INSM1, PLA2G7Â and SH3RF1 were selected as hub genes for therapies against poor prognosis in this study. Phospholipase PLA2G7 is a member of the arachidonic acid and prostaglandin pathway, which has been linked to PCa [Citation49]. Some studies have shown that silencing PLA2G7 sensitized PCa cells to oxidative stress, especially in ERG-positive PCa [Citation49]. Moreover, these studies suggested that PLA2G7 can be used as a therapeutic target for PCa [Citation49,Citation50]. A study demonstrated that Siah2 and SH3RF1 are essential mediators of death receptor-mediated apoptosis, and revealed that targeting the interaction of these two E3 ligases was a novel cancer therapeutic strategy in PCa [Citation51]. One study suggested that FOXD1 was more highly expressed in PCa associated with lymph node metastases [Citation52]. Furthermore, a study found that INSM1 could act as a diagnostic marker for small cell carcinoma of the prostate [Citation53]. However, no studies have shown whether FOXD1 and INSM1 can be used as therapeutic targets for the poor prognosis of PCa. We then found that FOXD1 was highly expressed in more tumor types than INSM1. Therefore, FOXD1 was identified as a therapeutic target for the poor prognosis of PCa in this study. We then demonstrated the function of FOXD1 in PCa. The experimental results shown that the knockdown of FOXD1 inhibits cell proliferation, migration and invasion of PCa. For the first time, our study used a variety of bioinformatics methods and experimental validation to propose that FOXD1 might be used as therapeutic targets for the treatment of PCa patients with a poor prognosis. We know that genes in the same coexpression module have similar biological properties [Citation27]. FOXD1 that have not been studied in therapies against the poor prognosis of PCa are as likely to perform similar functions as PLA2G7 and SH3RF1, which are in the same coexpression module. PLA2G7 and SH3RF1 have been shown in other studies to be used as targets to develop therapies to treat patients with a poor prognosis. On the one hand, this result reversely proved the effectiveness of the analytical method in this study, and on the other hand, it also increased the feasibility of FOXD1 as targets against the poor prognosis of PCa.
There are many studies based on the generation of models for disease diagnosis or prediction of prognosis, but most of these focus on the diagnostic efficacy of the models. In this study, we not only constructed a risk prediction model for the prognosis of PCa patients, but we also stratified the risk of patients through this model. In addition, we used WGCNA and other methods to screen out therapeutic targets associated with poor prognosis, and demonstrated the feasibility of these targets. We have not yet found the same approach in the epigenetics of PCa. Our approach may also provide new analytical methods for studies of diagnosis or prediction models in other types of cancers.
Conclusion
In this study, we first constructed a risk prediction model with six CpG sites. We then used this model to identify FOXD1 as a therapeutic target for poor prognosis in PCa patients.
Future perspective
Prediction and improvement of the prognosis of PCa is key to effective clinical treatments. Epigenetics is a topic of interest in current and future research. Targeted and precise therapy is also the trend of future medical development. It is a new and more effective method to screen prognostic gene targets by the risk prediction model of DNA methylation and WGCNA.
The risk prediction model was constructed by least absolute shrinkage and selection operator regression from DNA methylation data of prostate cancer patients in the The Cancer Genome Atlas database.
The Mann–Whitney U test, χ2 test or Fisher’s exact test indicated that pathological Gleason score, tumor, node, metastasis (T), cancer-specific death and biochemical recurrence were correlated with the risk of the prediction model.
COX regressions and multivariate time-dependent receiver operating characteristic curves supported that the model can be used to predict prognosis alone.
WGCNA, enrichment analysis in the Metascape, and the GEPIA database were used to identify FOXD1 as the target gene.
The functional validation shown that the knockdown of FOXD1 inhibits cell proliferation, migration and invasion of prostate cancer.
Acknowledgments
The results shown here are in whole based upon data generated by the TCGA Research Network: https://www.cancer.gov/tcga. The authors would like to thank Enago (www.enago.cn) for providing the English writing assistance. We thank the Medical Research Center of Shengjing Hospital for providing us with laboratories.
Financial&competing interests disclosure
This research was supported by the National Natural Science Foundation of China (No. 81802540), the Natural Science Foundation of Liaoning Province (No. 20180550985) and the Shenyang Science and Technology Program for Young Innovative Talents (No. RC190386). This research was also supported by the 345 Talent Project of Shengjing Hospital of China Medical University. The authors have no other relevant affiliations or financial involvement with any organization or entity with a financial interest in or financial conflict with the subject matter or materials discussed in the manuscript apart from those disclosed.
Writing assistance was utilized in the production of this manuscript. Funding for this service was provided by National Natural Science Foundation of China (No. 81802540).
Data sharing statement
The authors used DNA methylation data and RNA-seq data from patients with prostate cancer in the TCGA database to train the model and explore therapeutic targets. This study is the first in prostate cancer to construct a DNA methylation risk model and explore therapeutic targets based on the risk prediction model. The datasets used and analyzed during the current study are available from the corresponding author on reasonable request.
Additional information
Funding
References
- Siegel RL , MillerKD , JemalA. Cancer statistics, 2018. CA Cancer J. Clin.68(1), 7–30 (2018).
- Eggener SE , CifuAS , NabhanC. Prostate cancer screening. JAMA314(8), 825–826 (2015).
- Hayes JH , BarryMJ. Screening for prostate cancer with the prostate-specific antigen test: a review of current evidence. JAMA311(11), 1143–1149 (2014).
- Cooperberg MR , BroeringJM , CarrollPR. Time trends and local variation in primary treatment of localized prostate cancer. J. Clin. Oncol.28(7), 1117–1123 (2010).
- D’amico AV , WhittingtonR , MalkowiczSBet al. Biochemical outcome after radical prostatectomy, external beam radiation therapy, or interstitial radiation therapy for clinically localized prostate cancer. JAMA280(11), 969–974 (1998).
- Zumsteg ZS , SprattDE , PeiIet al. A new risk classification system for therapeutic decision making with intermediate-risk prostate cancer patients undergoing dose-escalated external-beam radiation therapy. Eur. Urol.64(6), 895–902 (2013).
- Kulis M , EstellerM. DNA methylation and cancer. Adv. Genet.70, 27–56 (2010).
- Moore LD , LeT , FanG. DNA methylation and its basic function. Neuropsychopharmacology38(1), 23–38 (2013).
- Costa FF , PaixãoVA , CavalherFPet al. SATR-1 hypomethylation is a common and early event in breast cancer. Cancer Genet. Cytogenet.165(2), 135–143 (2006).
- Piña IC , GautschiJT , WangGYet al. Psammaplins from the sponge Pseudoceratina purpurea: inhibition of both histone deacetylase and DNA methyltransferase. J. Org. Chem.68(10), 3866–3873 (2003).
- Klutstein M , NejmanD , GreenfieldR , CedarH. DNA methylation in cancer and aging. Cancer Res.76(12), 3446–3450 (2016).
- Mikeska T , CraigJM. DNA methylation biomarkers: cancer and beyond. Genes5(3), 821–864 (2014).
- Crujeiras AB , Diaz-LagaresA , SandovalJet al. DNA methylation map in circulating leukocytes mirrors subcutaneous adipose tissue methylation pattern: a genome-wide analysis from non-obese and obese patients. Sci.Rep.7, 41903 (2017).
- Williams C , LewseyJD , BriggsAH , MackayDF. Cost-effectiveness analysis in r using a multi-state modeling survival analysis framework: a tutorial. Med. Decis. Making37(4), 340–352 (2017).
- George B , SealsS , AbanI. Survival analysis and regression models. J. Nucl. Cardiol.21(4), 686–694 (2014).
- Svane AM , SoerensenM , LundJet al. DNA methylation and all-cause mortality in middle-aged and elderly danish twins. Genes9(2), E72 (2018).
- Butcher LM , BeckS. Probe Lasso: a novel method to rope in differentially methylated regions with 450K DNA methylation data. Methods72, 21–28 (2015).
- Song Q , ShangJ , YangZet al. Identification of an immune signature predicting prognosis risk of patients in lung adenocarcinoma. J. Transl. Med.17(1), 70 (2019).
- Bertocci MA , BebkoG , VersaceAet al. Reward-related neural activity and structure predict future substance use in dysregulated youth. Psychol. Med.47(8), 1357–1369 (2017).
- Kuhn M . The caret package. R Foundation for Statistical ComputingVienna, Austria (2012). https://cran.r-project.org/package=caret
- Treviño V , Tamez-PenaJ. VALORATE: fast and accurate log-rank test in balanced and unbalanced comparisons of survival curves and cancer genomics. Bioinformatics33(12), 1900–1901 (2017).
- Uusitalo E , RantanenM , KallionpääRAet al. Distinctive cancer associations in patients with neurofibromatosis type 1. J. Clin. Oncol.34(17), 1978–1986 (2016).
- Emura T , MatsuiS , ChenHY. compound.Cox: univariate feature selection and compound covariate for predicting survival. Comput. Methods Programs Biomed.168, 21–37 (2019).
- Cao B , ZhangL , ZouYet al. Survival analysis and prognostic nomogram model for multiple system atrophy. Parkinsonism Relat. Disord.54, 68–73 (2018).
- Blanche P , DartiguesJF , Jacqmin-GaddaH. Estimating and comparing time-dependent areas under receiver operating characteristic curves for censored event times with competing risks. Stat. Med.32(30), 5381–5397 (2013).
- Love MI , HuberW , AndersS. Moderated estimation of fold change and dispersion for RNA-seq data with DESeq2. Genome Biol.15(12), 550 (2014).
- Langfelder P , HorvathS. WGCNA: an R package for weighted correlation network analysis. BMC Bioinformatics9, 559 (2008).
- Maertens A , TranV , KleensangA , HartungTet al. Weighted gene correlation network analysis (WGCNA) reveals novel transcription factors associated with bisphenol a dose-response. Front. Genet.9, 508 (2018).
- Horvath S , DongJ. Geometric interpretation of gene coexpression network analysis. PLoS Comput. Biol.4(8), e1000117 (2008).
- Zhou Y , ZhouB , PacheLet al. Metascape provides a biologist-oriented resource for the analysis of systems-level datasets. Nat. Commun.10(1), 1523 (2019).
- Tang Z , LiC , KangB , GaoG , LiC , ZhangZ. GEPIA: a web server for cancer and normal gene expression profiling and interactive analyses. Nucleic Acids Res.45(W1), W98–W102 (2017).
- Lonsdale J , ThomasJ , SalvatoreMet al. The Genotype-Tissue Expression (GTEx) project. Nat. Genet.45(6), 580–585 (2013).
- Human genomics . The genotype-tissue expression (GTEx) pilot analysis: multitissue gene regulation in humans. Science348(6235), 648–660 (2015).
- Ghosh K , ChatterjeeB , MaheswariU , AthifaM , KanadeSR. 4-Nonylphenol-enhanced EZH2 and RNF2 expression, H3K27me3 and H2AK119ub1 marks resulting in silencing of p21CDKN1A in vitro. Epigenomics11(8), 899–916 (2019).
- Wang Y , ZengL , LiangCet al. Integrated analysis of transcriptome-wide m6A methylome of osteosarcoma stem cells enriched by chemotherapy. Epigenomics11(15), 1693–1715 (2019).
- Zhang J , ShiK , HuangWet al. The DNA methylation profile of non-coding RNAs improves prognosis prediction for pancreatic adenocarcinoma. Cancer Cell Int.19, 107 (2019).
- Royston P , ParmarMK , AltmanDG. Visualizing length of survival in time-to-event studies: a complement to Kaplan-Meier plots. J. Natl Cancer Inst.100(2), 92–97 (2008).
- Liu X , HuAX , ZhaoJL , ChenFL. Identification of key gene modules in human osteosarcoma by co-expression analysis weighted gene co-expression network analysis (WGCNA). J. Cell. Biochem.118(11), 3953–3959 (2017).
- Ravasz E , SomeraAL , MongruDA , OltvaiZN , BarabásiAL. Hierarchical organization of modularity in metabolic networks. Science297(5586), 1551–1555 (2002).
- Yip AM , HorvathS. Gene network interconnectedness and the generalized topological overlap measure. BMC Bioinformatics8, 22 (2007).
- Aleksic T , GrayN , WuXet al. Nuclear IGF1R interacts with regulatory regions of chromatin to promote RNA polymerase II recruitment and gene expression associated with advanced tumor stage. Cancer Res.78(13), 3497–3509 (2018).
- Jia X , ChenJ , SunSet al. Detection of aggressive prostate cancer associated glycoproteins in urine using glycoproteomics and mass spectrometry. Proteomics16(23), 2989–2996 (2016).
- Komoroski RA , HolderJC , PappasAA , FinkbeinerAE. 31P NMR of phospholipid metabolites in prostate cancer and benign prostatic hyperplasia. Magn. Reson. Med.65(4), 911–913 (2011).
- Fahrenholtz CD , GreeneAM , BeltranPJ , BurnsteinKL. A novel calcium-dependent mechanism of acquired resistance to IGF-1 receptor inhibition in prostate cancer cells. Oncotarget5(19), 9007–9021 (2014).
- Aly A , MullinsCD , HussainA. Understanding heterogeneity of treatment effect in prostate cancer. Curr. Opin. Oncol.27(3), 209–216 (2015).
- Wang X , WangD , ZhangH , FengM , WuX. Genome-wide analysis of DNA methylation identifies two CpG sites for the early screening of colorectal cancer. Epigenomics12(1), 37–52 (2019)
- Murphy K , MurphyBT , BoyceSet al. Integrating biomarkers across omic platforms: an approach to improve stratification of patients with indolent and aggressive prostate cancer. Mol. Oncol.12(9), 1513–1525 (2018).
- Jeyapala R , KamdarS , Olkhov-MitselEet al. An integrative DNA methylation model for improved prognostication of postsurgery recurrence and therapy in prostate cancer patients. Urol. Oncol.38(2), 39.e1–39.e9 (2019).
- Vainio P , GuptaS , KetolaKet al. Arachidonic acid pathway members PLA2G7, HPGD, EPHX2, and CYP4F8 identified as putative novel therapeutic targets in prostate cancer. Am. J. Pathol.178(2), 525–536 (2011).
- Vainio P , LehtinenL , MirttiTet al. Phospholipase PLA2G7, associated with aggressive prostate cancer, promotes prostate cancer cell migration and invasion and is inhibited by statins. Oncotarget2(12), 1176–1190 (2011).
- Christian PA , FiandaloMV , SchwarzeSR. Possible role of death receptor-mediated apoptosis by the E3 ubiquitin ligases Siah2 and POSH. Mol. Cancer10, 57 (2011).
- Van Der Heul-Nieuwenhuijsen L , DitsNF , JensterG. Gene expression of forkhead transcription factors in the normal and diseased human prostate. BJU Int.103(11), 1574–1580 (2009).
- Xin Z , ZhangY , JiangZet al. Insulinoma-associated protein 1 is a novel sensitive and specific marker for small cell carcinoma of the prostate. Hum. Pathol.79, 151–159 (2018).