
Abstract
Aim: To profile DNA methylation changes of primary biliary cholangitis (PBC) and primary sclerosing cholangitis (PSC). Materials & methods: Patients with: PBC, PSC with inflammatory bowel disease (IBD), PSC without IBD, and age-, sex-matched controls were profiled for methylomes of peripheral blood by reduced representation bisulfite sequencing. Differentially methylated CpG (DMC) and differentially methylated region (DMR) were detected and compared. Results: We identified consistently altered DMCs and DMRs across diseases with involvement in key pathways. Many similarities noted between two subtypes of PSC, interestingly few existed between PBC and PSC. DMRs were highly enriched with transcription factor binding. Top DMC changes were validated in liver tissue of an independent cohort. Conclusion: Methylome profiling provides insights to PBC and PSC.
Primary biliary cholangitis (PBC) and primary sclerosing cholangitis (PSC) are rare, chronic idiopathic liver diseases characterized by immune damage and blockage of bile ducts in the liver. While small intrahepatic bile ducts are affected in PBC, medium and large-sized extrahepatic and/or intrahepatic bile ducts are impaired in PSC [Citation1]. The etiology of either diseases is unknown although several contributing factors have been reported. PBC predominantly occurs in females (female to male ratio of 10:1) in their middle to elderly ages. Family history, other concurrent autoimmune diseases, cigarette smoking and infectious triggers have been associated with disease development. PSC, however, is seen more often in males (male to female ratio 2:1), at a younger age (30–40 years) and very often co-exists with inflammatory bowel disease (IBD, mainly ulcerative colitis). PSC is a progressive that predisposes patients to bile duct cancer and colon cancer [Citation2].
Genome-wide association studies (GWAS) have showed that variants of the HLA region are associated with either PBC or PSC [Citation3,Citation4]. Nevertheless, other non-HLA variants have been reported in association with PBC or PSC [Citation3,Citation4]. Among the 27 most significant non-HLA risk loci for PBC [Citation3], only one (rs3748816 in MMEL1 locus) is shared with those found in PSC. The most significant SNP from the largest study for PSC shows a variant in UBASH3A that may affect its splicing and expression [Citation5].
Despite the advances derived from GWAS, the contribution of genetic variants is generally small, leaving the majority of the disease pathogenesis unexplained. Monozygotic twins often demonstrate divergence of the diseases, suggesting the involvement of other factors such as environmental exposures and epigenetics. In a study of monozygotic (MZ) twins (3 pairs) and sisters of similar age (8 pairs) discordant for PBC, consistent DNA methylation differences at 60 gene regions were reported, of which 17 had accompanying gene expression changes [Citation6]. As PBC is female dominant, a chromosome X specific DNA methylation profiling study showed hypermethylation of FUNDC2 in CD8+ T cells and a hypomethylation of CXCR3 in CD4+ T cells, which inversely correlated with CXCR3 expression in early-stage PBC [Citation7]. Both studies used methylated DNA immunoprecipitation (MeDIP), which pulls down methylated DNA regions with low resolution. However, the small sample sizes were likely underpowered to detect small and reliable signals. Moreover, lack of liver biopsies in current medical practice for making the diagnosis PBC or PSC, limits the ability to study epigenomic changes at the organ level. To date, no genome-wide based resolution DNA methylation profiling in peripheral blood has been performed on PBC and PSC, simultaneously.
In this study, we examined DNA methylation differences in the peripheral blood of patients with PBC or PSC in comparison with age- and sex-matched controls. We conducted comprehensive base resolution DNA methylation profiling in patients and with their matched controls using reduced representation bisulfite sequencing (RRBS) assay. Our findings not only could provide insights to the etiologies of PBC and PSC but also have the potential to assist the development of blood based biomarkers for either disease.
Materials & methods
Study subjects
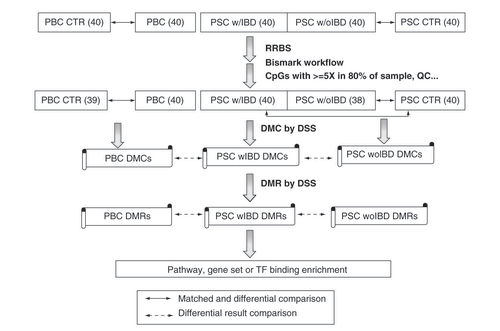
This study was approved by Mayo Clinic Institutional Review Board (IRB) and all participating subjects gave written informed consent. Patients and controls were selected from our existing PBC [Citation8] and PSC [Citation5] biorepository where age- and sex- were one-to-one matched to reduce potential confounding factors for DNA methylation changes. Forty patients each for these with PBC, PSC with IBD and PSC without IBD along their matched controls (40 for PBC and 40 for PSC) were selected and their blood samples were retrieved (). All patients had early stage of liver disease and none had undergone liver transplantation at the time of blood specimen collection.
The number with parenthesis is the sample size.
CTR: Control; DMC: Differentially methylated CpG; DMR: Differentially methylated region; DSS: R package of dispersion shrinkage for sequencing data; IBD: Inflammatory bowel disease; PBC: Primary biliary cholangitis; PSC: Primary sclerosing cholangitis; PSC w/IBD: PSC patient with concurrent IBD; w/oIBD: PSC patient without IBD; RRBS: reduced representation bisulfite sequencing; TF: Transcription factor.
Library prep & sequencing
DNA was isolated from the buffy coat portion of collected blood samples using genomic DNA isolation kit as per manufacturer’s instructions (Zymo Research, cat D3040). Reduced Representation Bisulfite Sequencing (RRBS) library preparation was performed on the extracted DNA using the NuGen RRBS Ovation Kit (NuGen, CA, USA). Briefly, double stranded DNA was digested with Msp1 and indexed methylated adaptors were ligated to the digested fragments with T4 DNA ligase. The ligated DNA was repaired with Final Repair mix. Bisulfite modification was performed using EZ-DNA Methylation Kit (Zymo Research, CA, USA). Bisulfite modified product was amplified with PCR and purified with Ampure beads. The concentration and size distribution of the completed libraries was determined using an Agilent Bioanalyzer DNA 1000 chip (CA, USA) and Qubit fluorometry (Invitrogen, CA, USA) Completed libraries were pooled and 10% commercially prepared PhiX library (Illumina) was added to increase base diversity for improved sequencing quality. Samples were sequenced at 6–8 samples per lane to generate ∼40–100 million reads per sample following Illumina’s standard protocol using the Illumina cBot and HiSeq 3000/4000 PE Cluster Kit. The flow cells were sequenced as 51 × 2 paired end reads on an Illumina HiSeq 4000 using HiSeq 3000/4000 sequencing kit and HCS v3.3.52 collection software. Base-calling was performed using Illumina’s RTA version 2.7.3.
RRBS data pre-processing & quality assessment
The raw RRBS data in fastq format were trimmed by Trim Galore (https://github.com/FelixKrueger/TrimGalore) to remove potential adapters and low quality sequences from 3′ ends. These were then further processed to remove diversity adaptors added by NuGEN protocol or reads without MspI site signature expected at the 5′ end of both sequences in the pair-end sequencing. The finally cleaned reads were provided to Bismark [Citation9] for analysis with mapping to human reference genome hg38 and CpG methylation extraction. Sample level data were merged for all samples where CpG sites were captured in at least 80% of samples at minimum 5× coverage. CpG call rate per sample was calculated and principal component analysis was applied for outlier or potential batch effect detection. The estimated bisulfite conversion rates were all greater than 99%. Three samples had a call rate less than 80% and were also identified as outliers, which were therefore excluded for further analysis. No batch effects were detected. The final dataset had 197 samples and 2,499,667 CpG sites. Unsupervised clustering was applied for PBS and PSC with their respective controls separately to visualize global methylation and sample relationship.
Differentially methylated CpG & region detection & annotation
Differentially methylated CpG sites (DMCs) were detected through the DSS R statistical package [Citation10]. DSS is specially developed for count-based sequencing data taking into consideration of both technical and biological variabilities. More specifically, DMCs are calculated by estimating the mean methylation count and dispersion, and then performing Wald test on beta-binomial distribution with an ‘arcsine’ link function. The dispersion was estimated for each test group separately and no smooth was applied as RRBS data intrinsically are very sparse. The differential results were ranked by either nominal p-value or multiple testing corrected false discovery rate (FDR) when applicable. PBC cases and controls were all from females and age matched and univariate analysis of case control status was applied. PSC contained both males and females and a multivariate model by incorporating sex was performed to adjust the sex effect on DNA methylation.
CpG methylation often occurs in a functional cluster, so we further conducted differentially methylated region (DMR) detection for each case/control comparison independently. The R function ‘callDMR’ in the same DSS package was used for the purpose, in which a DMR needed to have at least four CpG sites, with minimum length of 50 bps, and over 50% of CpGs in the region being DMCs with differential p-value less than 0.05. Nearby DMRs with distance less than 50 bps were merged into a single one. The sum of the Wald test statistics for all CpG sites within a DMR was used to measure methylation change direction and magnitude.
Both DMC and DMR annotations were performed using R package ‘ChIPpeakAnno’ against Ensembl human gene annotation version 86. DMCs or DMRs that fall into the coding region of a gene or within 5KB of transcription start site (TSS) upstream were considered to be associated with that gene.
Pathway or gene set enrichment analysis
Pathway or gene set enrichment analysis was performed for DMC or DMR associated genes using RITAN (https://www.bioconductor.org/packages/release/bioc/html/RITAN.html) [Citation11] or Enrichr (https://amp.pharm.mssm.edu/Enrichr/) [Citation12] where well annotated KEGG pathways were the primary interest. Significant enrichment was tested using hypergeometric test where p-value less than 0.05 was indicative of significance. The study design and analytical workflow are illustrated in .
ReMap analysis for transcription factoring binding enrichment in DMRs
DNA methylation status often affects transcription factor (TF) binding at its target regions and some of the DMRs are located in intergenic regions where no gene is associated for interpretation. To evaluate if these DMRs are biologically relevant in terms of epigenetic regulation and located in the regions TFs bind to, we used ReMap (http://remap.univ-amu.fr/) [Citation13,Citation14] to assess the enrichment of TF binding in these DMR regions. The tool first overlaps DMR regions with the catalog of TF binding profiles collected from a large number of public TF binding datasets from ChipSeq experiments and then compares the number of these overlapping regions with the number of overlaps obtained with random regions having the same sizes and numbers as the submitted regions. The enrichment is conducted using a hypergeometric test.
Results
Clinical characteristics of patients & controls
After methylation data quality assessment, three samples did not pass quality control and were excluded. In the PBC group, there were 40 cases and 39 matched controls (one excluded due to poor quality), all of which were female with average age of 57.3 and 57.7 years, respectively (). In the PSC group, there were 78 cases (40 with concurrent IBD and 38 without in which two samples were excluded due to poor quality) and 40 age/sex matched controls with average age of 51.4, 52.5 and 51.6 years, respectively, for PSC with IBD, PSC without IBD and controls ( & ). About 57% of PSC patients or controls were female. As the result of stringent one-to-one match, there was virtually no difference between cases and controls in terms of age and sex.
Table 1. This table describes the clinical features of the patients with primary biliary cholangitis, primary sclerosing cholangitis and controls that were included in the study.
Methylome differences between patients with PBC & matched controls
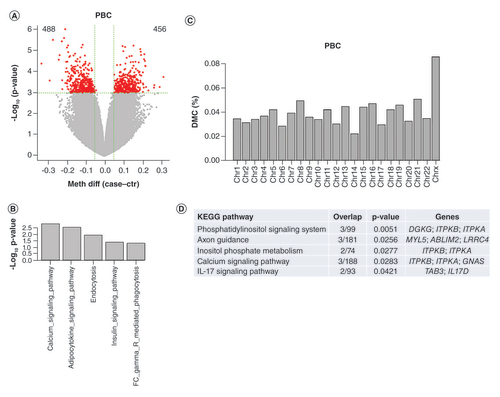
Unsupervised clustering grouped 79 samples into two main clusters; however there was no clear separation between cases and controls although they were unevenly distributed between the two clusters (55.8 vs 39.2% of cases in the left vs the right cluster, Chi-square test p = 0.16, Supplementary Figure 1). DMC detection on 2.5 million CpG sites did not show any CpG sites passing the stringent FDR cutoff less than 0.05, consisting with the indistinct cluster segregation between the cases and controls where differences between the two phenotypes were not global but likely localized or subtle. To reveal these potentially important and relevant CpG loci, we applied an unadjusted p-value less than 0.001, which resulted in 943 DMCs, 456 hyper- and 488 hypo-methylated in the PBC patient samples (). These DMCs were associated with 652 unique genes, which were significantly enriched in calcium signaling, adipocytokine signaling, endocytosis, and insulin signaling pathways (). Enrichment analysis on DMC distribution in different chromosomes showed that there were more than expected DMCs in chromosome X relative to other chromosomes (0.085 vs 0.037%, Chi-square test: p = 1.656e-07, ). DMR detection found 100 DMRs, which were associated with 70 unique genes and 6 enriched pathways (phosphatidylinositol signaling, axon guidance, inositol phosphate metabolism, calcium signaling and IL-17 signaling pathway, ). Similar genes are involved in phosphatidylinositol signaling, inositol phosphate metabolism and calcium signaling, which play many crucial roles in diverse cellular functions including immune responses [Citation15,Citation16]. IL-17 signaling is also a key pathway in regulating immunity [Citation17].
(A) Volcano plot for DMCs. The red dots are for those with p-value less than 0.001 (almost all with methylation difference >5%, the green vertical lines). The numbers on the upper corners are hyper- and hypo-methylated DMCs. (B) Significantly enriched KEGG pathways for DMC-associated genes (p #x003C; 0.05). (C) DMC distribution by chromosomes. Y axis represents % of CpGs claimed as DMCs relative to total number of CpGs at each chromosome. DMCs on Chr X are overly represented. (D) Enriched KEGG pathways for DMR-associated genes.
DMC: Differentially methylated CpG; DMR: Differentially methylated region; PBC: Primary biliary cholangitis.
Methylome changes & comparisons between PSC with & without IBD
When all samples from patients with PSC and controls were analyzed together by unsupervised clustering, three main clusters were formed (Supplementary Figure 2). Cluster 1 (the leftmost) is dominated by cases regardless of IBD status while controls are more concentrated in the middle cluster (Cluster 2, Chi-square test: p = 0.0023), suggesting there were some noticeable global methylation differences in between the patients and controls.
Differential methylation analysis for patients with IBD revealed 1201 hypo- and 1851-hyper methylated CpG sites at p-value less than 0.001 with one CpG having FDR less than 0.05 (). These DMCs were associated with 1926 genes with significant enrichment in 15 pathways (p < 0.05; 1 with FDR < 0.05) such as regulation of actin in cytoskeleton, hedgehog signaling and calcium signaling (). The DMCs were also enriched in chromosome X (Chi-square: p = 5.185e-11, ). One hundred sixty six DMRs were detected, which were associated with 128 unique genes and enriched in TGF-β signaling, fructose and mannose metabolism and inositol phosphate metabolism ().
(A) Volcano plot for DMCs of PSC with IBD versus controls. The red dots are for those with p-value less than 0.001. The numbers on the upper corners are hyper and hypomethylated DMCs. (B) Significant enriched KEGG pathways for DMC-associated genes (p < 0.05) in PSC with IBD. (C) DMC distribution by chromosome for PSC with IBD. Y axis represents % of CpGs claimed as DMCs relative to total number of CpGs at each chromosome. DMCs on Chr X are overly represented. (D) Enriched KEGG pathways for DMR-associated genes in PSC with IBD. (E) Volcano plot for DMCs of PSC without IBD versus controls. The red dots are for those with p-value less than 0.001. The numbers on the upper corners are hyper and hypo methylated DMCs. (F) Significant enriched KEGG pathways for DMC-associated genes (p < 0.05) in PSC without IBD. (G) DMC distribution by chromosome for PSC without IBD. Y axis represents % of CpGs claimed as DMCs relative to total number of CpGs at each chromosome. DMCs on Chr X are overly represented. (H) Enriched KEGG pathways for DMR-associated genes in PSC without IBD. Stars below pathways in F are the commonly enriched pathways with PSC with IBD.
DMC: Differentially methylated CpG; DMR: Differentially methylated region; IBD: Irritable bowel syndrome; KEGG: Kyoto Encyclopedia of Genes and Genomes; PBC: Primary biliary cholangitis; PSC: Primary sclerosing cholangitis.
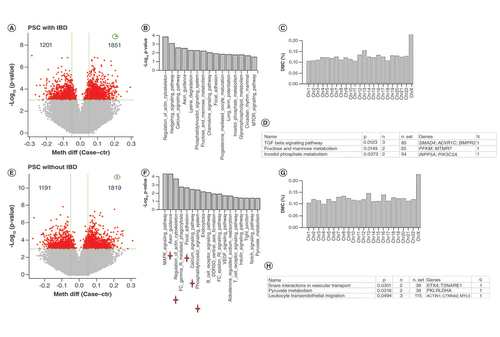
Similarly, differential methylation analysis for patients without IBD revealed 1191 hypo- and 1819-hyper methylated CpG sites (15 with FDR < 0.05, ). These DMCs were associated with 1844 genes, which were enriched in 18 pathways (p less than 0.05; 3 with FDR less than 0.05) with 5 in common with those enriched in PSC with IBD analysis (). These DMCs also had over representation in chromosome X (, p 4.619e-11). Two hundred five DMRs were identified, which were associated with 179 unique genes with enrichment in 3 pathways (interactions in vesicular transport, pyruvate metabolism and leukocyte transendothelial migration, ).
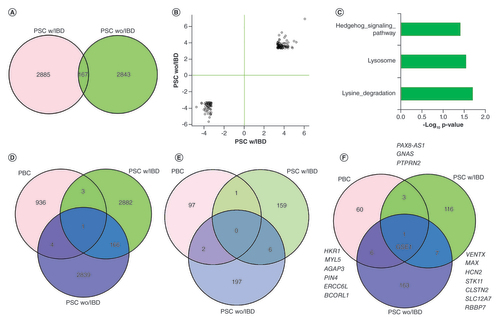
Comparing the DMCs between PSC with and without IBD found 167 commonly changed CpG sites (), which is much more than expected random chance overlap (random overlaps from 0 to 11 from 1000 permutation tests with p close to 0). More interestingly, all these CpGs had the same change directions (either hyper or hypomethylated relative to control samples) and similar magnitudes of methylation change (). The associated genes were overly represented in hedgehog signaling, lysosome and lysine degradation (). The single CpG with FDR (p = 1.62e-09, FDR: 0.004) less than 0.05 in PSC with IBD was found to the most differentially methylated in PSC without IBD as well (p = 5.64e-12, FDR: 1.41e-05). This CpG was hypermethylated in the patient samples and mapped to an intron of NOX5, a gene that codes NADPH oxidase for superoxide generation that may regulate redox-dependent processes in lymphocytes and spermatozoa [Citation18]. The other two common DMCs with FDR < 0.05 from PSC without IBD were associated with NCAN (intron) and IL17F (exon). NCAN is believed to be involved in the modulation of cell adhesion and migration while IL17 is a well-known pro-inflammatory cytokine produced by activated T cells and is associated with immune response or autoimmune diseases [Citation19].
(A) Common and unique DMCs between PSC with and without IBD (B) For the common DMCs between PSC with and without IBD, CpG methylation changes have similar scale and directions between the two conditions. Values on X and Y-axis are model statistics (Ward test) between cases versus controls. (C) Enriched pathways for the shared DMC-associated genes between PSC with and without IBD. (D) DMC overlaps among PBC, PSC with IBD and PSC without IBD. Minimal overlaps exist between PBC with either PSC with or without IBD. (E) DMR regional overlaps among PBC, PSC with IBD and PSC without IBD. (F) DMR-associated genes overlap among PBC, PSC with IBD and PSC without IBD.
DMC: Differentially methylated CpG; DMR: Differentially methylated region; IBD: Irritable bowel syndrome; PBC: Primary biliary cholangitis; PSC: Primary sclerosing cholangitis.
Comparative analysis of differential methylation between PBC & PSC
Although PBC and PSC have similarities in clinical presentations and pathology, they are also different in many aspects. We sought to examine commonalities and differences in their methylome. Surprisingly, we found very few overlaps for DMCs or DMRs from each separate analysis between PBC and PSC with or without IBD. For DMCs, only four and five DMCs in PBC were shared with PSC with IBD and PSC without IBS, respectively (). The one that was common among all three diseases turned out to the same one with the most significant change from both PSC with and without IBD comparison, a CpG in the intron of NOX5 gene. This CpG was also significantly hypo-methylated in PBC with p = 0.00026 and methylation difference 12%. At DMR level, there was no shared DMR region (overlap at least one base) among the three diseases; however, there were 1 between PBC and PSC with IBD, 2 between PBC with PSC without IBD and 6 between PSC with and without IBD (). For the DMR-associated genes, GSE1 was the only associated gene shared among the three diseases while 3, 6 and 7 genes were shared between PBC and PSC with IBD, PBC and PSC without IBD, and PSC with IBD and PSC without IBD, respectively (). While the DMR from PBC is located in the promoter region of GSE1 and is hypermethylated in the cases, both DMRs from PSC with IBD and without IBD are in the gene body and hypomethylated.
Significant enrichment of transcription factor binding in the DMRs of three diseases
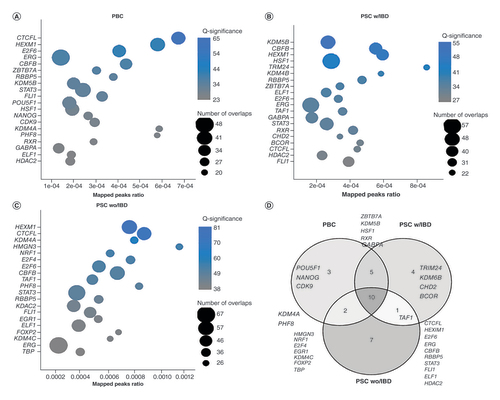
As DNA methylation affects TF binding and many DMRs are not in genic region, we then ReMap to assess the enrichment of TF binding in the DMR regions. Intriguingly, biding sites of many TFs were significantly enriched in the DMRs from each disease. Among 485 TFs evaluated with FDR less than 0.05, 253 were significant for PBC DMRs, 267 for PSC with IBD and 318 for PSC without IBD. The top 20 enriched TFs from each (all with FDR < 1E-20) are presented in , B and C for PBC, PSC with IBD and PSC without IBD, respectively. These top enriched TFs from three diseases were largely overlapped. More specifically, 10 out of 20 TFs from each were shared, 15 were common between PBC and PSC with IBD, 12 between PBC and PSC without IBD and 11 between PSC with IBD and PSC without IBD (). The most notable one is HEXM1, one of the top three for all three diseases. Along with NEAT1, this TF was found to form a multi-subunit complex that regulates dna-mediated innate immune response [Citation20]. These data suggest that although DMRs from three diseases had few physical overlaps, similar set of TFs were involved in the disease processes and different methylation status in these DMR regions may affect their bindings, and thus, lead to different phenotypes.
(A) PBC DMRs. (B) PSC with IBD DMRs. (C) PSC without IBD DMRs. For all the plots, X-axis represents the percentage of TF binding sites overlapped by the query DMR list. The bubble size represents the number of DMRs overlapping with TF biding sites. The color represent enrichment significance as measured by -log10 (q value), the larger, the more significant, which is obtained after adjusting the p-value under the Poisson distribution using randomized query regions. (D) The overlaps of top 20 enrichened TFs among the three diseases. Half of them are common among the three diseases.
DMC: Differentially methylated CpG; DMR: Differentially methylated region; IBD: Irritable bowel syndrome; PBC: Primary biliary cholangitis; PSC: Primary sclerosing cholangitis; TF: Transcription factor.
Methylation changes of some top DMCs from blood observed in liver tissues from PBC & PSC patients compared with normal donor controls
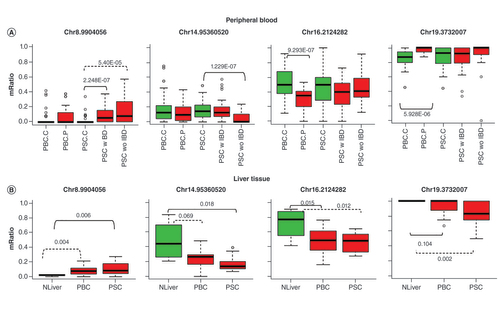
As PBC and PSC are autoimmune and inflammatory diseases, we reasoned that some of DNA methylation in peripheral blood from these patients may be similarly detected in the liver, the primary organ of these diseases. These methylation changes may be potentially used as blood biomarkers. To test this hypothesis, we analyzed the top DMCs (10 each from each of the three diseases above according to the smallest p-values, 29 unique CpGs) in the previously generated liver RRBS data from 20 patients with PBC, 13 patients with PSC and 4 organ donors [Citation21]. The limitations of this liver RRBS data are that they were generated from formalin fixed paraffin embedded (FFPE) tissue block, which is known less ideal for the RRBS experiment, and the four organ donors as controls were too few to have a sufficient power to detect differential methylation. In spite of these challenges, we were able to map nine CpG positions with sufficient coverage and four of them (2 from PBC and 2 from PSC in blood analysis) were found to be differentially methylated (p less than at least 0.05) between either PBC versus controls or PSC versus controls (). Three of the four were in the same change direction as observed in peripheral blood while the fourth one was not seen significantly changed in the tissue of PBC patients as originally detected in the peripheral blood of PBC patients. However, it was significantly hypomethylated in the PSC patient samples. The CpGs on chr8, chr16 and chr19 are located inside of LINC00599, PKD1 and TJP3 respectively while the one on chr14 is in the intergenic region close to a lincRNA LINC02292. Mutations of PKD1 are associated with most cases of polycystic kidney disease (PKD), a severe hereditary disorder of the kidneys. TJP3 is an important component of cell-cell tight junction transmembrane proteins.
(A) CpG methylation profiles in peripheral blood of PBC and PSC patients and controls. PBC.C: PBC controls; PBC.P: PBC patients; PSC.C: PSC controls; PSC.wIBD: PSC patients with IBD; PSC.woIBD: PSC patients without IBD. (B) CpG methylation profiles of the same CpG sites in RRBS data of liver samples for patients with PBC and PSC patients and controls. NLiver: liver donor normal controls. The number above or below a bracket line is the differential p-value for the respective comparison between two linked sample groups. The dashed line along with p-value represents other differentially methylated comparison although the top CpG is selected from the solid line group. mRatio on y-axis is methylation level as represented by ratio of methylation at a CpG site for samples.
IBD: Irritable bowel syndrome; PBC: Primary biliary cholangitis; PSC: Primary sclerosing cholangitis.
Discussion
PBC and PSC are two distinct, chronic cholestatic liver diseases of unknown etiology. Large GWAS have identified several risk loci, however, the contribution of genetic variants to the pathogenesis of these diseases is estimated to be less than 20%. Thus, involvement of epigenetic processes in the development of these diseases is very likely [Citation22]. Here we conducted simultaneously the first genome-wide based resolution DNA methylation profiling using RRBS on peripheral blood derived from patients with PBC and PSC. This study has allowed us not only to identify disease specific but also common methylation changes in these two liver conditions. Our results showed that comparing to their age and sex matched controls, both PBC and PSC had no clear global methylation changes in their peripheral blood as PSC with and without IBD were also not easily separable. This observation is not surprising considering that the methylation measurement was from the mixture of white blood cells, not from the lesion of primary organ liver. In spite of this, we have observed quite some subtle but interesting methylation changes in each of the diseases. Compared with PSC, the changes in PBC patients were smaller in terms of detected DMCs and DMRs. Unsurprisingly, there were more commonly changed DMCs, DMRs, and enriched pathways between PSC with and without IBD. We found that an intronic CpG in NOX5, which is the most differentially methylated in both PSC and PBC, was hyper-methylated in all three diseases. Hypomethylation on an exon of IL17F, a known pro-inflammatory cytokine, was observed in the PSC patients. DMRs from these diseases were highly enriched with the binding sites of TFs and the top TFs were largely overlapping. More importantly, we found that the methylation changes of several top DMCs were similarly observed in the liver tissues, which could potentially serve as blood-based biomarkers.
Chromosome X loss or nonrandom X inactivation is observed more frequently in PBC patients than age matched controls [Citation23,Citation24]. Also, a study on chromosome X DNA methylation for sorted CD4, CD8 and CD14 using custom microarray found several changed promoters in PBC patients relative to control samples such as hypermethylation of FUNDC2 in CD8+ T cells and demethylation of CXCR3 in CD4+ T cells [Citation7]. We checked both genes and found one CpG in the TSS upstream of FUNDC2 was indeed hyper-methylated (another in downstream was hypo methylated). However, both CpGs, one up and one downstream of TSS for CXCR3 were both hyper-methylated in the patients samples. The discrepancies could be the results of the platform differences, purified versus mixture of whole cells, and different captured CpG sites.
Although notable overlaps were found for DMCs between PSC with and without IBD, the vast majority were different, which suggests that in spite of their commonalities, the two diseases may be different epigenetically. On the other hand, the possibility of non-specific findings due to limited sample sizes and less stringent criteria for DMCs may contribute to the divergence. The study demonstrates the feasibility and important insights from the high density base resolution technique, it also calls the need of study with much larger sample size in the future.
Cellular senescence is reported to be involved in PBC and PSC [Citation25–27]. Thus, we investigated whether DMR associated genes were enriched in these pathways using reactome database (https://reactome.org/). None of PBC DMR-associated genes was mapped but in PSC with IBD two DMR-associated genes (PHC2 and RBBP7) were enriched in oxidative stress induced senescence (p = 0.047). Similarly, for PSC without IBD, two DMR-associated genes (BMI1 and RBBP7) were enriched in oxidative stress induced senescence (p = 0.07).
One of the challenges in white blood cell based (buffy coat) study is that DNA methylation signal is from cell mixture of variety of cells and different proportions of cell population may confound results, particularly for large scale epigenome wide association studies [Citation28]. Several methods have been developed to estimate the cell proportions so that this variable can be considered in analysis [Citation29]. However, such methods have not been available for RRBS data as there are no sufficient data and lack of data from fractioned cell subpupations to derive a model. Methods that use whatever mappable CpGs on the microarray platform probes are generally not reliable. For example, when we tried to map 241 CpGs probes used to deconvolute cell fractions of blood samples for Illumina methylation microarray platform, only 23 probes (11 on the exact same CpG sites) were mapped to the 100 bp regions of our RRBS data. Even they were, adjustment for cell components is still debatable as differential cell subpopulations can be part of disease process and such signals detected from DNA methylation can be useful biomarkers from blood [Citation30].
Pathway enrichment analysis is generally limited to known protein coding genes due to limitation of pathway databases. Noncoding RNAs such as long noncoding RNAs or miRNAs were not considered in the analysis. We checked the DMRs from each comparison and found one and three DMRs for PSC with IBD and PSC without IBD, respectively, which are within 5KB of miRNA transcription start site. The DMR from PSC with IBD is 300 bps upstream of MIR6855 with increased methylation in the patient samples. The three DMRs from PSC without IBD are 149, 923 and 2090 bps upstream of MIR100HG, MIR4635 and MIR7974, respectively, where increased methylation for MIR100HG and reduced methylation for MIR4635 and MIR7974 were observed. Interpreting these miRNAs is not straightforward as each miRNA can have hundreds to thousands of predicted targets but their true targets can be tissue or context specific. Further study on these findings is warranted.
Lastly, this is a pilot for feasibility and hypothesis testing using the genome-wide RRBS approach. The common pathway ‘calcium signaling’ found from DMC pathway enrichment analysis in all three diseases suggests its clinical relevance since calcium signaling is involved in many physiological and pathological processes and more interestingly it plays an important role in cholangiocyte function (the cell-target of PBC and PSC), liver injury and regeneration [Citation31–33]. This is our first step of a multi-omics project that integrates DNA methylation, RNA sequencing and metabolomics on a much larger set of patient samples to elucidate the pathophysiology and improve the therapeutics of these diseases.
Conclusion
This is the first genome-wide-based resolution and comparative study of PBC, PBC with and without IBD that provides unique descriptions about the involvement of DNA methylation in these disease processes. However, considering the subtle changes noted between cases and control, a much larger study with hundreds of patients will be needed to detect signals with smaller effects. Finally, the complexity of disease development including gene-to-gene and gene-to-environment interactions also calls for integration of other omics data (i.e., transcriptome, metabolome, environmental exposures) to better understand these mechanisms.
Future perspective
PBC and PSC are progressive liver diseases of unknown etiology with limited therapies. Large genome-wide association studies have identified several genetic variations contributing to the risk of disease development. However, they generally have small effects suggesting the multifactorial nature of their etiology likely due to the interplay of genetic, epigenetic and environmental elements. Future studies need to take all these factors into consideration in large cohorts of PBC and PSC patients. DNA methylation, histone modification, small RNA and non-coding RNA play significant roles in disease pathophysiology as part of the epigenome. Nevertheless, the epigenome is also impacted by both genomic variation and environmental exposures. Thus, future studies need to focus on generation of multi-omics data (i.e., methylome, transcriptome, metabolome, environmental exposures) so that comprehensive profiling of these patients and integration of this information can lead to better insights of PBC and PSC and improved therapies.
Primary biliary cholangitis (PBC) and primary sclerosing cholangitis (PSC) are two distinct, rare, progressive cholestatic liver diseases with unknown causes.
PBC is almost exclusively occurs in women and discordance between monozygotic twins strongly suggest the involvement of the environment and epigenetics.
We carried out simultaneously on peripheral blood the first genome-wide based resolution DNA methylation study for PBC and PSC.
Methylation change signals were generally subtle, as we measured those in blood and not the organ of damage, the liver. The latter was not possible given the lack of performing liver biopsies for these patients for clinical purposes and the inherited risk of this procedure.
Consistently changed differentially methylated CpGs (DMCs) and differentially methylated regions (DMRs) across these diseases were identified with involvement in key pathways. While there were many similarities between two subtypes of PSC, few existed between PBC and PSC.
DMRs were highly enriched with transcription factor binding.
Top DMC changes were validated in the liver tissue of an independent set of patients.
Ethical conduct of research
The authors state that they have obtained appropriate institutional review board approval or have followed the principles outlined in the Declaration of Helsinki for all human or animal experimental investigations. In addition, for investigations involving human subjects, informed consent has been obtained from the participants involved.
Supplemental Figure 1
Download MS Word (284.2 KB)Supplementary data
To view the supplementary data that accompany this paper please visit the journal website at: www.tandfonline.com/doi/suppl/10.2217/epi-2020-0048
Financial & competing interests disclosure
This study was supported by RC2 DK118619 (KN Lazaridis) and the Chris M Carlos and Catharine Nicole Jockisch Carlos Endowment Fund in primary sclerosing cholangitis (PSC) (KN Lazaridis). The authors have no other relevant affiliations or financial involvement with any organization or entity with a financial interest in or financial conflict with the subject matter or materials discussed in the manuscript apart from those disclosed.
No writing assistance was utilized in the production of this manuscript.
Additional information
Funding
References
- Marchioni Beery RM , VaziriH , ForouharF. Primary biliary cirrhosis and primary sclerosing cholangitis: a review featuring a women’s health perspective. J. Clin. Transl. Hepatol.2(4), 266–284 (2014).
- Lazaridis KN , LarussoNF. Primary sclerosing cholangitis. N. Engl. J. Med.375(12), 1161–1170 (2016).
- Gulamhusein AF , JuranBD , LazaridisKN. Genome-wide association studies in primary biliary cirrhosis. Semin. Liver Dis.35(4), 392–401 (2015).
- Folseraas T , LiaskouE , AndersonCA , KarlsenTH. Genetics in PSC: what do the “risk genes” teach us?Clin. Rev. Allergy Immunol.48(2-3), 154–164 (2015).
- Ji SG , JuranBD , MuchaSet al. Genome-wide association study of primary sclerosing cholangitis identifies new risk loci and quantifies the genetic relationship with inflammatory bowel disease. Nat. Genet.49(2), 269–273 (2017).
- Selmi C , CavaciocchiF , LleoAet al. Genome-wide analysis of DNA methylation, copy number variation, and gene expression in monozygotic twins discordant for primary biliary cirrhosis. Front Immunol.5, 128 (2014).
- Lleo A , ZhangW , ZhaoMet al. DNA methylation profiling of the X chromosome reveals an aberrant demethylation on CXCR3 promoter in primary biliary cirrhosis. Clin. Epigenetics7, 61 (2015).
- Lazaridis KN , JuranBD , BoeGMet al. Increased prevalence of antimitochondrial antibodies in first-degree relatives of patients with primary biliary cirrhosis. Hepatology46(3), 785–792 (2007).
- Krueger F , AndrewsSR. Bismark: a flexible aligner and methylation caller for Bisulfite-Seq applications. Bioinformatics27(11), 1571–1572 (2011).
- Park Y , WuH. Differential methylation analysis for BS-seq data under general experimental design. Bioinformatics32(10), 1446–1453 (2016).
- Zimmermann MT , KabatB , GrillDE , KennedyRB , PolandGA. RITAN: rapid integration of term annotation and network resources. PeerJ7, e6994 (2019).
- Kuleshov MV , JonesMR , RouillardADet al. Enrichr: a comprehensive gene set enrichment analysis web server 2016 update. Nucleic Acids Res.44(W1), W90–97 (2016).
- Cheneby J , MenetrierZ , MestdaghMet al. ReMap 2020: a database of regulatory regions from an integrative analysis of Human and Arabidopsis DNA-binding sequencing experiments. Nucleic Acids Res.48(D1), D180–D188 (2019).
- Cheneby J , GheorgheM , ArtufelM , MathelierA , BallesterB. ReMap 2018: an updated atlas of regulatory regions from an integrative analysis of DNA-binding ChIP-seq experiments. Nucleic Acids Res.46(D1), D267–D275 (2018).
- Sauer K , CookeMP. Regulation of immune cell development through soluble inositol-1,3,4,5-tetrakisphosphate. Nat. Rev. Immunol.10(4), 257–271 (2010).
- Kim W , KimE , MinHet al. Inositol polyphosphates promote T cell-independent humoral immunity via the regulation of Bruton’s tyrosine kinase. Proc. Natl Acad. Sci. USA116(26), 12952–12957 (2019).
- Qian Y , KangZ , LiuC , LiX. IL-17 signaling in host defense and inflammatory diseases. Cell Mol. Immunol.7(5), 328–333 (2010).
- Bedard K , JaquetV , KrauseKH. NOX5: from basic biology to signaling and disease. Free Radic. Biol. Med.52(4), 725–734 (2012).
- Kolls JK , LindenA. Interleukin-17 family members and inflammation. Immunity21(4), 467–476 (2004).
- Morchikh M , CribierA , RaffelRet al. HEXIM1 and NEAT1 long non-coding RNA form a multi-subunit complex that regulates DNA-mediated innate immune response. Mol. Cell67(3), 387–399e385 (2017).
- Cheung AC , MooreRM , JuranBDet al. Characterization of a liver tissue epigenome in primary sclerosing cholangitis. Presented at: The 68th Annual Meeting of the A. A. S. L. D. October 20–24 (2017).
- Cheung AC , LarussoNF , GoresGJ , LazaridisKN. Epigenetics in the primary biliary cholangitis and primary sclerosing cholangitis. Semin. Liver Dis.37(2), 159–174 (2017).
- Miozzo M , SelmiC , GentilinBet al. Preferential X chromosome loss but random inactivation characterize primary biliary cirrhosis. Hepatology46(2), 456–462 (2007).
- Invernizzi P , MiozzoM , BattezzatiPMet al. Frequency of monosomy X in women with primary biliary cirrhosis. Lancet363(9408), 533–535 (2004).
- Ferreira-Gonzalez S , LuWY , RavenAet al. Paracrine cellular senescence exacerbates biliary injury and impairs regeneration. Nat. Commun.9(1), 1020 (2018).
- Tabibian JH , O’haraSP , SplinterPL , TrussoniCE , LaRussoNF. Cholangiocyte senescence by way of N-ras activation is a characteristic of primary sclerosing cholangitis. Hepatology59(6), 2263–2275 (2014).
- Guicciardi ME , TrussoniCE , LarussoNF , GoresGJ. The spectrum of reactive cholangiocytes in primary sclerosing cholangitis. Hepatology71(2), 741–748 (2020).
- Jaffe AE , IrizarryRA. Accounting for cellular heterogeneity is critical in epigenome-wide association studies. Genome Biol.15(2), R31 (2014).
- Teschendorff AE , ZhengSC. Cell-type deconvolution in epigenome-wide association studies: a review and recommendations. Epigenomics9(5), 757–768 (2017).
- Holbrook JD , HuangRC , BartonSJ , SafferyR , LillycropKA. Is cellular heterogeneity merely a confounder to be removed from epigenome-wide association studies?Epigenomics9(8), 1143–1150 (2017).
- Rodrigues MA , GomesDA , NathansonMH. Calcium signaling in cholangiocytes: methods, mechanisms, and effects. Int. J. Mol. Sci.19(12), 3913 (2018).
- Weerachayaphorn J , AmayaMJ , SpirliCet al. Nuclear factor, erythroid 2-like 2 regulates expression of type 3 inositol 1,4,5-trisphosphate receptor and calcium signaling in cholangiocytes. Gastroenterology149(1), 211–222e210 (2015).
- Oliva-Vilarnau N , HankeovaS , VorrinkSU , MkrtchianS , AnderssonER , LauschkeVM. Calcium signaling in liver injury and regeneration. Front. Med. (Lausanne)5, 192 (2018).