
Abstract
Background: Predictive biomarkers for advanced hepatocellular carcinoma are lacking. EZH2 drives sorafenib resistance through H3K27me3 and is counteracted by SETD2, which catalyzes H3K36me3. The authors tested the predictive power of circulating H3K27me3 and H3K36me3 in advanced hepatocellular carcinoma patients treated with sorafenib. Methods: A total of 80 plasma samples were tested for histone variants by ELISA. Changes from baseline to best response or progressive disease were correlated with patient survival. Results: A higher EZH2/SETD2 ratio predicted worse prognosis in this setting. H3K27me3 and H3K36me3 decreased from baseline to best response. The H3K27me3/H3K36me3 ratio increased from baseline to progressive disease. Higher ratios at best response were associated with shorter progression-free survival. Conclusion: The authors suggest that circulating H3K27me3/H3K36me3 ratio level acts as a predictive biomarker for sorafenib treatment outcomes in patients with advanced hepatocellular carcinoma.
Plain language summary
Hepatocellular carcinoma (HCC) is responsible for approximately 10% of all cancer-related deaths worldwide. It is caused mainly by dysmetabolic syndrome, which is the presence of multiple risk factors: abdominal obesity, high blood pressure, hypercholesterolemia and diabetes. The authors aimed to identify new and predictive factors for sorafenib treatment outcomes in advanced HCC patients. The authors enrolled 85 patients who received sorafenib at two Italian oncological institutions, testing their blood for the following epigenetic biomarkers: H3, H3.1 variant, H3K27me3 and H3K36me3. The authors found that H3K27me3 and H3K36me3 decreased from baseline to maximum tumor shrinkage, H3K27me3/H3K36me3 ratio increased from baseline to progressive disease and higher ratios were associated with shorter progression-free survival. The authors suggest that circulating H3K27me3/H3K36me3 ratio level acts as a predictive biomarker for sorafenib treatment outcomes in patients with advanced HCC, and its role warrants further investigation in different HCC therapeutic strategies.
Hepatocellular carcinoma (HCC) represents the fourth leading cause of cancer-related deaths worldwide, with an annual incidence of 4.7% new cases and an expected 5- and 10-year survival rate of 20 and 19%, respectively [Citation1–3]. Sorafenib, a tyrosine kinase inhibitor targeting the Raf/Mek/Erk pathway and interacting with multiple cell surface kinases involved in angiogenesis, has long been the standard of care for advanced HCC [Citation4]. Despite increasing first-line options, including lenvatinib [Citation5] and atezolizumab/bevacizumab combination [Citation6], sorafenib represents a first-line alternative in case of contraindication to more recent combination therapies. Of note, no predictive biomarkers of treatments’ outcome have yet been identified by the scientific comunity. Similarly, most robust prognostic factors, including high alfa-fetoprotein (AFP) levels, poor liver function and presence of macrovascular invasion or extrahepatic spread, rely on clinical features that are not treatment-specific [Citation7]. Sorafenib-related adverse events have been reported as on-treatment prognostic factors by mainly retrospective studies [Citation8,Citation9], whereas no treatment-specific prognostic factors have thus far been identified at baseline. Because of the relative scarcity of hot-spot mutations, circulating tumor DNA has shown limited applicability in HCC compared with other malignancies. By contrast, epigenetic modifications on cell-free circulating nucleosomes have shown great diagnostic and prognostic potential in several malignancies, including HCC [Citation10].
Available evidence indicates that HCC pathogenesis is driven by the interaction between genetic and epigenetic alterations [Citation11]. Histone post-translational modifications (HPTMs) are epigenetic alterations occurring predominantly at the N-terminal tail of histones [Citation12]. HPTMs alter the local chromatin structure, thereby regulating the transcriptional activity of specific genes. Some modifications, such as histone acetylation, reduce chromatin compaction, increasing gene expression. Other HPTMs (e.g., histone methylation) produce different effects depending on the target residue. For example, the trimethylation of histone H3 at lysine 27 (H3K27me3) induces a more compact chromatin state (gene silencing). By contrast, trimethylation at lysine 36 of the same protein (H3K36me3) causes gene activation. It has recently been shown that H3K27me3 and H3K36me3 play antagonistic roles in human malignancies [Citation13], but the function of this interplay in HCC has not been fully elucidated. H3K27me3 is catalyzed by the polycomb gene EZH2, which is a known oncogene and driver of sorafenib resistance [Citation14] and, when inhibited, enhances sorafenib’s antitumor effects [Citation15]. SETD2, the main enzyme that catalyzes H3K36me3 [Citation14], has been described as a potential oncosuppressor in HCC [Citation16]. Its inhibition has been shown to trigger spontaneous development of HCC in mouse models [Citation17], but its role in mediating response to sorafenib has never been investigated.
Recently, a range of immunoassays have been used to profile various histone modifications and variants associated with cell-free circulating nucleosomes in an approach referred to as Nucleosomics™ (Belgian Volition SRL, Gembloux, Belgium). These assays, which are based on 96-well plates coated with epitope-specific antibodies and a biotinylated detection antibody specific for intact nucleosomes, have been explored for early detection of malignancies in serum [Citation18–20]. H3K36me3 has been assessed alongside H3.1 variant and H3 citrullinated nucleosomes as a potential panel for early detection of kidney transplant rejection [Citation21]. In this study, the authors applied this emerging technology to investigate sorafenib resistance in HCC. Specifically, the authors employed prototype immunoassays specific for H3K27me3 and H3K36me3 alongside commercially available Nu.Q™ assays (Belgian Volition SRL) for H3.1- and total H3-containing nucleosomes. These assays have never been used to monitor response to specific cancer treatments. This approach allowed the authors to test the hypothesis that circulating levels of H3K27me3, H3K36me3 and total histone H3 levels predict response to sorafenib in advanced HCC patients.
Methods
Bioinformatics analyses
Gene expression & survival correlations according to the University of Alabama at Birmingham Cancer database
The University of Alabama at Birmingham Cancer interactive web server was engaged to determine the mRNA expression of SETD2 and EZH2 in HCC cells [Citation22,Citation23]. The University of Alabama at Birmingham Cancer database provides gene expression data analysis of cancer and normal tissues from The Cancer Genome Atlas, MET500 and Clinical Proteomic Tumor Analysis Consortium data portal [Citation24–26]. Using the logrank test, the Kaplan–Meier plotter [Citation27] was used to understand the prognostic value of EZH2 and SETD2 in the median progression-free survival (mPFS) and median overall survival (mOS) of 29 sorafenib-treated patients in a cohort of 364 HCC patients from The Cancer Genome Atlas [Citation28].
Identification of co-expressed EZH2 & SETD2 genes & pathway analyses
The Cancer Genome Atlas Firehose Legacy HCC dataset in cBioPortal [Citation29] was used to understand co-expressed EZH2 and SETD2 genes in 429 samples that had a higher R2 value (>50). To provide the pathway activity map of the co-expressed genes, the genes were analyzed with the help of the ConsensusPathDB-human database. ConsensusPathDB-human data for interactions identified in the literature originate from 32 public resources [Citation30,Citation31].
Clinical data
The authors enrolled 85 advanced HCC patients treated with first-line sorafenib at Pisa University Hospital, Pisa, Italy, and Istituto di Ricovero e Cura a Carattere Scientifico, Modena, Italy. The drug was administered orally daily, as per clinical practice, on a 28-day cycle. Starting dose was 800 mg/day, with dose reductions allowed according to the pivotal trial [Citation4]. Patients had signed informed consent forms for translational research projects within the INNOVATE trial [Citation32] relative to baseline (i.e., within 28 days from first sorafenib administration), best response (BR) and progressive disease (PD) according to Response Evaluation Criteria in Solid Tumors 1.1 [Citation33].
Efficacy and activity data were described in terms of mPFS, mOS, best radiological response and AFP serum levels. Patients were defined as ‘responders’ if they achieved partial response or stable disease or ‘nonresponders’ if PD occurred at first assessment. PFS and OS were estimated using the Kaplan–Meier method and calculated from the day of treatment initiation until the day of disease progression or death or until the day of death, respectively. 80 patients who were evaluable in terms of HPTMs concentrations and radiological responses during sorafenib treatment were included in the longitudinal biomarker analysis; five patients were excluded because of lack of most clinical, laboratory or survival data.
Sample processing & biomarkers
One 6-ml vial with EDTA and one 6-ml vial with coagulation activator were collected at each time point to obtain serum and plasma for storage in 2-ml Eppendorf Tubes (Eppendorf, Hamburg, Germany) and preserved at -80°C. The 85 samples were measured by specific ELISA assays for nucleosomes containing H3 and the canonical H3.1 variant (Active Motif, CA, USA) as well as H3K27me3 and H3K36me3 (prototype Nu.Q™ assays) at The Open University, London, UK. Assays were performed according to the manufacturers’ instructions and displayed selectivity for the specific histone variant or post-translational modification using a range of recombinant nucleosomes. The kits enable detection and quantification of nucleosomes in serum or plasma [Citation34].
Statistical analysis
Analyses of biomarker levels as well as activity and efficacy were performed for patients who received ≥1 cycle of sorafenib. Clinical nominal variables were described as frequencies and compared across different biomarker level groups through Chi-square test. Continuous AFP values were dichotomized according to the literature cut-off (≥400 vs <400 ng/ml) [Citation4]. H3, H3.1, H3K27me3, H3K36me3 and H3K27me3/H3K36me3 ratios were described using their mean, median and range values and were treated as continuous variables using rank-sum test and as dichotomous with respect to their median values since they were not normally distributed. The predictive value of epigenetic markers was tested with chi-square and rank-sum tests, and their prognostic role in terms of PFS and OS was estimated using the Kaplan–Meier method and compared with the logrank test. A multivariate Cox proportional hazards model was built to identify predictors of outcome; only factors with a two-sided p < 0.05 were included. With regard to on-treatment comparison of biomarker concentrations, two time point confrontation (i.e., baseline vs BR; baseline vs PD; BR vs PD) was performed with Wilcoxon signed-rank test or paired t-test for not normally and normally distributed differences, respectively. Statistical software used was MedCalc version 14.8.1 (MedCalc Software Ltd, Oostende, Belgium) and SciPy 1.0.
Results
Bioinformatics analysis: EZH2 & SETD2 expression profiles & prognostic role
To confirm the relevance of the genes of interest, the authors analyzed a public dataset to measure expression of EZH2 and SETD2 in 371 HCC samples versus 50 adjacent normal tissues [Citation22]. Both transcripts were significantly upregulated in HCC (p < 0.0001) (A & B). To develop a systematic understanding of the similarities between EZH2 and SETD2, the authors used correlation analysis of co-expressed genes in EZH2 and SETD2. EZH2 had 36 co-expressed genes with a higher regression value (R2 >50), and SETD2 had nine co-expressed genes with a higher regression value (R2 >50). No common genes were co-expressed, as plotted with a Venn diagram (R2 >50) (C). Next, a pathway analysis was performed to identify EZH2 and SETD2 co-expressed genes. EZH2 co-expressed genes were involved in pathway activities such as cell cycle, M phase and cell cycle checkpoints (D), whereas SETD2 co-expressed genes were involved in chromatin modification and chromatin-modifying enzyme activities. Subsequently, the authors investigated the prognostic relevance of these two transcripts in patients exposed to sorafenib. The authors’ results showed that higher expression of EZH2 was associated with worse prognosis, whereas higher expression of SETD2 was associated with better prognosis (E & F). Notably, the EZH2/SETD2 ratio was more precise than either gene alone in determining prognosis with sorafenib (p = 0.0031) (G).
(A) EZH2 and (B)SETD2 expression in HCC and normal tissues. (C)EZH2 and SETD2 co-expressed genes. (D) Functional pathway map of co-expressed EZH2 and SETD2 genes. Correlation of (E)EZH2, (F)SETD2 and (G)EZH2/SETD2 with OS.
***p < 0.05.
HCC: Hepatocellular carcinoma; HR: Hazard ratio; OS: Overall survival; TCGA: The Cancer Genome Atlas.
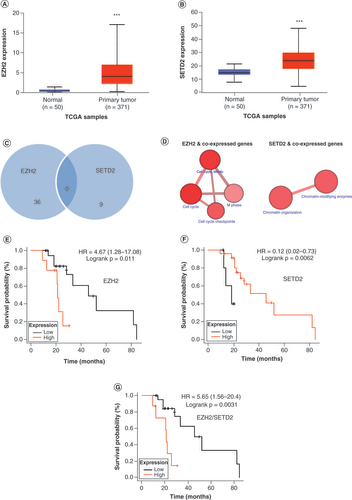
Taken together, these results indicate that both EZH2 and SETD2 are selectively upregulated in HCC. However, intratumoral EZH2 expression is associated with worse response to sorafenib, whereas intratumoral SETD2 expression is associated with sensitivity to sorafenib.
Clinical cohort
After a median follow-up of 20.82 months (95% CI: 18.06–20.82), a median of 3.71 cycles of sorafenib was administered (95% CI: 2.98–5.42). Treatment interruption occurred at disease progression, with the exception of two patients who interrupted sorafenib 1 month earlier as the result of a therapeutic pause. At the time of observation, 93.7% of patients had progressed and 81.0% had died, with mPFS and mOS of 3.42 (95% CI: 2.76–4.93) and 11.41 (95% CI: 8.19–15.62) months, respectively. AFP median baseline values were 104.10 ng/ml (95% CI: 16.2–447.4). As expected based on the literature, AFP <400 ng/ml and Child–Pugh score A were significantly associated with OS (univariate analysis), with the former confirming its independent prognostic role in the Cox multivariate regression model (p = 0.04) [Citation35,Citation36].
Circulating histones: descriptive analysis
Descriptive statistics of circulating levels of H3K27me3 and H3K36me3 and total levels of histone H3 and H3.1 at different time points are shown in . The latter two epigenetic biomarkers were employed to corroborate the hypothesis that a specific histone modification, rather than total histone level, is associated with treatment response.
Table 1. H3, H3.1, H3K27me3, H3K36me3 and H3K27me3/H3K36me3 ratio descriptive statistics at studied time points.
Predictive & prognostic value of baseline circulating histones
Levels of epigenetic biomarkers at baseline did not show any predictive or prognostic value. Indeed, no association with PFS was observed for any of the biomarkers dichotomized according to median values. Similar results were obtained for OS. Results are summarized in . No correlations were found between BR or PD and biomarker baseline values (data not shown).
Table 2. Univariate analysis of overall and progression-free survival and H3, H3.1, H3K27me3, H3K36me3 and H3K27me3/H3K36me3 ratio baseline values.
Analysis of circulating histones in sorafenib responders versus nonresponders
H3.1, H3K27me3 and H3K36me3 levels significantly decreased from baseline to BR in matched samples for 21 responders (A–E).
Variations in (A) H3, (B) H3.1, (C) H3K27me3, (D) H3K36me3 and (E) H3K27me3/H3K36me3 ratio (K27/K36 ratio) from B to BR in responders. Variations in (F) H3, (G) H3.1, (H) H3K27me3, (I) H3K36me3 and (J) H3K27me3/H3K36me3 ratio (K27/K36 ratio) from B to PD in all evaluable patients. (E & J) Because of the high dynamic range of values for the H3K27me3/H3K36me3 ratio plot, a mixed linear/log scale was used for the y-axis. Fold change obtained as median biomarker value at BR or PD/median biomarker value at B. Data compared using Wilcoxon signed-rank or paired t-test.
B: Baseline; BR: Best response; PD: Progressive disease.
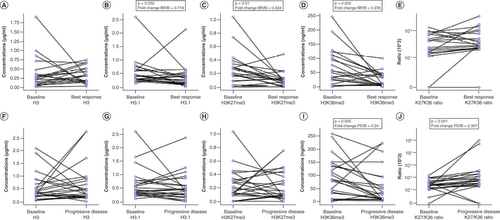
Among 17 matched nonresponder samples, the authors observed that H3K36me3 and H3K27me3/H3K36me3 ratio varied significantly, with the former decreasing (median: 83.6 vs 35.9 ng/ml; p = 0.08) and the latter increasing (median: 0.002 vs 0.005 ng/ml; Wilcoxon signed-rank test: p = 0.0001).
Circulating histones at sorafenib failure
24 patients were evaluable at baseline and PD irrespective of best response. In this case, the authors’ longitudinal analysis (baseline vs failure) revealed results that were similar to those observed in the nonresponder cohort. H3K36me3 levels were significantly reduced (mean: 89.4 vs 55.2 ng/ml; p = 0.005), and the H3K27me3/H3K36me3 ratio was significantly increased from baseline to PD (median: 0.002 vs 0.005 ng/ml; p = 0.001), reinforcing the hypothesis of a biologically antagonistic role between these two histone marks (F–J).
H3K27me3/H3K36me3 ratio as a prognostic biomarker
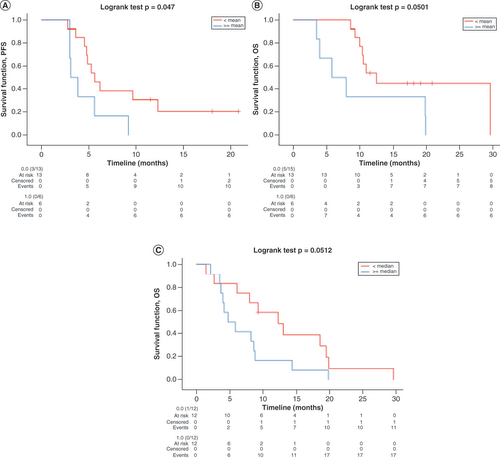
In light of these results, the authors sought to explore the prognostic role of H3K27me3/H3K36me3 ratio at BR and PD. H3K27me3/H3K36me3 ratio values were dichotomized according to their median and mean at each time point and tested against PFS and OS with Kaplan–Meier plots. At BR, no statistical significance was found for H3K27me3/H3K36me3 ratio based on its median value cut-off of 0.003 (mPFS < vs ≥ median: 5.6 vs 4.7 months; p = 0.14; mOS < vs ≥ median: 12.5 vs 10.3 months; p = 0.25). However, significantly longer PFS and OS were found for H3K27me3/H3K36me3 ratio values lower than the mean value of 0.0065 (mPFS < vs ≥ mean: 5.6 vs 3.1 months; p < 0.05; mOS < vs ≥ mean: 12.5 vs 5.8 months; p = 0.05), confirming the negative prognostic role of this marker. The same analyses were performed at PD, where the prognostic role of H3K27me3/H3K36me3 ratio was confirmed for OS with respect to its median value of 0.005 (mOS < vs ≥ median: 12.3 vs 4.7 months; p = 0.05). Because of the numerosity difference of the two groups (22 vs 2), no survival analyses were performed at PD with respect to H3K27me3/H3K36me3 ratio mean value. Receiver operating characteristic curves were conducted to confirm the prognostic ability of different H3K27me3/H3K36me3 ratio cut-offs, and stratification of mean H3K27me3/H3K36me3 ratio at BR was confirmed (area under the curve = 0.76; p = 0.04). Kaplan–Meier curves for statistically significant survival results are shown in .
Kaplan–Meier curves for (A) PFS according to H3K27me3/H3K36me3 ratio mean values at BR, (B) OS according to H3K27me3/H3K36me3 ratio mean values at BR and (C) OS according to H3K27me3/H3K36me3 ratio median values at PD. Data for all curves compared using log rank test.
BR: Best response; OS: Overall survival; PD: Progressive disease; PFS: Progression-free survival.
Discussion
The authors have identified the histone H3K27me3/H3K36me3 ratio as a potentially noninvasive predictive biomarker for HCC patients treated with sorafenib. In the nucleus of a cell, histones constitute the core of the nucleosome, which is the structural unit of eukaryotic chromatin [Citation37]. Each histone has a long N-terminal tail, which can be modified by acetylation, methylation and other HPTMs. These modifications are catalyzed by epigenetic enzymes, which control gene expression. Many epigenetic enzymes are deregulated in cancer [Citation38]. The authors’ bioinformatics analyses show that the epigenetic enzymes catalyzing both H3K27me3 (EZH2) and H3K36me3 (SETD2) are significantly upregulated in HCC versus non-neoplastic tissues. Previous studies have indicated that EZH2 is a driver of sorafenib resistance in HCC [Citation14], whereas SETD2 seems to antagonize the biological effects of EZH2 [Citation13]. In line with this model, the authors have found that EZH2 and SETD2 intratumoral expression levels have opposite prognostic significance in HCC patients exposed to sorafenib. Interestingly, the EZH2/SETD2 ratio predicts survival outcomes more accurately than either gene alone. Consistent with the authors’ observations, such an antagonistic relationship between these two epigenetic regulators also held true for a prostate cancer mouse model, in which SETD2 downregulation resulted in increased levels of EZH2 and tumor metastatic potential via a polycomb-repressed chromatin state [Citation39].
Nucleosomes are released in the circulation as a consequence of necrosis and apoptosis [Citation40]. Cancerous tissues release nucleosomes at higher rates as a result of increased cell turnover [Citation41]. It has therefore been proposed that circulating nucleosomes and histone modifications could be used as diagnostic, predictive and prognostic biomarkers. Therefore, the authors decided to examine the possibility that H3K27me3 and H3K36me3 plasma ratio levels are readout of EZH2 and SETD2 activity in HCC. In line with this hypothesis, the authors observed that circulating levels of both H3K27me3 and H3K36me3 were significantly decreased in patients with reduced tumor mass (best response). More interestingly, the H3K27me3/H3K36me3 ratio at best response predicted patient survival and was significantly increased at tumor progression. These observations are in line with the authors’ original biological hypothesis; namely, that EZH2 drives sorafenib resistance, whereas SETD2 plays an opposite role.
This study has some limitations. First, confirmation of the authors’ results should be obtained in larger cohorts, particularly with regard to longitudinal analyses of serial samples collected from the same patient during treatment. Second, subsequent studies should clarify whether the H3K27me3/H3K36me3 ratio also predicts benefit from salvage tyrosine kinase inhibitors (e.g., regorafenib or cabozantinib). Finally, it would be of interest to explore circulating H3K27me3/H3K36me3 in patients receiving alternative first-line therapies (e.g., lenvatinib and, primarily, atezolizumab plus bevacizumab). The authors have previously predicted that EZH2 activity could be associated with response to immune checkpoint inhibitors [Citation42].
The authors’ study also has some strengths. The OS observed reflects that reported in clinical trials. This means that second-line drugs had limited impact, so the correlation between putative biomarkers and outcome is not confounded by the effect of additional therapies. Moreover, serial sampling from single patients allows for monitoring of the biomarker during treatment, thus strengthening the association with drug efficacy. Finally, measuring circulating HPTMs in peripheral blood offers the advantage of a noninvasive technique that is able to anticipate the course of the disease even when tumor tissue is lacking, as often occurs in HCC.
Conclusion
To our knowledge, we have reported the first clinical observation of the predictive role of circulating levels of H3K27me3, H3K36me3 and H3K27me3/H3K36me3 ratio in advanced HCC patients treated with sorafenib, shedding light on the value of these biomarkers in monitoring systemic treatment and pointing out the opportunity to prospectively explore such soluble epigenetic biomarkers in future therapeutic strategies.
Future perspective
The study of epigenetics for oncological applications is becoming more and more promising in oncology. Within this framework, our results suggest that the epigenetic regulators EZH2 and SETD2 play a role in HCC prognosis and that their corresponding readouts, H3K27me3, H3K36me3 and H3K27me3/H3K36me3 ratio, act as predictive factors for first-line sorafenib treatment outcomes. Since the identification of predictive factors for treatment outcomes represents the most promising strategy for treatment personalization, we plan to test the predictive value of H3K27me3/H3K36me3 ratio with regard to different therapeutic modalities for HCC, such as other first- and further-line tyrosine kinase inhibitors (e.g., lenvatinib and regorafenib) and the new standard of care – combination atezolizumab/bevacizumab.
Treatments for advanced hepatocellular carcinoma lack predictive biomarkers.
Epigenetics modifications, underpinning cancer plasticity, may provide biomarkers for hepatocellular carcinoma treatments.
Both EZH2 and SETD2 are significantly upregulated in hepatocellular carcinoma versus normal tissue.
EZH2/SETD2 is a negative prognostic marker for sorafenib in bioinformatics data.
EZH2/SETD2 confirmed its role in the authors’ experimental setting.
Author Contributions
F Crea, L Fornaro and F Salani designed the study. I Pecora, F Salani, V Massa, A Casadei-Gardini, G Marisi, M Canale and P Ulivi collected samples and patient data. M Latarani performed the experiments. P Gangadharannambiar performed bioinformatics analysis. F Salani performed statistical analysis. F Salani, P Gangadharannambiar and F Crea designed the figures. G Marisi provided part of the funding. F Crea, L Fornaro, M Eccleston and F Salani interpreted the data. All authors revised the manuscript.
Ethical conduct of research
The study followed the principles outlined in the Declaration of Helsinki for all human or animal experimental investigations. Enrolled patients signed specific informed consent forms for blood draw and related translational research projects as part of INNOVATE trial participation, approved by the Comitato Etico Area Vasta Nord Ovest ethics committee of Pisa University Hospital and by Modena Institution one.
Acknowledgments
The authors thank all patients who gave their consent to the present trial. The authors also thank the university institutions they belong to for supporting the development of the project.
Financial & competing interests disclosure
This study was funded by university research grants to G Masi from the University of Pisa and by a Higher Education Innovation Fund grant for industrial collaboration. The authors have no other relevant affiliations or financial involvement with any organization or entity with a financial interest in or financial conflict with the subject matter or materials discussed in the manuscript apart from those disclosed.
No writing assistance was utilized in the production of this manuscript.
Data sharing statement
The datasets used or analyzed in the current study are available from the first author and corresponding author upon reasonable request.
Additional information
Funding
References
- Singal AG , LamperticoP , NahonP. Epidemiology and surveillance for hepatocellular carcinoma: new trends. J. Hepatol.72(2), 250–261 (2020).
- Bray F , FerlayJ , SoerjomataramI , SiegelRL , TorreLA , JemalA. Global cancer statistics 2018: GLOBOCAN estimates of incidence and mortality worldwide for 36 cancers in 185 countries. CA Cancer J. Clin.68(6), 394–424 (2018).
- Associazione Italiana di Oncologia Medica . Linee guida epatocarcinoma (2020). www.aiom.it/linee-guida-aiom-2020-epatocarcinoma/
- Llovet JM , RicciS , MazzaferroVet al. Sorafenib in advanced hepatocellular carcinoma. N. Engl. J. Med.359(4), 378–390 (2008).
- Kudo M , FinnRS , QinSet al. Lenvatinib versus sorafenib in first-line treatment of patients with unresectable hepatocellular carcinoma: a randomised phase 3 non-inferiority trial. Lancet391(10126), 1163–1173 (2018).
- Finn RS , QinS , IkedaMet al. Atezolizumab plus bevacizumab in unresectable hepatocellular carcinoma. N. Engl. J. Med.382(20), 1894–1905 (2020).
- Piñero F , DirchwolfM , PessôaMG. Biomarkers in hepatocellular carcinoma: diagnosis, prognosis and treatment response assessment. Cells9(6), 1370 (2020).
- Reig M , TorresF , Rodriguez-LopeCet al. Early dermatologic adverse events predict better outcome in HCC patients treated with sorafenib. J. Hepatol.61(2), 318–24 (2014).
- Granito A , MarinelliS , NegriniG , MenettiS , BeneventoF , BolondiL. Prognostic significance of adverse events in patients with hepatocellular carcinoma treated with sorafenib. Ther. Adv. Gastroenterol.9(2), 240–249 (2016).
- Arechederra M , RecaldeM , Gárate-RascónM , Fernández-BarrenaMG , ÁvilaMA , BerasainC. Epigenetic biomarkers for the diagnosis and treatment of liver disease. Cancers (Basel)13(6), 1265 (2021).
- Khemlina G , IkedaS , KurzrockR. The biology of hepatocellular carcinoma: implications for genomic and immune therapies. Mol. Cancer16(1), 149 (2017).
- Audia JE , CampbellRM. Histone modifications and cancer. Cold Spring Harb. Perspect. Biol.8(4), a019521 (2016).
- Yuan W , XuM , HuangC , LiuN , ChenS , ZhuB. H3K36 methylation antagonizes PRC2-mediated H3K27 methylation. J. Biol. Chem.286(10), 7983–7989 (2011).
- Wang S , CaiL , ZhangF , ShangX , XiaoR , ZhouH. Inhibition of EZH2 attenuates sorafenib resistance by targeting NOTCH1 activation-dependent liver cancer stem cells via NOTCH1-related microRNAs in hepatocellular carcinoma. Transl. Oncol.13(3), 100741 (2020).
- Kusakabe Y , ChibaT , OshimaMet al. EZH1/2 inhibition augments the anti-tumor effects of sorafenib in hepatocellular carcinoma. Sci. Rep.11(1), 21396 (2021).
- Li H , AnJ , WuMet al. LncRNA HOTAIR promotes human liver cancer stem cell malignant growth through downregulation of SETD2. Oncotarget6(29), 27847–27864 (2015).
- Li XJ , LiQL , JuLGet al. Deficiency of histone methyltransferase SET domain-containing 2 in liver leads to abnormal lipid metabolism and HCC. Hepatology. 73(5), 1797–1815 (2021).
- Bauden M , PamartD , AnsariDet al. Circulating nucleosomes as epigenetic biomarkers in pancreatic cancer. Clin. Epigenetics7(1), 106 (2015).
- Rahier JF , DruezA , FaugerasLet al. Circulating nucleosomes as new blood-based biomarkers for detection of colorectal cancer. Clin. Epigenetics9, 53 (2017).
- Guiot J , StrumanI , ChavezVet al. Altered epigenetic features in circulating nucleosomes in idiopathic pulmonary fibrosis. Clin. Epigenetics9, 84 (2017).
- Verhoeven JGHP , BaanCC , PeetersAMAet al. Circulating cell-free nucleosomes as biomarker for kidney transplant rejection: a pilot study. Clin. Epigenetics13(1), 32 (2021).
- University of Alabama at Birmingham . The University of Alabama at Birmingham Cancer data analysis portal. http://ualcan.path.uab.edu/index.html
- Chandrashekar DS , BashelB , BalasubramanyaSAHet al. UALCAN: a portal for facilitating tumor subgroup gene expression and survival analyses. Neoplasia19(8), 649–658 (2017).
- National Cancer Institute . The Cancer Genome Atlas Program (2018). www.cancer.gov/about-nci/organization/ccg/research/structural-genomics/tcga
- MET500. https://met500.med.umich.edu/
- Office of Cancer Clinical Proteomics Research . Data portal. https://proteomics.cancer.gov/data-portal
- KMplot . Kaplan-Meier plotter. http://kmplot.com/analysis
- Nguyen TN , NguyenHQ , LeDH. Unveiling prognostics biomarkers of tyrosine metabolism reprogramming in liver cancer by cross-platform gene expression analyses. PLoS ONE15(6), e0229276 (2020).
- Broad Institute . Broad GDAC Firehose. https://gdac.broadinstitute.org/
- Herwig R , HardtC , LienhardMet al. Analyzing and interpreting genome data at the network level with ConsensusPathDB. Nat. Protoc.11, 1889–1907 (2016).
- Kamburov A , StelzlU , LehrachH , HerwigR. The ConsensusPathDB interaction database: 2013 update. Nucleic Acids Res.41(Database issue), D793–D800 (2013).
- Casadei-Gardini A , MarisiG , DadduzioVet al. Association of NOS3 and ANGPT2 gene polymorphisms with survival in patients with hepatocellular carcinoma receiving sorafenib: results of the multicenter prospective INNOVATE study. Clin. Cancer Res.26(17), 4485–4493 (2020).
- Response Evaluation Criteria in Solid Tumors . RECIST 1.1. https://recist.eortc.org/recist-1-1-2/
- Wilson-Robles H , MillerT , JarvisJet al. Evaluation of nucleosome concentrations in healthy dogs and dogs with cancer. PLoS ONE15(8), e0236228 (2020).
- Bruix J , ChengA , MeinhardtG , NakajimaK , SanctisYD , LlovetJ. Prognostic factors and predictors of sorafenib benefit in patients with hepatocellular carcinoma: Analysis of two phase III studies. J Hepatol. 67(5), 999–1008 (2017).
- Durand F , VallaD . SurnameFN Assessment of the prognosis of cirrhosis: Child-Pugh versus MELD. J Hepatol. 42(Suppl. 1), S100–7 (2005).
- Crea F , ClermontPL , MaiA , HelgasonCD. Histone modifications, stem cells and prostate cancer. Curr. Pharm. Des.20(11), 1687–1697 (2014).
- Gopi LK , KidderBL. Integrative pan cancer analysis reveals epigenomic variation in cancer type and cell specific chromatin domains. Nat. Commun.12(1), 1419 (2021).
- Yuan H , HanY , WangXet al. SETD2 restricts prostate cancer metastasis by integrating EZH2 and AMPK signaling pathways. Cancer Cell38(3), 350–365.e7 (2020).
- Jahr S , HentzeH , EnglischSet al. DNA fragments in the blood plasma of cancer patients: quantitations and evidence for their origin from apoptotic and necrotic cells. Cancer Res.61(4), 1659–1665 (2001).
- McAnena P , BrownJAL , KerinMJ. Circulating nucleosomes and nucleosome modifications as biomarkers in cancer. Cancers (Basel)9(1), 5 (2017).
- Kang N , EcclestonM , ClermontPLet al. EZH2 inhibition: a promising strategy to prevent cancer immune editing. Epigenomics12(16), 1457–1476 (2020).