
Abstract
Aim: Determine if the association of HIF3A DNA methylation with weight and adiposity is detectable early in life. Material & methods: We determined HIF3A genotype and DNA methylation patterns (on hybridization arrays) in DNA extracted from umbilical cords of 991 infants. Methylation levels at three CpGs in the HIF3A first intron were related to neonatal and infant anthropometry and to genotype at nearby polymorphic sites. Results & conclusion: Higher methylation levels at three previously described HIF3A CpGs were associated with greater infant weight and adiposity. The effect sizes were slightly smaller than those reported for adult BMI. There was also an interaction within cis-genotype. The association between higher DNA methylation at HIF3A and increased adiposity is present in neonates. In this study, no particular prenatal factor strongly influenced HIF3A hypermethylation. Our data nonetheless suggest shared prenatal influences on HIF3A methylation and adiposity.
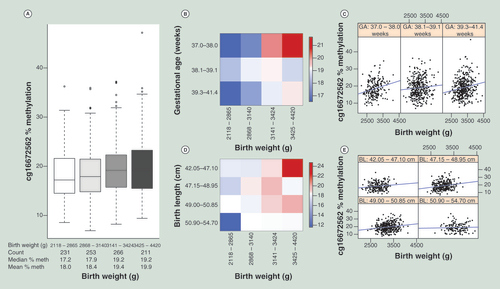
(A) Box plot of birth weight (horizontal axis) binned into four bins of equal numbers of unique values, against % methylation at cg16672562 (vertical axis). Number of individual data points, median and mean % methylation of each bin is displayed in the table below the horizontal axis. (B) Heatmap displaying % methylation at cg16672562, maximum, medium and minimum methylation are shown in red, white and blue, respectively. Subjects are split by binned (four bins of equal number of unique values) birth weight (horizontal axis) and binned (four bins of equal number of unique values, last two bins are combined as there are few observations in the last bin) gestational age (vertical axis). The progression from blue to red (low to high methylation) as birth weight increases (left to right) is visible in each gestational age bin (top to bottom). (C) Scatter plots of birth weight (horizontal axis) against % methylation at cg16672562 (vertical axis), each panel displays data for binned gestational ages (four bins of equal number of unique values, last two bins are combined as there are few observations in the last bin), ranges for each bin are displayed in panel headers. (D) Heatmap displaying % methylation at cg16672562, maximum, medium and minimum methylation are shown in red, white and blue, respectively. Subjects are split by binned (four bins of equal number of unique values) birth weight (horizontal axis) and binned (four bins of equal number of unique values) birth length (vertical axis). The progression from blue to red (low to high methylation) as birth weight increases (left to right) is visible in each birth length bin (top to bottom). (E) Scatter plots of birth weight (horizontal axis) against % methylation at cg16672562 (vertical axis), each panel displays data for binned (four bins of equal number of unique values) birth length, ranges for each bin are displayed in panel headers.
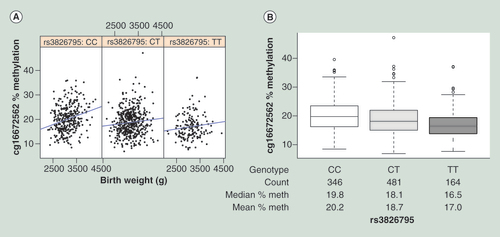
(A) Scatter plots of birth weight (horizontal axis) against % methylation at cg16672562 (vertical axis), each panel displays data for each genotype. (B) Box plot of rs3826795 genotype (horizontal axis) against % methylation at cg16672562 (vertical axis). Number of individual data points, median and mean % methylation of each bin is displayed in the table below the horizontal axis.
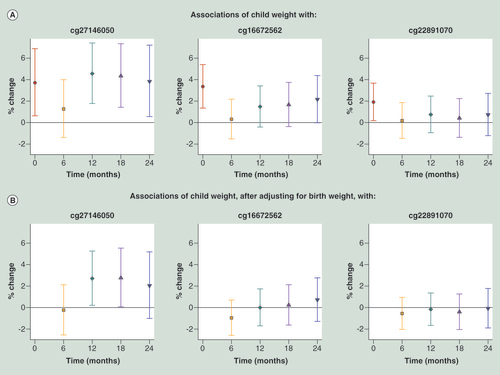
(A) Without adjusting for birth weight. (B) Adjusted for log-transformed birth weight. Regression coefficients (Est.) and 95% CI are reported as percentage change in child weight for 10% increase in methylation level. p-values are two-sided. Using linear regression models estimated using generalized estimating equations to account for repeated measures, we regressed log-transformed weight against methylation at each CpG site, adjusting for fixed effects of time, child sex, ethnicity, cell type proportions and interactions between ethnicity and proportions. Time was coded using a binary variable for each distinct time point and interaction terms of time with all variables (methylation, child sex, ethnicity, cell type proportions and interactions between ethnicity and proportions) were included.
DNA methylation states at particular loci have been associated with a range of disease states and environmental exposures. It is desirable to know whether particular DNA methylation changes occur before disease symptoms or after as a consequence of the disease, as epigenetic biomarkers have been suggested as a way of tracking developmental trajectories to disease [Citation1].
A large epigenome-wide association study (EWAS) with replication in two independent cohorts reported that methylation levels at three CpGs in the first intron of the hypoxia inducible factor 3A (HIF3A) locus were positively associated with BMI in adult Caucasian whole blood and adipose tissue [Citation2]. The finding has since been independently replicated [Citation3]. The authors postulated that HIF3A has a role in acquired obesity, perhaps in regulating adipocyte differentiation.
There is considerable evidence of developmental pathways to obesity [Citation4–7], beginning before birth and at least partly mediated by epigenetics [Citation8–10]. Factors acting prenatally may affect methylation levels at particular loci, which in turn affect transcription and phenotype later in life [Citation1]. Birth weight is often used as a surrogate for the quality of the in utero environment and both low and high birth weights are associated with an increased risk of obesity and metabolic syndrome [Citation11,Citation12]. An association of birth weight or neonatal adiposity with HIF3A methylation at birth would be compatible with the developmental origins of obesity hypothesis. The effects of the prenatal environment on the epigenome could be genotype dependent [Citation13] as we have previously found that umbilical cord methylation levels can associate with various in utero environmental factors in interaction with infant genotype [Citation14]. HIF3A methylation was shown to associate with cis-genotype but the genotype was not associated with adult BMI [Citation2].
The present study has three objectives. First, we tested if HIF3A gene methylation levels in umbilical cords were associated with birth size (weight and length) and adiposity. Second, due to the strong association between cis-SNPs and methylation within the HIF3A locus, we studied if the association of methylation with birth weight is independent of cis-genotype. Third, we sought to identify prenatal environmental variables associated with both birth weight and HIF3A methylation.
Materials & methods
Study population
Mother–offspring pairs in our study were drawn from the Growing Up in Singapore towards Healthy Outcomes (GUSTO) birth cohort [Citation15]. Women aged at least 18 years were prospectively recruited from the KK Women’s and Children’s Hospital (KKH) and the National University Hospital (NUH) in Singapore during their first trimester of pregnancy. Written informed consent was obtained. The GUSTO study was approved by the ethics boards of both KKH and NUH. To be eligible, women had to hold Singapore citizenship or permanent residency, intended to reside in Singapore for the next 5 years, were of Chinese, Malay or Indian ethnicity, had homogeneous parental ethnic background and had the intention of delivering at either NUH or KKH. Women who were on chemotherapy, psychotropic drugs or had diabetes mellitus were ineligible. Interviewer-administered questionnaires were used to obtain demographic, medical and obstetric data to assess eligibility. Multiple pregnancies, preterm and intrauterine growth restriction births were excluded from this analysis. There were 1052 live singleton births after excluding 124 preterm and intrauterine growth restriction births. This analysis used 991 offspring with complete information available on HIF3A methylation at three sites (cg27146050, cg16672562, cg22891070), genotype at two cis-SNPs (rs8102595 and rs3826795) and at least one anthropometric outcome.
Offspring anthropometry
Offspring weight and recumbent length were measured at birth, 6, 12, 18 and 24 months of age. Weight was measured using a calibrated infant scale (SECA 334 Weighing Scale, SECA Corp) and recorded to the nearest gram. Length was measured using a SECA infant mat (SECA 210 Mobile Measuring Mat, SECA Corp) and recorded to the nearest 0.1 cm. Measurements were taken in duplicates for reliability. BMI was derived as weight (g) divided by length2 (cm2) at all time points. Subscapular and triceps skinfolds were measured at birth, 18 and 24 months and taken in triplicates using Holtain skinfold calipers (Holtain Ltd, Crymych, UK) on the right side of the body, recorded to the nearest 0.2 mm. Subscapular to triceps skinfold ratio was derived by dividing subscapular skinfold (mm) by triceps skinfold (mm).
Prenatal environmental exposures
An interviewer-administered questionnaire was conducted at 26–28 weeks of gestation to obtain information on occupational activity during pregnancy, exercise during pregnancy, alcohol usage before and during pregnancy and smoking patterns before and during pregnancy (Supplementary File 1). Maternal height and weight were measured during the same time period. Prepregnancy weight was self-reported during study recruitment in the first trimester of pregnancy. Pregnancy weight gain was calculated as the difference between prepregnancy and 26–28-week weights. Maternal prepregnancy BMI was derived as prepregnancy weight divided by height squared. Maternal glucose levels, indicative of gestational diabetes, (2 h postglucose and fasting) were ascertained at 26–28 weeks using an oral glucose tolerance test (OGTT) of 75 g after overnight fasting (8–10 h). Information on maternal glucose levels (2 h postglucose and fasting) were available for 922 subjects. Using the 1999 WHO standard criteria (≥7.8 mmol/l for 2 h postglucose and/or ≥7.0 mmol/l for fasting glucose), 162 out of 922 subjects would be diagnosed as having gestational diabetes in this group. Maternal plasma micronutrient levels, including vitamin D, vitamin B12, copper, iron, zinc and folate, were tested using serum drawn at 26–28 weeks of gestation. Birth order and mode of delivery were abstracted from hospitals’ medical records.
Methylation & genotyping data
Bisulfite-converted gDNA from umbilical cords was interrogated on Infinium® Human Methylation 450 Bead Chip arrays [Citation16] as per manufacturer’s instructions and as described previously [Citation14]. Data were processed as previously described [Citation17]. Briefly, signal extraction was performed in GenomeStudio™ Methylation Module and raw values were extracted. Probes with data from two beads or fewer for any sample, or with signal detection p-values (calculated from signal vs background of the individual bead intensities) greater than 0.01, for any sample, were discarded for all samples. The green and red channel signals were normalized and the background signal from the negative probe control values was removed. Probe β-values or % methylation values were derived from the data. β-values are the ratio of the methylated probe intensity and the overall intensity, β-value for an ith interrogated CpG site:Equation 1
where yi,methy and yi,unmethy are the intensities measured by the ith methylated and unmethylated probes, respectively, averaged over the replicate beads; a is a constant offset, which is by default 100. Therefore, β-values range between 0 and 1 with 0 representing no methylation and 1 representing 100% methylation. β-values were further processed to scale the % methylation range of the type 2 probes to the type 1 probes using the procedure suggested by [Citation18]. All data from the sex chromosomes were removed and the remaining data were subjected to quantile normalization. As part of the experimental design, subjects were randomized such that key variables (birth weight, child sex, ethnicity, gestational age) were randomly distributed across batch/chip/position. Batch effects were observed between different runs in the processed data and removed by a commonly used empirical Bayes method known as COMBAT [Citation19]. Even though chip/position were associated with the three HIF3A methylation sites in question (Supplementary Table 1), chip/position were not associated with any of the six neonatal outcomes studied in this report (Supplementary Table 2) due to experimental design. As chip/position were associated only with the independent variable (methylation) but not the outcome, this minimizes confounding bias due to chip/position.
The same umbilical cord DNA samples were genotyped using the Illumina Omniexpress + exome arrays. Genotyping was performed by the service provider, Expression Analysis Inc. Data were processed in Genome Studio Genotyping Module™. Genotyping calls were made by the Gen Call software, which incorporates a clustering algorithm (GenTrain) and a calling algorithm (Bayesian model). Gen Call score of each single nucleotide polymorphism (SNP) probe and call rate of each sample are generated. Genotypes with a Gen Call score less than 0.15 were not considered.
Accounting for cellular heterogeneity from methylation data
Umbilical cord tissue consists of a mixture of cell types with differing epigenetic profiles. To control for cellular heterogeneity in our samples, we applied three methods: one requiring a reference panel of methylation levels in discrete cell types [Citation20] and two reference-free methodologies [Citation21,Citation22]. For the former, we estimated the proportion of fibroblasts, B cells and T cells using a reference panel’s cell-specific methylation profiles [Citation20]. The methylation dataset obtained from EMBL-EBI European Genome-Phenome Archive [Citation23] under accession number EGAD00010000460 was used as our reference panel [Citation24]. The estimated cell fractions were then adjusted as covariates in the regression models. Interestingly, the associations between the estimated cellular proportions and child anthropometry were generally ethnic-dependent (Supplementary Tables 3 & 4). Therefore, interaction terms between cellular proportions and ethnicity were included in all regression models. As a sensitivity analysis, we also applied two reference-free methods [Citation21,Citation22] to investigate the association between methylation levels at HIF3A and log-transformed child anthropometric measures, adjusting for infant sex and ethnicity. Leek et al. [Citation22] estimates surrogate variables which capture cellular heterogeneity, the surrogate variables are then adjusted as covariates in regression analysis. We note that this sensitivity analysis using Leek et al. [Citation22] would also act to adjust for residual unknown confounding effects, including chip/position effects since the estimated surrogate variables can potentially capture both cellular heterogeneity and residual batch/chip/position effects [Citation21,Citation25–27]. The method proposed by Houseman et al. [Citation21] is similar to the surrogate variable analysis proposed by Leek et al. [Citation22] with an additional biological mixing assumption. Houseman et al. [Citation21] correct the cellular heterogeneity without explicitly estimating the relative cell proportions or returning the surrogate variables.
Statistical analysis
Linear regression models were used to examine the association of child anthropometric measures with HIF3A methylation β-values, with adjustment for child sex, ethnicity, cellular composition and interactions between ethnicity and cellular proportions. Child anthropometric measures were log-transformed to satisfy statistical assumptions of normality. Due to the log-transformation, effect sizes are reported as percentage increase in child outcome for 10% increase in methylation β-values. As a sensitivity analysis, we also report results additionally adjusted for gestational age. To examine if the association between child anthropometry with HIF3A methylation were independent of cis-genotypes, we additionally adjusted for both cis-genotypes. To identify prenatal environmental exposures associated with both birth weight and HIF3A methylation, we regressed birth weight on various prenatal exposures, and adjusted for child sex and ethnicity. We further regressed HIF3A methylation on various prenatal exposures (and their interactions with genotype), adjusting for child sex, ethnicity, cellular composition and interactions between ethnicity and cellular proportions.
Results
HIF3A methylation in umbilical cords was positively associated with birth weight & adiposity
gives the characteristics of the 991 infants investigated in the current analysis. Higher umbilical cord HIF3A methylation level at all three CpGs was associated with greater infant birth weight ( & ), after adjusting for infant sex, ethnicity, estimated cellular proportions and interactions between ethnicity and cellular proportions [Citation20]. There were also significant associations with adiposity at birth measured by BMI and, for two of the three CpGs, by subscapular skinfold and the ratio of subscapular to triceps skinfold (thought to reflect fat deposition on the trunk rather than limbs [Citation28]) (). Similar results were obtained at two of the CpGs when we used reference-free methodologies [Citation21,Citation22] to account for cellular heterogeneity (Supplementary Tables 5 & 6). Despite the strong association between gestational age and birth weight in our dataset (r = 0.32; p < 0.0005), the associations of HIF3A methylation at all three CpGs with birth weight remained significant, after adjusting for gestational age (Supplementary Table 7). The association between methylation and birth weight was consistent across gestational age categories and was perhaps strongest in neonates with the earliest and latest gestational ages ( & C & Supplementary Table 8). Similarly, despite the strong correlation between birth weight and length in the dataset (r = 0.67; p < 0.0005), HIF3A methylation was not significantly associated with birth length and the association between methylation and birth weight was consistent across birth length categories ( & E), suggesting a link between HIF3A methylation and adiposity at birth rather than birth size in general.
For every 10% increase in methylation of cg27146050, cg16672562 and cg22891070, birth weight was 3.61% (95% CI: 0.68–6.63), 3.34% (1.4–5.32) and 2.05% (0.32–3.82) higher, respectively (). These effect sizes are slightly smaller than the corresponding effect estimates on adult BMI of 7.8% (5.1–10.4), 3.2% (2.0–4.4) and 3.6% (2.4–4.9), as previously reported [Citation2].
The association of HIF3A methylation & birth weight remained significant after adjusting for cis-acting SNPs; but birth weight & HIF3A methylation was more strongly correlated in one genotypic group
Using the same 991 GUSTO umbilical cord samples, we genotyped the SNPs identified as cis-influencing HIF3A methylation in the Dick et al.’s study [Citation2]. We found that rs8102595 and rs3826795 were strongly associated with methylation levels at all three CpGs sites (). However, neither SNP was associated with birth weight () and the associations of birth weight with methylation at all three sites were similar when adjusted for genotype at both SNPs (). This mirrors the findings of [Citation2]. We also tested if HIF3A methylation levels were explained by an interaction of HIF3A genotype and infant birth weight (adjusting for main effects of both genotype and infant birth weight), as we have previously found that neonatal methylation patterns are often a product of the interaction of the in utero environment and genotype. The interaction term was significant at p < 0.05 for two of the CpGs and rs3826795 (). In the CC genotype group, birth weight was more strongly correlated with HIF3A methylation ( & Supplementary Table 9). The CC genotype was also associated with higher methylation values at the HIF3A locus ( & ). This suggests the CC genotypic group could be more plastic to environmental exposures in utero.
The prenatal environmental variables examined were not consistently associated with HIF3A methylation & birth weight
As we hypothesized that HIF3A methylation and birth weight were related to the prenatal environment, we examined for significant associations with both HIF3A methylation and birth weight for a range of factors related to the prenatal environment, both as main effects and in interaction with HIF3A genotype. Factors investigated included antenatal lifestyle factors such as activity level and smoking, maternal prepregnancy BMI and pregnancy weight gain, maternal glucose tolerance during pregnancy indicative of gestational diabetes, maternal micronutrient levels, maternal age and parity (Supplementary File 1). There were some suggestive associations; for example, maternal glucose tolerance (indicative of gestational diabetes) was significantly associated with both HIF3A methylation at one of the CpGs and birth weight. Furthermore, maternal weight gain during pregnancy was significantly associated both with infant birth weight and HIF3A methylation (again at only one CpG) in interaction with genotype. However, we did not find any prenatal environmental variables that showed consistently significant association with all three HIF3A sites and birth weight and none yielded substantial effect sizes.
Discussion
We have extended the finding that HIF3A DNA methylation in adults associates with BMI [Citation2], to show that the link between HIF3A DNA methylation with weight and adiposity can be detected at birth. Interestingly, the association was limited to measures of adiposity (i.e., weight, BMI and skinfolds) and not other determinants of birth size or putative proxies for gestational quality such as gestational age and birth length. As such, the relationship of increased methylation at HIF3A CpGs with birth outcomes is reminiscent of the effect of maternal diseases, like Type 1 diabetes, on the offspring, whereby weight is increased, but length is not [Citation29].
Although pertaining to the same three CpGs within the HIF3A gene that were previously reported, our data were derived from a different tissue (umbilical cord vs blood and adipose), in a different population (Asian vs Caucasian), in a population-based cohort (normative range vs study population for metabolic disorders and controls) and most importantly at a different stage in the lifecourse (neonates vs adults). The effect size reported here are slightly smaller than those reported by Dick et al. [Citation2]. Reasons the effect sizes are smaller could be statistical, population dependent (our population are healthy babies, Dick et al. studied a disease cohort with a high level of obesity) or developmental (the effect is smaller at birth and increases during the lifecourse as adiposity increases).
Replicated positive associations such as the one described here can guide future hypotheis-free EWAS. Lack of statistical power is a big challenge in EWAS, especially in cohorts of modest size. The integration of effects of cellular heterogeneity, cis and trans genotype and the potential influence of pregnancy conditions is also challenging. Therefore, a detailed case study of a proposed association (HIF3A with adiposity replicated across populations and ages) is important. It will help set the standards for statistical replication and delineate the issues to consider when evaluating hits from more open-ended screening.
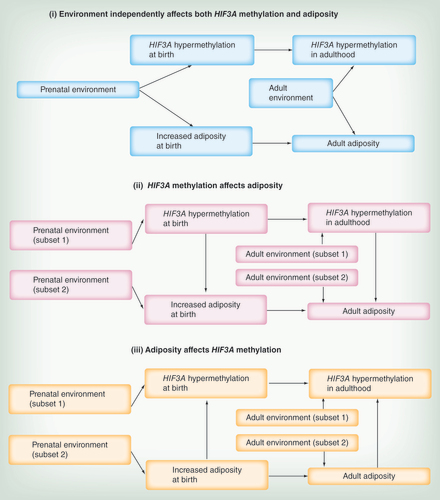
Dick et al. [Citation2] considered three possibilities that could explain the association between HIF3A methylation and adiposity in adults: (i) a confounding factor (e.g., environment) independently affects both HIF3A methylation and adiposity, (ii) increased HIF3A methylation causes increased adiposity and (iii) increased adiposity causes increased HIF3A methylation. To put our findings in neonates in context with the findings in adults, the same three simplified possible scenarios are schematically depicted in . We note that more complicated scenarios or combinations of these simplified situations are possible and likely.
Using a Mendelian randomization reasoning [Citation30] from the observation that HIF3A genotype was associated with HIF3A methylation but not adult BMI, Dick et al. [Citation2] suggested that scenario (iii; adiposity results in HIF3A hypermethylation) is more likely than scenario (ii; HIF3A hypermethylation leads to increased adiposity). However, in this context, Mendelian randomization assumes the genotype can affect the phenotype only through DNA methylation and not through other biological pathways. The applicability of this assumption is unknown for HIF3A genotype. We cannot confer causality in our dataset but following the same arguments, increased DNA methylation at the HIF3A locus could result from increased birth weight/adiposity and not cause it, but the aforementioned limitation also applies in our case.
Dick et al. considered scenario (i) less likely as they did not find an association between HIF3A methylation and BMI-related characteristics like diabetes. However, the absence of an association between HIF3A methylation and diabetes could also be due to the same confounding factor having a direct effect on glucose tolerance that is independent of increased adiposity. We postulate that scenario (i) could involve a prenatal environmental factor that independently affected both birth weight and HIF3A methylation. We also find that, as may be expected from other studies [Citation14,Citation31], interindividual variation in HIF3A methylation can be explained by an interaction of genotype and birth weight, suggesting there may be a genotype group (CC) particularly sensitive to gestational environment ( & ). However, in this study, we were unable to definitively identify a factor acting prenatally that is consistently associated with both HIF3A methylation and birth weight, despite the extensive dataset on pregnancy environments collected from the GUSTO cohort and examined in this study. Nevertheless, HIF3A methylation at birth after much further study, may prove to be a useful surrogate for likely metabolic trajectory determined by gestational environment [Citation32], and could be more useful than birth weight as it would be independent of the inherited genetic and environmental determinants of birth weight.
Transgenerational transmission of obesity and the importance of the very early environment in determining metabolic trajectories have been much studied [Citation33,Citation34]. If metabolic trajectory is programmed during gestation, a biomarker of likely trajectory would aid intervention [Citation1]. Birth weight has been shown to predict later weight [Citation35] and is strongly associated with later weight in the GUSTO cohort. Interestingly, HIF3A methylation levels at birth were also associated with weights at later ages, albeit possibly with slightly lower effect sizes ( & Supplementary Table 10). Only a few of the associations survive at borderline significance when adjusted for birth weight ( & Supplementary Table 11), thus the association of HIF3A methylation with later weights may reflect the growth trajectory set at birth. The ‘dip’ in the effect size at 6 months could be due to the effects of weaning or the decreased influence of genetic factors [Citation36,Citation37], although it is interesting to note that birth weight is more correlated with weight at 6 months than with weight at any of the other time points (Supplementary Tables 12 & 13).
Future studies should track both HIF3A methylation and offspring size and adiposity longitudinally during gestation, at birth, and at subsequent ages to determine if the association of HIF3A methylation with adiposity is consistent. As blood and adipose are invasive tissues to sample in infants, HIF3A methylation levels should be investigated in other tissue types such as saliva, buccal swabs or circulating fetal cells obtained prenatally. Longitudinal studies can help determine, if HIF3A is a biomarker for obesity risk and assess the utility of using HIF3A methylation to evaluate the efficacy of interventions such as lifestyle modification. Future studies should also examine the impact of HIF3A methylation changes on gene expression in relevant tissues. Dick et al. [Citation2] found a negative association between HIF3A methylation levels and HIF3A gene expression in adipose tissue. It is a limitation of our study that we cannot examine gene expression in a relevant tissue due to the unfeasibility of sampling adipose tissue in neonates or infants.
Conclusion
The association between increased DNA methylation at HIF3A and increased adiposity is present in neonates. This suggests HIF3A methylation is a potential biomarker for metabolic trajectory and/or implicated in metabolic syndrome and further study is warranted.
Table 1. Characteristics of participants in the GUSTO cohort studied in the analysis.
Table 2. Association between umbilical cord methylation at three sites in HIF3A and six neonatal anthropometric outcomes (weight, length, BMI, subscapular skinfold, triceps skinfold and ratio of subscapular to triceps skinfold) at birth.
Table 3. Association of two cis-single nucleotide polymorphisms (rs8102595, rs3826795) with methylation at three sites in HIF3A.
Table 4. Association between two cis-single nucleotide polymorphisms at the HIF3A locus (rs8102595, rs3826795) and birth weight.
Table 5. Association between umbilical cord methylation at three sites in HIF3A and six neonatal anthropometric outcomes (weight, length, BMI, subscapular skinfold, triceps skinfold, ratio of subscapular to triceps skinfold) at birth, adjusting for rs8102595 and rs3826795.
Table 6. Two-sided p-values from testing for interaction term between log-transformed birth weight and signle nucleotide polymorphism (rs8102595, rs3826795), with methylation as outcome, adjusting for main effect of log-transformed birth weight, main effect of single nucleotide polymorphism, child sex, ethnicity, cell type proportions and interactions between ethnicity and cell type proportions.
Introduction
Variation in DNA methylation between individuals is a product of influences from the environment and individual genetic backgrounds.
DNA methylation levels at particular loci may closely map trajectories to diseases such as obesity, which have environmental and genetic components.
A recent study linked methylation within the HIF3A gene to BMI and obesity in adults.
Individual susceptibility to obesity is influenced by early environmental exposures.
This study investigates whether the association of HIF3A methylation with adiposity can be detected at birth.
Material & methods
The study was conducted in the 991 subjects from the GUSTO birth cohort.
We determined HIF3A genotype and DNA methylation patterns in DNA extracted from umbilical cords of the 991 infants using Illumina® Infinium HumanMethylation and Omniexpress arrays.
Associations of methylation levels and birth outcomes were adjusted for sex, ethnicity, cellular composition of umbilical cords and interactions between ethnicity and cellular composition.
Results
Higher DNA methylation within HIF3A measured in umbilical cord tissue was associated with greater infant birth weight and adiposity.
The association of HIF3A methylation and birth weight remained significant after adjusting for cis-acting single nucleotide polymorphism; but the association was stronger in one genotypic group.
None of the prenatal environmental variables examined were consistently associated with HIF3A methylation and birth weight.
Discussion
We have extended the previous finding that HIF3A DNA methylation in adults associates with BMI to show that the link between HIF3A DNA methylation with weight and adiposity can be detected at birth.
Although pertaining to the same three CpGs within the HIF3A gene that were previously reported, our data were derived from a different tissue (umbilical cord vs blood and adipose), in a different population (Asian vs Caucasian), in a population-based cohort (normative range vs study population for metabolic disorders and controls) and most importantly at a different stage in the lifecourse (neonates vs adults).
This suggests that prenatal factors may influence HIF3A methylation but despite the extensive data collected in the GUSTO, we were unable to definitively identify a responsible prenatal factor.
We were unable to imply causality in our data and do not know whether adiposity causes HIF3A hypermethylation, HIF3A hypermethylation causes adiposity or if some independent factor influences both.
In their study of HIF3A methylation and adult BMI, Dick et al. used Mendelian randomization to suggest that HIF3A hypermethylation is a consequence of increased adiposity. We could draw the same conclusion from our data but note that some of the assumptions of Mendelian randomization might not be satisfied.
We suggest that as the association between HIF3A methylation and adiposity is detectable so early in life, HIF3A may be a potential biomarker of metabolic trajectory.
Acknowedgements
The GUSTO study group includes P Agarwal, A Biswas, CL Bong, BFP Broekman, S Cai, JKY Chan, YH Chan, CYI Chee, HYH Chen, YB Cheung, A Chia, A Chinnadurai, CK Chng, MFF Chong, SC Chong, MC Chua, CM Ding, EA Finkelstein, D Fok, M Fortier, AEN Goh, YTD Goh, JJ Gooley, WM Han, M Hanson, CJ Henry, C-Y Hsu, H Inskip, J Kapur, K Kwek, IY-M Lau, BW Lee, N Lek, SB Lim, Y-L Low, I Magiati, LM Daniel, C Ngo, K Naiduvaje, WW Pang, A Qiu, BL Quah, VS Rajadurai, M Rauff, SA Rebello, JL Richmond, A Rifkin-Graboi, LP-C Shek, A Sheppard, B Shuter, L Singh, W Stunkel, LL Su, OH Teoh, HPS van Bever, RM van Dam, IBY Wong, PC Wong, GSH Yeo.
Ethical conduct of research
The authors state that they have obtained appropriate institutional review board approval or have followed the principles outlined in the Declaration of Helsinki for all human or animal experimental investigations. In addition, for investigations involving human subjects, informed consent has been obtained from the participants involved.
Supplemental Document
Download MS Excel (37.8 KB)Supplemental Document
Download PDF (111.2 KB)Financial & competing interests disclosure
KM Godfrey, PD Gluckman and Y-S Chong have received reimbursement for speaking at conferences sponsored by companies selling nutritional products. They are part of an academic consortium that has received research funding from Abbott Nutrition, Nestec and Danone. This work was supported by the Translational Clinical Research (TCR) Flagship Program on Developmental Pathways to Metabolic Disease funded by the National Research Foundation (NRF) and administered by the National Medical Research Council (NMRC), Singapore – NMRC/TCR/004-NUS/2008. Additional funding is provided by the Singapore Institute for Clinical Sciences (SICS) – Agency for Science, Technology and Research (A*STAR), Singapore. KM Godfrey is supported by the National Institute for Health Research through the NIHR Southampton Biomedical Research Centre and by the European Union’s Seventh Framework Programme (FP7/2007–2013), project EarlyNutrition under grant agreement no 289346. The authors have no other relevant affiliations or financial involvement with any organization or entity with a financial interest in or financial conflict with the subject matter or materials discussed in the manuscript apart from those disclosed.
No writing assistance was utilized in the production of this manuscript.
Additional information
Funding
References
- Holbrook JD . An epigenetic escape route . Trends Genet.31 ( 1 ), 2 – 4 ( 2015 ).
- Dick KJ , NelsonCP , TsaprouniLet al. DNA methylation and body-mass index: a genome-wide analysis . Lancet383 ( 9933 ), 1990 – 1998 ( 2014 ).
- Agha G , HousemanEA , KelseyKT , EatonCB , BukaSL , LoucksEB . Adiposity is associated with DNA methylation profile in adipose tissue . Int. J. Epidemiol. doi:10.1093/ije/dyu236 ( 2014 ) ( Epub ahead of print ).
- Hanson M , GodfreyKM , LillycropKA , BurdgeGC , GluckmanPD . Developmental plasticity and developmental origins of non-communicable disease: theoretical considerations and epigenetic mechanisms . Prog. Biophys. Mol. Biol.106 ( 1 ), 272 – 280 ( 2011 ).
- Low FM , GluckmanPD , HansonMA . Developmental plasticity and epigenetic mechanisms underpinning metabolic and cardiovascular diseases . Epigenomics3 ( 3 ), 279 – 294 ( 2011 ).
- Gluckman PD , HansonM , ZimmetP , ForresterT . Losing the war against obesity: the need for a developmental perspective . Sci. Transl. Med.3 ( 93 ), 93cm19 ( 2011 ).
- Robinson SM , CrozierSR , HarveyNCet al. Modifiable early-life risk factors for childhood adiposity and overweight: an analysis of their combined impact and potential for prevention . Am. J. Clin. Nutr.101 ( 2 ), 368 – 375 ( 2015 ).
- Gluckman PD , HansonMA , BuklijasT , LowFM , BeedleAS . Epigenetic mechanisms that underpin metabolic and cardiovascular diseases . Nat. Rev. Endocrinol.5 ( 7 ), 401 – 408 ( 2009 ).
- Heijmans BT , TobiEW , SteinADet al. Persistent epigenetic differences associated with prenatal exposure to famine in humans . Proc. Natl Acad. Sci. USA105 ( 44 ), 17046 – 17049 ( 2008 ).
- Lillycrop KA , Slater-JefferiesJL , HansonMA , GodfreyKM , JacksonAA , BurdgeGC . Induction of altered epigenetic regulation of the hepatic glucocorticoid receptor in the offspring of rats fed a protein-restricted diet during pregnancy suggests that reduced DNA methyltransferase-1 expression is involved in impaired DNA methylation and changes in histone modifications . Br. J. Nutr.97 ( 6 ), 1064 – 1073 ( 2007 ).
- Boney CM , VermaA , TuckerR , VohrBR . Metabolic syndrome in childhood: association with birth weight, maternal obesity, and gestational diabetes mellitus . Pediatrics115 ( 3 ), e290 – e296 ( 2005 ).
- Painter RC , OsmondC , GluckmanP , HansonM , PhillipsDI , RoseboomTJ . Transgenerational effects of prenatal exposure to the Dutch famine on neonatal adiposity and health in later life . BJOG115 ( 10 ), 1243 – 1249 ( 2008 ).
- Ong ML , LinX , HolbrookJD . Measuring epigenetics as the mediator of gene/environment interactions in dohad . J. Dev. Orig. Health Dis.6 ( 1 ), 10 – 16 ( 2015 ).
- Teh AL , PanH , ChenLet al. The effect of genotype and in utero environment on interindividual variation in neonate DNA methylomes . Genome Res.24 ( 7 ), 1064 – 1074 ( 2014 ).
- Soh SE , TintMT , GluckmanPet al. Cohort profile: the GUSTO birth cohort study . Int. J. Epidemiol.43 ( 5 ), 1401 – 1409 ( 2012 ).
- Bibikova M , BarnesB , TsanCet al. High density DNA methylation array with single CPG site resolution . Genomics98 ( 4 ), 288 – 295 ( 2011 ).
- Pan H , ChenL , DograSet al. Measuring the methylome in clinical samples: improved processing of the infinium human methylation450 beadchip array . Epigenetics7 ( 10 ), 1173 – 1187 ( 2012 ).
- Dedeurwaerder S , DefranceM , CalonneE , DenisH , SotiriouC , FuksF . Evaluation of the infinium methylation 450k technology . Epigenomics3 ( 6 ), 771 – 784 ( 2011 ).
- Johnson WE , LiC , RabinovicA . Adjusting batch effects in microarray expression data using empirical Bayes methods . Biostatistics8 ( 1 ), 118 – 127 ( 2007 ).
- Houseman EA , AccomandoWP , KoestlerDCet al. DNA methylation arrays as surrogate measures of cell mixture distribution . BMC Bioinformatics13 ( 1 ), 86 ( 2012 ).
- Houseman EA , MolitorJ , MarsitCJ . Reference-free cell mixture adjustments in analysis of DNA methylation data . Bioinformatics30 ( 10 ), 1431 – 1439 ( 2014 ).
- Leek JT , JohnsonWE , ParkerHS , JaffeAE , StoreyJD . The SVA package for removing batch effects and other unwanted variation in high-throughput experiments . Bioinformatics28 ( 6 ), 882 – 883 ( 2012 ).
- EBI . www.ebi.ac.uk/ega/
- Gutierrez-Arcelus M , LappalainenT , MontgomerySBet al. Passive and active DNA methylation and the interplay with genetic variation in gene regulation . Elife2 , e00523 ( 2013 ).
- Leek JT , StoreyJD . Capturing heterogeneity in gene expression studies by surrogate variable analysis . PLoS Genet.3 ( 9 ), 1724 – 1735 ( 2007 ).
- Leek JT , ScharpfRB , BravoHCet al. Tackling the widespread and critical impact of batch effects in high-throughput data . Nat. Rev. Genet.11 ( 10 ), 733 – 739 ( 2010 ).
- Harlid S , XuZ , PanduriV , SandlerDP , TaylorJA . CPG sites associated with cigarette smoking: analysis of epigenome-wide data from the sister study . Environ. Health Perspect.122 ( 7 ), 673 – 678 ( 2014 ).
- Barker M , RobinsonS , OsmondC , BarkerDJ . Birth weight and body fat distribution in adolescent girls . Arch. Dis. Child.77 ( 5 ), 381 – 383 ( 1997 ).
- Persson M , PasupathyD , HansonU , NormanM . Birth size distribution in 3,705 infants born to mothers with type 1 diabetes: a population-based study . Diabetes Care34 ( 5 ), 1145 – 1149 ( 2011 ).
- Murphy TM , MillJ . Epigenetics in health and disease: heralding the EWAS era . Lancet383 ( 9933 ), 1952 – 1954 ( 2014 ).
- Chen L , PanH , TuanTAet al. Brain-derived neurotrophic factor (BDNF) val66met polymorphism influences the association of the methylome with maternal anxiety and neonatal brain volumes . Dev. Psychopathol.27 ( 1 ), 137 – 150 ( 2015 ).
- Gluckman PD , HansonMA , SpencerHG , BatesonP . Environmental influences during development and their later consequences for health and disease: implications for the interpretation of empirical studies . Proc. Biol. Sci.272 ( 1564 ), 671 – 677 ( 2005 ).
- Vickers MH . Developmental programming and transgenerational transmission of obesity . Ann. Nutr. Metab.64 ( Suppl. 1 ), 26 – 34 ( 2014 ).
- Barua S , JunaidMA . Lifestyle, pregnancy and epigenetic effects . Epigenomics7 ( 1 ), 85 – 102 ( 2015 ).
- Pietilainen KH , KaprioJ , RasanenM , WinterT , RissanenA , RoseRJ . Tracking of body size from birth to late adolescence: contributions of birth length, birth weight, duration of gestation, parents’ body size, and twinship . Am. J. Epidemiol.154 ( 1 ), 21 – 29 ( 2001 ).
- Johnson L , LlewellynCH , Van JaarsveldCH , ColeTJ , WardleJ . Genetic and environmental influences on infant growth: prospective analysis of the gemini twin birth cohort . PLoS ONE6 ( 5 ), e19918 ( 2011 ).
- Demerath EW , ChohAC , CzerwinskiSAet al. Genetic and environmental influences on infant weight and weight change: the Fels longitudinal study . Am. J. Hum. Biol.19 ( 5 ), 692 – 702 ( 2007 ).