
Abstract
Aim: Most studies have considered gastroenteropancreatic neuroendocrine tumors (GEP-NETs) as a homogenous group of samples or distinguish only gastrointestinal from pancreatic endocrine tumors. This article investigates if DNA methylation patterns could distinguish subtypes of GEP-NETs. Materials & methods: The DNA methylation level of 807 cancer-related genes was investigated in insulinomas, gastrinomas, non-functioning pancreatic endocrine tumors and small intestine endocrine tumors. Results: DNA methylation patterns were found to be tumor type specific for each of the pancreatic tumor subtypes and identified two distinct methylation-based groups in small intestine endocrine tumors. Differences of DNA methylation levels were validated by pyrosequencing for 20 candidate genes and correlated with differences at the transcriptional level for four candidate genes. Conclusion: The heterogeneity of DNA methylation patterns in the different subtypes of gastroenteropancreatic neuroendocrine tumors suggests different underlying pathways and, therefore, these tumors should be considered as distinct entities in molecular and clinical studies.
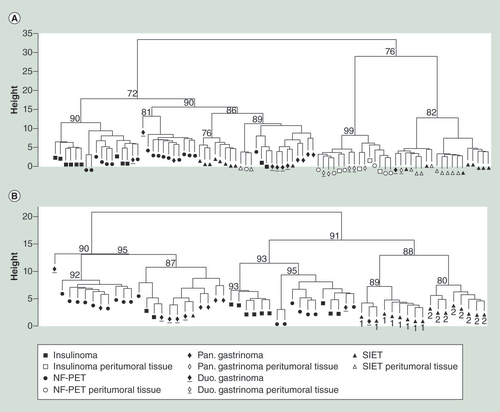
(A) Dendrogram of all tumoral and all peritumoral samples. (B) Dendrogram of all tumoral samples. Values above each cluster correspond to the approximately unbiased value obtained after 10,000 multiscale bootstrap resampling tests. The numbers under the SIETs in the dendrogram presented in the (B) panel correspond to the two groups of SIETs identified according to the cluster analysis presented in the (A) panel (1 or 2 for the SIETs clustering respectively with the SIET peritumoral samples or the other tumors).
Pan.: Pancreatic; Duo.: Duodenal; NF-PET: Non-functioning pancreatic endocrine tumor; SIET: Small intestine endocrine tumor.
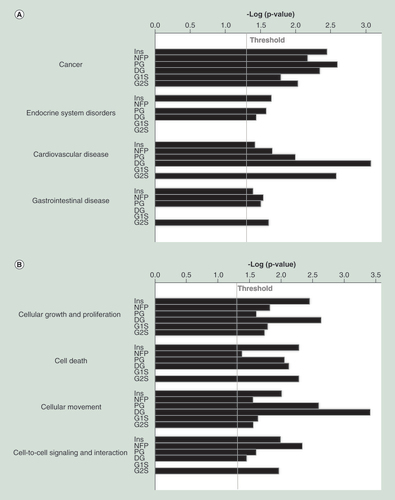
(A) Diseases and disorders. (B) Molecular and cellular functions. The threshold represents a p-value of 0.05.
DG: Duodenal gastrinoma; G1S: Group 1 small intestine endocrine tumors; G2S: Group 2 small intestine endocrine tumors; Ins: Insulinomas; NFP: Non-functioning pancreatic endocrine tumor; PG: Pancreatic gastrinoma; SIET: Small intestine endocrine tumor.
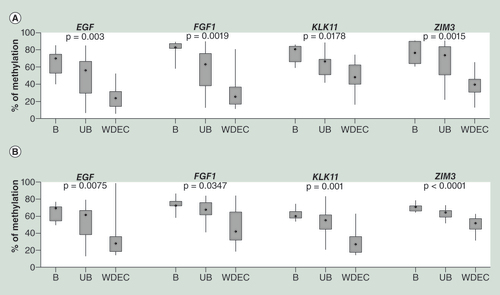
(A) Methylation level of EGF, FGF1, KLK11 and ZIM3 according to GoldenGate. (B) Methylation level of EGF, FGF1, KLK11 and ZIM3 according to pyrosequencing. Statistical significance of DNA methylation differences between the three histological groups using the GoldenGate and pyrosequencing was assessed by the nonparametric Kruskal–Wallis test.
B: Benign; UB: Uncertain behavior; WDEC: Well-differentiated endocrine carcinoma.
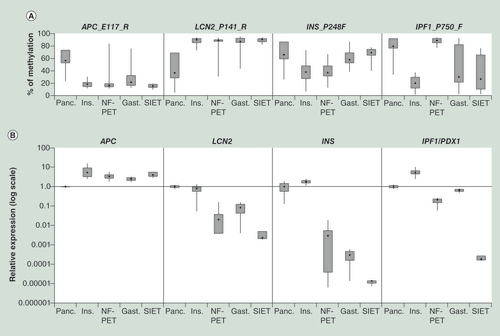
(A) The DNA methylation level obtained by the BeadArray analysis in function of the tumor types. (B) Relative expression level according to tumor type.
Gast.: Gastrinomas; Ins.: Insulinomas; NF-PET: Non-functioning pancreatic endocrine tumor, Panc: Pancreatic normal/peritumoral tissue; SIET: Small intestine endocrine tumor.
Gastroenteropancreatic neuroendocrine tumors (GEP-NETs) result from alterations of neuroendocrine cells of the gastrointestinal mucosa or pancreas and secrete specific proteins used for their detection by immunohistochemistry (chromogranin A, synaptophysin, and neuron-specific enolase) [Citation1–4]. GEP-NETs can be divided into gastrointestinal neuroendocrine tumors (GI-NETs) and pancreatic endocrine tumors (PETs), which have a different pathogenesis [Citation5,Citation6], display different chromosomal aberrations [Citation7] and DNA methylation patterns at selected genomic loci [Citation8,Citation9] as well as distinct gene expression profiles [Citation10]. Candidate gene approaches and genome-wide genetic and expression studies have identified genes (RAR-β, hMLH1, RASSF1, HER2, CYCLIN D1, P16INK4a, P18INK4c, P27Kip1 and tyrosine kinase receptors) and pathways (e.g., PI3K/AKT/mTOR, DAXX/ATRX) potentially implicated in the tumorigenesis of GEP-NETs [Citation10–20].
Recent advances in the genetic analysis of GEP-NETs using next-generation sequencing have demonstrated that PETs present recurrent somatic mutations in DAXX, ATRX, PTEN and TSC2 [Citation19]. These alterations are not present in GI-NETs, in which solely recurrent somatic mutations and deletions of CDKN1B have been identified [Citation21], strengthening the idea that these two groups of tumors develop through distinct mechanisms.
PETs can be further divided into functioning and non-functioning pancreatic endocrine tumors (NF-PETs) based on their capacity to produce peptides that give rise to clinical symptoms [Citation6]. Functioning PETs create hormonal syndromes and include gastrinomas, insulinomas, glucagonomas, VIPomas and somatostatinomas named according to the secreted products. NF-PETs are not associated with any hormonal symptoms or syndromes even though they can secrete the same hormones as well as other peptides such as pancreatic polypeptide, neurotensin or ghrelin. PETs arise sporadically or in the context of genetic predisposition syndromes such as multiple endocrine neoplasia 1 or 2 (MEN1, MEN2), Von Hippel–Lindau (VHL), tuberous sclerosis complex (TSC) and neurofibromatosis 1 [Citation22].
For GI-NETs, a very recent integrative study identified three molecular subgroups within small intestine endocrine tumors (SIETs) based on copy number variation analysis presenting with either no copy number variation (CNV), loss-of-heterozygosity (LOH) of only chromosome 18 or multiple CNVs. These CNV-defined groups also presented with different DNA methylation and expression profiles as well as different progression-free survival suggesting that these SIETs could be stratified by molecular features [Citation23].
Alterations of DNA methylation patterns are a well-established and important factor in tumorigenesis [Citation24,Citation25]. The study of aberrant DNA methylation patterns in cancer is of great interest as a better description and comprehension of the DNA methylation patterns, which carry important diagnostic and prognostic information, might prove valuable for tumor classification and potentially individualized treatment decisions in human cancers [Citation26]. Until recently, only few studies investigated the role of DNA methylation in GEP-NET tumorigenesis [Citation8,Citation9]. Gene-specific hypermethylation and global hypomethylation were found to be more pronounced in gastrointestinal endocrine tumors than in PETs [Citation27,Citation28]. Hypermethylation of the promoter region of a few tumor suppressor genes (CDKN2A [p14, p16], COX2, RASSF1A, hMLH1, MGMT, ESR1, RAR-β and PHLDA3) has been detected in GEP-NETs [Citation17,Citation27,Citation29–33] and was sometimes associated with gene repression [Citation17,Citation31]. The discovery of mutations in DAXX and ATRX [Citation19], which are part of a chromatin remodeling complex, associated to the evidence that Menin is part of an HMT complex [Citation34,Citation35] and that its mutation alters significantly the H3K4me3 landscape of NETs [Citation36], show that epigenetic deregulation plays an important role in the tumorigenesis of GEP-NETs. A recently published genome-wide DNA methylation profiling study on PETs with or without loss of DAXX or ATRX expression revealed distinct DNA methylation profiles of DAXX negative and ATRX negative PETs compared with DAXX/ATRX positive PETs [Citation37]. DAXX negative PETs showed more pronounced DNA methylation differences suggesting that the loss of DAXX and not ARTX drives DNA methylation alteration in PETs. The methylome of SIETs has also been published in a recent study identifying thousands of differentially methylated genes between tumors and normal tissue with an enrichment for MAPK, Wnt and PI3K–mTOR signaling pathways [Citation23].
Most of the currently published studies tend, however, to consider GEP-NETs as two groups: GI-NETs and PETs, without considering potential differences within the group of PETs.
We have previously shown that the hypermethylation of the IGF2 DMR2 present in a mice model for insulinomas carrying a conditional knockout of Men1 in pancreatic β cells [Citation38], is also present in human insulinomas [Citation39]. The epigenetic alteration was specific for insulinomas and did not occur in any of the other types of GEP-NETs analyzed indicating the presence of specific epigenetic differences in GEP-NETs.
In the presented study, we performed a large-scale multilocus analysis of DNA methylation patterns in GEP-NETs using the Illumina GoldenGate technology [Citation40]. We report on the DNA methylation patterns of 807 cancer-related genes in 60 GEP-NETs, including GI-NETs, SIETs, three types of PETs (insulinomas, NF-PETs and pancreatic gastrinomas) and duodenal gastrinomas. Comparison of DNA methylation patterns demonstrates that each tumor type exhibits distinct DNA methylation patterns that in some cases subclassify the tumor types further. These specific epigenetic signatures suggest different mechanisms for tumorigenesis in each tumor type, in particular PETs and demonstrate that the different types of PETs should be considered as different molecular entities to advance our understanding of the underlying biology.
Materials & methods
Ethics statement
Tissue specimens, as well as clinical and pathological records, were obtained and handled according to French laws and recommendations of the French National Committee of Ethics (Comité Consultatif National d’Ethique pour les Sciences de la Vie et de la Santé) for the protection of the patient. Written informed consent was obtained from all patients participating in this study.
Study group
A cohort of 62 patients with gastroenteropancreatic neuroendocrine tumors was analyzed to investigate differences in the DNA methylation patterns. All patients of this study were submitted to surgical resections at the Hôpital Cochin (Paris, France). During surgery, fragments of tumors obtained were immediately dissected, snap frozen and stored in liquid nitrogen until DNA and mRNA extraction. 60 tumoral samples derived from primary lesions and 30 peritumoral samples of the 62 patients including 28 paired samples were analyzed, including 18 SIETs and 11 peritumoral ileal mucosa tissues, as well as 42 PETs (). The PET samples included 11 insulinomas and five peritumoral pancreatic tissues, 12 gastrinomas (five pancreatic and seven duodenal gastrinomas) and seven peritumoral tissues and 19 NF-PETs with seven peritumoral pancreatic tissues. PETs were classified according to the WHO criteria as benign, uncertain behavior and well-differentiated endocrine carcinomas [Citation41,Citation42].
DNA preparation for methylation analysis
Genomic DNA was isolated from frozen tissue samples using standard phenol-chloroform extraction. DNA concentrations were determined using the Quant-iT dsDNA broad range or high sensitivity assay kit (Molecular Probes, Life Technologies) on a SpectraMAX Gemini XPS microplate spectrofluorometer (Molecular Devices, St Grégoire, France) and adjusted to a concentration of 50 ng/µl.
Bisulfite conversion of DNA was performed on 1 µg genomic DNA using the EpiTect 96 Bisulfite Kit (Qiagen) according to the manufacturer’s instruction. Five hundred nanograms of bisulfite-treated DNA was used for GoldenGate methylation assay. The remaining DNA was diluted to a final concentration of 20 ng/µl for subsequent validation studies by pyrosequencing. The absence of unconverted genomic DNA as well as the quality of the bisulfite conversion was assessed by PCR amplification and subsequent pyrosequencing analysis.
Large-scale locus-specific methylation analysis
The methylation status of 1505 CpGs located in the promoter and/or exonic regions of 807 cancer-related genes was analyzed in 91 samples (90 tumoral and peritumoral samples, and one technical replicate). The GoldenGate methylation assay was performed on 500 ng of bisulfite-treated DNA according to the manufacturer’s instructions (Illumina, Inc., CA, USA). Results were obtained as β-values ranging from 0 (unmethylated site) to 1 (methylated site). Quality control of all data was performed using the Beadstudio software (Illumina). Samples and probes with low signal intensity or less than 80% of valid results (p < 0.01 for each CpG) were removed from the analysis and the quality controlled data are provided as Supplementary Data 1.
Data analysis
The GoldenGate methylation data were analyzed using the BeadStudio software (Illumina). For the analysis of DNA methylation patterns between two groups of samples, only differences ≥0.15 (15%) (for each analyzed CpG) were considered and the compiled data are available in Supplementary Data 2. This cut-off value has previously been used in the Illumina GoldenGate BeadArray proof of concept study for the identification of differentially methylated genes as the resolution of this technology was evaluated to range from 2.5–17% depending on the interrogated CpG site [Citation40] and is also close to the reported absolute difference in β-value able to distinguish two samples from each other (0.17, [Citation43]).
Gene networks and gene ontology annotations were identified using Ingenuity Pathway Analysis (IPA, Qiagen). Unsupervised hierarchical clustering analysis and dendrogram representation of the methylation data was done in R 3.2.1 using Euclidean distance and the Ward method as implemented in the R package pvclust, which allows the assessment of the uncertainty in hierarchical clustering using multiscale bootstrap resampling giving approximately unbiased (AU) probabilities [Citation44].
Differences in the distribution of DNA methylation levels between the three histology groups were assessed by a nonparametric Kruskal–Wallis tests with p < 0.05 considered as significant. Possible associations between the two main DNA methylation clusters and the histological type were assessed using a Pearson’s χ2 test.
Validation of DNA methylation signatures by pyrosequencing
Validation studies were performed by pyrosequencing of bisulfite-treated DNA. Regions of interest were amplified using 20 ng of bisulfite-treated DNA and analyzed by pyrosequencing as previously described [Citation39,Citation45]. Sequences of amplification and pyrosequencing primers as well as the annealing temperatures used for the PCRs on bisulfite-treated DNA are given in Supplementary Table 1.
A duplicate NF-PET sample was included in the methylation profiling experiments and showed a good reproducibility shown by the R2 > 0.93 between the duplicates while an R2 < 0.72 was obtained when comparing it to a random NF-PET sample (Supplementary Figure 1). Moreover, four Illumina probes in four different genes were validated by quantitative DNA methylation analysis using pyrosequencing for the very same CpG site. We obtained an R2 > 0.71 for all assays indicating reproducible DNA methylation patterns between the two different methods (Supplementary Figure 2). Twenty additional genes were selected from the GoldenGate methylation data for pyrosequencing validation because of either differential DNA methylation patterns between tumoral and peritumoral samples, according to their tissue origin or their specificity for a distinct tumor type (Supplementary Table 2). The methylation patterns were validated by pyrosequencing of a region including or close to the CpG analyzed in the GoldenGate experiment. For 17 of the 20 genes (85%) the initial findings were validated and the results obtained with the two techniques were found to be closely correlated (Supplementary Figure 3).
mRNA expression analysis
RNAs were isolated from frozen tissue samples using Trizol. RNA extraction was successful for four insulinomas, two gastrinomas, five NF-PETs, three SIETs and a normal pancreas. One commercial pancreatic RNA preparation (Ambion, Life Technologies, Courtaboeuf, France) was added as normal/reference sample. RNA concentrations were determined using a NanoDrop 2000c spectrophotometer (Labtech, Palaiseau, France) and RNA integrity was assessed with an Agilent 2100 Bioanalyzer (Agilent, Massy, France). The mean RNA integrity number (RIN) was 7.4 ± 1 with a coefficient of variation (CV) of 14%. One microgram of total RNA was reverse transcribed using Superscript III and oligo(dT) primers (Invitrogen) according to the manufacturer’s instructions.
Real-time quantitative PCR was carried out using the QuantiFast SYBR green PCR kit and QuantiTect Primer Assays (INS: QT01531040, PDX1: QT00201859, APC: QT02407671 and LCN2: QT00028098, Qiagen, Courtaboeuf, France) in a LightCycler 480 II thermocycler (Roche Applied Science, Meylan, France). PCR conditions were 95°C for 10 min, followed by 45 cycles of 95°C for 15 s and 60°C for 1 min. At the end of the amplification reaction, a melting curve analysis was performed to confirm the specificity as well as the integrity of the PCR product by the presence of a single peak. Absence of cross contamination and primer dimers was verified on genomic DNA and a blank water control. The geometric means of two reference genes (β-actin and β2-microglobulin), previously defined as the best combination for this sample collection, was used for normalization [Citation39]. Standard curves were generated from assays made with serial dilutions of reference cDNA to calculate PCR efficiencies (100 ± 15%). Ct values were transformed into quantitative values using the formula (1 + efficiency)Ct. Only means of duplicates with a CV of <15% were analyzed.
Results
In the current study, we analyzed the methylation status of 1505 CpGs located in the promoter and/or exonic regions of 807 cancer-related genes in 90 tumoral and peritumoral samples from patients with endocrine tumors of the pancreas and the small intestine. Duplicate samples present in the experiment indicated a good technical reproducibility of the method (Supplementary Figure 1) and the validation of a subset of 20 genes by pyrosequencing showed a good concordance between the two technologies and indicated a high level of confidence in the BeadArray results (Supplementary Figures 2 & 3).
DNA methylation analysis reveals hierarchical tissue & tumoral organization of samples
The quality controlled DNA methylation data were first analyzed using unsupervised hierarchical clustering and the robustness of the clusters was assessed using bootstrap resampling analysis which gave approximately unbiased (AU) probability values ranging from 69–99% for the principal subclusters of each dendrogram suggesting that the clusters were very stable and our classification reliable ( & Supplementary Figure 4). The peritumoral samples separated into two distinct groups according to their tissue of origin, in other words, the pancreas or the intestinal mucosa as expected (Supplementary Figure 4A).
When all tumoral and peritumoral samples were included into the clustering analysis, samples separated as expected based on their tumoral or peritumoral status demonstrating widespread altered DNA methylation patterns in the tumors (A). A subgroup of SIETs and a single gastrinoma sample (A) showed a DNA methylation profile similar to the peritumoral samples with which they regrouped. Thus, SIETs were found to form two groups either close to the peritumoral samples (group 1) or creating a distinct subcluster within the tumoral samples (group 2) (A). Hierarchical clustering of the tumoral samples revealed a separation of the tumors in three major clusters (B). The first two clusters comprised the PET samples with insulinomas and gastrinomas enriched in one of each subcluster respectively, while the third cluster comprised two subclusters regrouping the SIET samples. The PETs clustered mainly together in function of the tumor type, in other words, insulinoma, gastrinoma or NF-PET (). The two subclusters of SIETs separate perfectly the SIETs in the two groups of SIET identified in A reinforcing the idea that these two groups of SIETs are real. These two groups of SIETs were therefore treated separately for all subsequent analyses.
Gastrinomas of pancreatic and duodenal origin grouped together when analyzing the entire dataset suggesting a similar underlying tumor biology. To reveal potential differences between the two types of gastrinomas, we performed a separate hierarchical clustering on all gastrinomas and corresponding peritumoral samples, in which most of the duodenal tumors were more similar to the peritumoral samples than the pancreatic gastrinomas, which formed a cluster apart (Supplementary Figure 4B).
Variation of DNA methylation patterns in GEP-NETs, gene ontology analysis & identification of differentially methylated gene networks
Globally, promoter regions seemed slightly more prone to methylation variation as a higher percentage of differentially methylated genes was found in promoter regions compared with exonic regions (Supplementary Tables 3 & 5). For each tumor type, the most frequent and statistically significant associated disease was as expected cancer (). Endocrine system disorders, gastrointestinal and cardiovascular diseases were other diseases and disorders associated with the differentially methylated genes. The absence of the associated term ‘endocrine system disorders’ for NF-PETs and SIETs () is of note and in agreement with the absence of hormonal syndromes in these two types of tumors. Cellular growth, cell death, cellular movement and cell–cell signaling and interaction were the main molecular and cellular functions of the differentially methylated genes (). To confirm our hypothesis of tumor type-specific DNA methylation differences, we compared the DNA methylation profile of each tumor group to their corresponding peritumoral tissues and investigated if the differentially methylated genes regrouped in networks and specific pathways. The detailed analysis of differentially methylated genes in each type of GEP-NETs compared with their respective peritumoral tissue is presented in the Supplementary Material as Supplementary Analyses, Supplementary Figures 4–13 & Supplementary Tables 3–7.
Identification of tumor type specific DNA methylation signatures in PETs
To investigate if the three types of PETs (insulinomas, pancreatic gastrinomas and NF-PETs) had divergent and specific DNA methylation patterns, comparative methylation analysis was performed. The peritumoral tissues of insulinomas, NF-PETs and pancreatic gastrinomas showed only 3–6% of differentially methylated genes (Supplementary Figure 5D & Supplementary Table 5) when compared pairwise indicating homogeneity of the samples, which was expected as they share the same tissue of origin. When compared with their peritumoral counterpart, insulinomas, NF-PETs and pancreatic gastrinomas displayed 15–29% differentially methylated genes with a comparable fraction of hypermethylated genes in the three types of PETs (8–10%) (Supplementary Figure 5C). Differences were mainly due to the number of hypomethylated genes: 7% for insulinomas, 12% for NF-PETs and 19% for pancreatic gastrinomas (Supplementary Figure 5C).
Insulinomas compared with NF-PETs or pancreatic gastrinomas (Supplementary Figure 5D & Supplementary Table 5) yielded 20 and 15% of differentially methylated genes, respectively, with most genes being hypermethylated in the insulinomas (13 and 12%, respectively). Fifteen percent of genes were differentially methylated between pancreatic gastrinomas and NF-PETs (Supplementary Figure 5D & Supplementary Table 5) without any preference for hyper- or hypomethylation.
Among the differentially methylated genes in PETs 63 were shared by all types of PETs, whereas 31, 109 and 47 genes were specific to insulinomas, pancreatic gastrinomas and NF-PETs, respectively (Supplementary Figure 5E & Supplementary Table 8). Genes specific for pancreatic gastrinomas were mostly hypomethylated and included many metalloproteinases and their inhibitors (hypomethylated: MMP1, MMP3, TIMP2, TIMP3, hypermethylated: MMP2, MMP9) as well as members of the serpin family (hypomethylated: SERPINA5, SERPINB5), whereas those specific to insulinomas and NF-PETs were equally hyper- or hypo-methylated. Specific alterations found in NF-PETs included notably three ILs (hypermethylated: IL6, hypomethylated: IL8, IL10), whereas the hypermethylation of Interferon γ (IFNG) and the hypomethylation of HDAC9 and PDX1 were specific for insulinomas.
These results demonstrate therefore that insulinomas, pancreatic gastrinomas and NF-PETs display distinct methylation patterns with specific differentially methylated genes.
DNA methylation profiling of oncogenes & tumor suppressor genes in GEP-NETs
In order to visualize the DNA methylation profiles of oncogenes and tumor suppressor genes in GEP-NETs, each probe present on the GoldenGate BeadArray was annotated using the oncogene and tumor suppressor list provided in [Citation46] or obtained in the Uniprot Knowledge base by a keyword search [Citation47]. Forty-nine tumor suppressor genes and 84 oncogenes were identified corresponding respectively to 81 and 136 GoldenGate probes. Most oncogenes and tumor suppressors were either methylated or unmethylated in all tumoral and peritumoral samples (Supplementary Figure 14). However, some tumor suppressor genes including SMARCB1, CASP8 and NBL1 and oncogenes including IL2, MCF2 and MOS showed hypermethylation and hypomethylation, respectively in PETs and/or SIETs. Interestingly, some oncogenes were hypermethylated in PETs including GAS7, PDGFRA and BCR while some tumor suppressor genes were hypomethylated in PETs and SIETs including APC and DLC1 (Supplementary Figure 14).
Identification of differentially methylated genes in PETs according to histology
PETs are commonly classified based on the WHO criteria into well-differentiated tumors, which can be benign (B) or of uncertain behavior (UB), in well-differentiated endocrine carcinoma (WDEC) and poorly differentiated endocrine carcinoma [Citation41]. No associations were found between the two main clusters of tumors as defined by the DNA methylation profile and the histological classification of the tumors. However, some genes presented variation of their methylation patterns correlating with the three histological groups () These genes include notably two growth factors (FGF1, EGF) and two imprinted genes (ZIM3 and SNRPN). Four genes (EGF, FGF1, KLK11 and ZIM3) were selected for further validation by pyrosequencing and confirmed the significant differences for all four genes found in the GoldenGate data (). As multiple CpGs were analyzed by pyrosequencing, these analyses further refined the median and spread for DNA methylation values.
Correlation of DNA methylation with expression level of four candidate genes in GEP-NETs
In order to investigate the potential functional impact of the differentially methylated genes on GEP-NET tumorigenesis, we analyzed the gene expression level of four candidate genes ().
We selected two genes with a consistent DNA methylation difference in all different types of tumors: APC, which is hypomethylated and LCN2, which is hypermethylated in all GEP-NETs (A). For these two genes, an inverse correlation between DNA methylation and RNA expression level was found in most tumor types. Insulinomas exhibited only a slightly decreased expression level of LCN2 despite very high methylation levels in the promoter ().
INS and PDX1 showed differential methylation patterns in the tumor types. The INS promoter was found to be hypomethylated in insulinomas and NF-PETs and displayed no variations in the other tumor types, whereas the PDX1 promoter was only strongly hypomethylated in insulinomas (A). Only insulinomas overexpressed INS and PDX1 whereas the other tumor types present different level of transcriptional repression () recapitulating the known requirement of PDX1 for insulin expression.
These examples clearly indicate that DNA methylation profiling is a powerful tool to identify novel deregulated genes that have a functional impact on GEP-NET tumorigenesis and might provide novel targets for treatment and diagnosis.
Discussion
In the current study, we performed one of the largest analysis of DNA methylation patterns in endocrine tumors of the pancreas and the small intestine and fill thereby an important gap in the knowledge on epigenetic modifications in endocrine tumors [Citation46]. Technological advances in DNA methylation analysis permit nowadays to obtain much more detailed genome-wide DNA methylation patterns using high-density epigenotyping arrays analyzing 450K CpG positions [Citation48] or whole-genome bisulfite sequencing [Citation49], which could further refine the DNA methylation landscape. However, our study is a first important step in generating knowledge on the DNA methylation differences between different subtypes of GEP-NETs. Hierarchical clustering separated samples into distinct groups mainly in function of the tumoral status (tumor or peritumoral tissue, respectively).
Previously reported studies investigating DNA methylation patterns in GEP-NETs demonstrated that global hypomethylation was more common in GI-NETs than in PETs [Citation39,Citation50] and that PETs display hypermethylation of some tumor suppressor genes (n = 11) at different frequencies [Citation17]. Even if differences between SIETs and PETs demonstrated in this study might have been expected, as they have a different tissue of origin and pathogenesis [Citation51], our analyses demonstrate the presence of different specific methylation signatures within GI-NETs and PETs. A genome-wide DNA methylation study on PETs using the Illumina 450K BeadChip described recently DNA methylation profiles in DAXX negative and ATRX positive compared with DAXX/ATRX negative PETs, but did not demonstrate tumor type-specific DNA methylation as the PETs analyzed were not further characterized into PET subgroups [Citation37]. Therefore, our data add a new level of stratification of DNA methylation of PETs according to their tumor types in addition to the classification of DNA methylation based on the DAXX/ATRX expression status. Menin is another important protein implicated in GEP-NET tumorigenesis, which acts also as a chromatin remodeling factor [Citation34,Citation35] and has shown to be mutated in approximately half of PETs [Citation19,Citation52]. Although MEN1 was not covered by probes of the BeadArray, it is probable that gene mutation rather than DNA methylation is the molecular mechanism for MEN1 inactivation as no changes in DNA methylation patterns of MEN1 have previously been detected in GEP-NETs [Citation27].
In our previous study, which analyzed the DNA methylation patterns of IGF2 in three different types of PETs [Citation39], we suggested that insulinomas tend to be hypermethylated whereas NF-PETs and pancreatic gastrinomas tend to be hypomethylated. This hypothesis was confirmed in the present study at a much larger scale as insulinomas exhibited two- to three-times more hypermethylated genes compared with the other two tumor types.
The main observation of the presented work is the existence of tumor-specific DNA methylation patterns in GEP-NETs and in some cases even within the same tumor type, as exemplified by the two distinct groups of SIETs. After pathological re-examination, the latter showed no histological differences, particularly of the proliferation index or the percentage of tumor cells present in the lesions. Moreover, the clinical data of the patients revealed no association with sex or age at diagnosis. While it is highly probable from our analyses that these two distinct subtypes exist, the number of SIETs in this study is too small to draw any conclusion concerning a potentially different prognostic and requiring potentially different treatment decisions warranting further molecular characterization of these two subtypes. A very recent integrative study identified three molecular subgroups of SIETs based on CNV analyses presenting also with differences in DNA methylation, mRNA expression and progression-free survival suggesting that molecular features are a promising way to stratified further tumor types, notably GI-NETs [Citation23]. However, we lack these molecular and clinical information for the SIETs to allow any comparison of our two subgroups with the three CNV-defined subgroups.
Gastrinomas also were found to display different DNA methylation patterns in function of their origin. Pancreatic gastrinomas were found to display four-times more alterations (mainly hypomethylated genes) of their DNA methylation patterns compared with duodenal gastrinomas. Hypomethylated genes have been associated with bad prognosis, the occurrence of metastases and/or a more aggressive phenotype for several cancer types [Citation53–55]. The preferential hypomethylation observed in the pancreatic gastrinoma would support this idea as indeed pancreatic gastrinomas are more aggressive than duodenal gastrinomas and have a worse survival prognostic [Citation56–58].
Our study discovered a large number of specifically methylated genes for each tumor type as well as genes that seem to be central to gene networks of differentially methylated genes. However, only integrative genome-wide analyses of different gene regulatory and transcriptional levels can yield a comprehensive vision of GEP-NETs tumorigenesis and the results should be taken with caution when only one regulation level is analyzed. Functional follow-up studies are required to determine the importance of each of these genes in the context of a specific tumor type rather than in general in PETs or GI-NETs. We have followed up the functional implications for the four selected candidate genes at the gene expression level and we found in most cases a good inverse correlation of the methylation and the expression status in the different tumor types. This indicates that analysis of variations of DNA methylation is a promising way to identify genes implicated in the GEP-NET tumorigenesis, but of course each gene requires detailed functional analyses.
Many studies have shown the simultaneous occurrence of global hypomethylation associated with tumor suppressor gene hypermethylation in cancer [Citation59], which has also been demonstrated for GEP-NETs [Citation27,Citation28]. In our study, we confirmed the presence of tumor suppressor hypermethylation in PETs and SIETs as well as hypomethylation of some oncogenes although most probes did not present any difference with peritumoral tissue. Interestingly, we could also show the presence of some hypomethylated tumor suppressor genes and hypermethylated oncogene in PETs and SIETs, which suggests that these genes could have a different role in GEP-NET tumorigenesis compared with other cancers. For example, hypomethylation of APC in the different types of GEP-NETS was accompanied by an increased gene expression of this tumor suppressor gene.
The recent discovery of CDKN1B heterozygous frameshift mutations occurring in 8% of SIETs provides the first example for recurrent mutations in this type of tumors [Citation21] as previously no recurrent mutations were found [Citation60]. In PETs, no recurrent mutation nor promoter methylation of CDKN1B was found [Citation19,Citation61–62] and data on the expression status is conflicting. mRNA [Citation62] and p27Kip1 protein expression was sometimes found increased [Citation13] but also reduced in MEN1 tumors [Citation63] and in 77% of insulinomas that developed in pancreatic β-cell-specific Men1 mutant mice [Citation64]. In our data CNKN1B did not display promoter methylation in SIETs and gastrinomas, while the promoter was strongly methylated in insulinomas and NF-PETs (20 and 35% of methylation difference compared with peritumoral samples respectively). This suggests that p27Kip1 is predominantly inactivated in SIETs through frameshift mutations and other so far unknown mechanisms whereas in PETs it could, in addition to being regulated by Menin [Citation63], be at least partly mediated, by DNA methylation.
Conclusion
In this study, we have demonstrated the large heterogeneity of molecular alterations in PETs or GI-NETs through the identification of six distinct tumor-specific DNA methylation patterns. Their analyses demonstrate that even pathologically homogeneous tumors like SIETs can be further subdivided into two different subtypes, but these findings require further molecular characterization and validation experiments in independent cohorts. In the light of the different underlying molecular alterations identified in the presented study, it becomes clear that a combined analysis of several tumor types as it has frequently been reported in the literature needs to be revised in future studies.
Future perspective
DNA methylation-based biomarkers could be used in diagnostics to distinguish different types or subtypes of GEP-NETs or to identify the histology of tumors when pathological examination might not be sufficient.
Functional follow-up studies are now required to determine the importance of each of the specifically or commonly altered genes in the context of a specific tumor type rather than in general in PETs or GI-NETs.
Table 1. Clinical characteristics of the patient cohort.
Table 2. List of genes presenting methylation variation according to the WHO criteria.
DNA methylation profiling of 807 cancer-related genes in four types of gastroenteropancreatic neuroendocrine tumors (GEP-NETs) including insulinomas, gastrinomas, non-functioning pancreatic endocrine tumors (PETs) and small intestine endocrine tumors revealed DNA methylation patterns specific to each tumor type but no specific pattern according to the histology.
Insulinomas exhibit preferentially hypermethylated genes compared with the two other tumor types of PETs (gastrinomas and non-functioning PETs) presenting more hypomethylated genes.
Gastrinomas exhibited two distinct DNA methylation profiles depending on their pancreatic or duodenal origin.
Two distinct groups of small intestine endocrine tumors were identified based on their DNA methylation profile and did not correlate with any known classification.
DNA methylation differences correlated inversely with RNA expression levels for selected candidate genes.
Disclaimer
The funders had no role in study design, data collection and analysis, decision to publish or preparation of the manuscript.
Ethical conduct of research
The authors state that they have obtained appropriate institutional review board approval or have followed the principles outlined in the Declaration of Helsinki for all human or animal experimental investigations. In addition, for investigations involving human subjects, informed consent has been obtained from the participants involved.
Supplemental Information
Download MS Word (6.9 MB)Supplemental Information
Download MS Excel (2.1 MB)Supplemental Information
Download MS Excel (497.5 KB)Acknowledgments
The authors would like to thank Hafida El Abdalaoui for the bisulfite treatment of the samples, Anne Boland-Auge for the measure of DNA concentration and Doris Lechner, Damien Delafoy, Antoine Daunay and Florence Busato for excellent technical assistance.
Supplementary data
To view the supplementary data that accompany this paper please visit the journal website at: www.tandfonline.com/doi/suppl/10.2217/epi.15.85
Financial & competing interests disclosure
This work was supported by the EU framework 6 integrated project Molecular Phenotyping to Accelerate Genomic Epidemiology (MolPAGE, LSHG-CT-2004-512066) and the French Ministry of Research. The authors have no other relevant affiliations or financial involvement with any organization or entity with a financial interest in or financial conflict with the subject matter or materials discussed in the manuscript apart from those disclosed.
No writing assistance was utilized in the production of this manuscript.
Additional information
Funding
References
- Kloppel G , AnlaufM . Epidemiology, tumour biology and histopathological classification of neuroendocrine tumours of the gastrointestinal tract . Best Pract. Res. Clin. Gastroenterol.19 ( 4 ), 507 – 517 ( 2005 ).
- Fraenkel M , KimMK , FaggianoA , ValkGD . Epidemiology of gastroenteropancreatic neuroendocrine tumours . Best Pract. Res. Clin. Gastroenterol.26 ( 6 ), 691 – 703 ( 2012 ).
- Kanakis G , KaltsasG . Biochemical markers for gastroenteropancreatic neuroendocrine tumours (GEP-NETs) . Best Pract. Res. Clin. Gastroenterol.26 ( 6 ), 791 – 802 ( 2012 ).
- Meeker A , HeaphyC . Gastroenteropancreatic endocrine tumors . Mol. Cell. Endocrinol.386 ( 1–2 ), 101 – 120 ( 2014 ).
- Strosberg J . Neuroendocrine tumours of the small intestine . Best Pract. Res. Clin. Gastroenterol.26 ( 6 ), 755 – 773 ( 2012 ).
- Ito T , IgarashiH , JensenRT . Pancreatic neuroendocrine tumors: clinical features, diagnosis and medical treatment: advances . Best Pract. Res. Clin. Gastroenterol.26 ( 6 ), 737 – 753 ( 2012 ).
- Zikusoka MN , KiddM , EickG , LatichI , ModlinIM . The molecular genetics of gastroenteropancreatic neuroendocrine tumors . Cancer104 ( 11 ), 2292 – 2309 ( 2005 ).
- Mapelli P , AboagyeEO , StebbingJ , SharmaR . Epigenetic changes in gastroenteropancreatic neuroendocrine tumours . Oncogene34 ( 34 ), 4439 – 4447 ( 2014 ).
- Karpathakis A , DibraH , ThirlwellC . Neuroendocrine tumours: cracking the epigenetic code . Endocr. Relat. Cancer20 ( 3 ), R65 – R82 ( 2013 ).
- Duerr EM , MizukamiY , NgAet al. Defining molecular classifications and targets in gastroenteropancreatic neuroendocrine tumors through DNA microarray analysis . Endocr. Relat. Cancer15 ( 1 ), 243 – 256 ( 2008 ).
- Muscarella P , MelvinWS , FisherWEet al. Genetic alterations in gastrinomas and nonfunctioning pancreatic neuroendocrine tumors: an analysis of p16/MTS1 tumor suppressor gene inactivation . Cancer Res.58 ( 2 ), 237 – 240 ( 1998 ).
- Chung DC , BrownSB , Graeme-CookFet al. Overexpression of cyclin D1 occurs frequently in human pancreatic endocrine tumors . J. Clin. Endocrinol. Metab.85 ( 11 ), 4373 – 4378 ( 2000 ).
- Guo SS , WuX , ShimoideAT , WongJ , SawickiMP . Anomalous overexpression of p27(Kip1) in sporadic pancreatic endocrine tumors . J. Surg. Res.96 ( 2 ), 284 – 288 ( 2001 ).
- Goebel SU , IwamotoM , RaffeldMet al. Her-2/neu expression and gene amplification in gastrinomas: correlations with tumor biology, growth, and aggressiveness . Cancer Res.62 ( 13 ), 3702 – 3710 ( 2002 ).
- Fjallskog ML , LejonklouMH , ObergKE , ErikssonBK , JansonET . Expression of molecular targets for tyrosine kinase receptor antagonists in malignant endocrine pancreatic tumors . Clin. Cancer Res.9 ( 4 ), 1469 – 1473 ( 2003 ).
- House MG , HermanJG , GuoMZet al. Prognostic value of hMLH1 methylation and microsatellite instability in pancreatic endocrine neoplasms . Surgery134 ( 6 ), 902 – 908 ; discussion 909 ( 2003 ).
- House MG , HermanJG , GuoMZet al. Aberrant hypermethylation of tumor suppressor genes in pancreatic endocrine neoplasms . Ann. Surg.238 ( 3 ), 423 – 431 ; discussion 431–422 ( 2003 ).
- Missiaglia E , DalaiI , BarbiSet al. Pancreatic endocrine tumors: expression profiling evidences a role for AKT-mTOR pathway . J. Clin. Oncol.28 ( 2 ), 245 – 255 ( 2010 ).
- Jiao Y , ShiC , EdilBHet al. DAXX/ATRX, MEN1, and mTOR pathway genes are frequently altered in pancreatic neuroendocrine tumors . Science331 ( 6021 ), 1199 – 1203 ( 2011 ).
- Briest F , GrabowskiP . PI3K–AKT–mTOR-signaling and beyond: the complex network in gastroenteropancreatic neuroendocrine neoplasms . Theranostics4 ( 4 ), 336 – 365 ( 2014 ).
- Francis JM , KiezunA , RamosAHet al. Somatic mutation of CDKN1B in small intestine neuroendocrine tumors . Nat. Genet.45 ( 12 ), 1483 – 1486 ( 2013 ).
- Capurso G , FestaS , ValenteRet al. Molecular pathology and genetics of pancreatic endocrine tumours . J. Mol. Endocrinol.49 ( 1 ), R37 – R50 ( 2012 ).
- Karpathakis A , DibraH , PipinikasCet al. Prognostic impact of novel molecular subtypes of small intestinal neuroendocrine tumour . Clin. Cancer. Res. doi:10.1158/1078-0432 ( 2015 ) ( Epub ahead of print ).
- Dawson MA , KouzaridesT . Cancer epigenetics: from mechanism to therapy . Cell150 ( 1 ), 12 – 27 ( 2012 ).
- Baylin SB , JonesPA . A decade of exploring the cancer epigenome – biological and translational implications . Nat. Rev. Cancer11 ( 10 ), 726 – 734 ( 2011 ).
- How Kit A , NielsenHM , TostJ . DNA methylation based biomarkers: practical considerations and applications . Biochimie94 ( 11 ), 2314 – 2337 ( 2012 ).
- Chan AO , KimSG , BedeirA , IssaJP , HamiltonSR , RashidA . CpG island methylation in carcinoid and pancreatic endocrine tumors . Oncogene22 ( 6 ), 924 – 934 ( 2003 ).
- Choi IS , EstecioMR , NaganoYet al. Hypomethylation of LINE-1 and Alu in well-differentiated neuroendocrine tumors (pancreatic endocrine tumors and carcinoid tumors) . Mod. Pathol.20 ( 7 ), 802 – 810 ( 2007 ).
- Serrano J , GoebelSU , PeghiniPL , LubenskyIA , GibrilF , JensenRT . Alterations in the p16INK4a/CDKN2A tumor suppressor gene in gastrinomas . J. Clin. Endocrinol. Metab.85 ( 11 ), 4146 – 4156 ( 2000 ).
- Liu L , BroaddusRR , YaoJCet al. Epigenetic alterations in neuroendocrine tumors: methylation of RAS-association domain family 1, isoform A and p16 genes are associated with metastasis . Mod. Pathol.18 ( 12 ), 1632 – 1640 ( 2005 ).
- Malpeli G , AmatoE , DandreaMet al. Methylation-associated down-regulation of RASSF1A and up-regulation of RASSF1C in pancreatic endocrine tumors . BMC Cancer11 , 351 ( 2011 ).
- Stefanoli M , La RosaS , SahnaneNet al. Prognostic relevance of aberrant DNA methylation in g1 and g2 pancreatic neuroendocrine tumors . Neuroendocrinology100 ( 1 ), 26 – 34 ( 2014 ).
- Ohki R , SaitoK , ChenYet al. PHLDA3 is a novel tumor suppressor of pancreatic neuroendocrine tumors . Proc. Natl Acad. Sci. USA111 ( 23 ), e2404 – e2413 ( 2014 ).
- Yokoyama A , SomervailleTC , SmithKS , Rozenblatt-RosenO , MeyersonM , ClearyML . The menin tumor suppressor protein is an essential oncogenic cofactor for MLL-associated leukemogenesis . Cell123 ( 2 ), 207 – 218 ( 2005 ).
- Grembecka J , BelcherAM , HartleyT , CierpickiT . Molecular basis of the mixed lineage leukemia-menin interaction: implications for targeting mixed lineage leukemias . J. Biol. Chem.285 ( 52 ), 40690 – 40698 ( 2010 ).
- Lin W , WatanabeH , PengSet al. Dynamic epigenetic regulation by menin during pancreatic islet tumor formation . Mol. Cancer Res.13 ( 4 ), 689 – 698 ( 2015 ).
- Pipinikas CP , DibraH , KarpathakisAet al. Epigenetic dysregulation and poorer prognosis in DAXX-deficient pancreatic neuroendocrine tumours . Endocr. Relat. Cancer22 ( 3 ), L13 – L18 ( 2015 ).
- Fontaniere S , TostJ , WierinckxAet al. Gene expression profiling in insulinomas of Men1 beta-cell mutant mice reveals early genetic and epigenetic events involved in pancreatic beta-cell tumorigenesis . Endocr. Relat. Cancer13 ( 4 ), 1223 – 1236 ( 2006 ).
- Dejeux E , OlasoR , DoussetBet al. Hypermethylation of the IGF2 differentially methylated region 2 is a specific event in insulinomas leading to loss-of-imprinting and overexpression . Endocr. Relat. Cancer16 ( 3 ), 939 – 952 ( 2009 ).
- Bibikova M , LinZ , ZhouLet al. High-throughput DNA methylation profiling using universal bead arrays . Genome Res.16 ( 3 ), 383 – 393 ( 2006 ).
- Kloppel G , PerrenA , HeitzPU . The gastroenteropancreatic neuroendocrine cell system and its tumors: the WHO classification . Ann. NY Acad. Sci.1014 , 13 – 27 ( 2004 ).
- Kloppel G . Classification and pathology of gastroenteropancreatic neuroendocrine neoplasms . Endocr. Relat. Cancer18 ( Suppl. 1 ), S1 – S16 ( 2011 ).
- Bibikova M , FanJB . GoldenGate assay for DNA methylation profiling . Methods Mol. Biol.507 , 149 – 163 ( 2009 ).
- Suzuki R , ShimodairaH . Pvclust: an R package for assessing the uncertainty in hierarchical clustering . Bioinformatics22 ( 12 ), 1540 – 1542 ( 2006 ).
- Tost J , GutIG . DNA methylation analysis by pyrosequencing . Nat. Protoc.2 ( 9 ), 2265 – 2275 ( 2007 ).
- Rodriguez-Rodero S , Delgado-AlvarezE , FernandezAF , Fernandez-MoreraJL , Menendez-TorreE , FragaMF . Epigenetic alterations in endocrine-related cancer . Endocr. Relat. Cancer21 ( 4 ), R319 – R330 ( 2014 ).
- UniProt . www.uniprot.org .
- Bibikova M , BarnesB , TsanCet al. High density DNA methylation array with single CpG site resolution . Genomics98 ( 4 ), 288 – 295 ( 2011 ).
- Lister R , PelizzolaM , DowenRHet al. Human DNA methylomes at base resolution show widespread epigenomic differences . Nature462 ( 7271 ), 315 – 322 ( 2009 ).
- Rosty C , UekiT , ArganiPet al. Overexpression of S100A4 in pancreatic ductal adenocarcinomas is associated with poor differentiation and DNA hypomethylation . Am. J. Pathol.160 ( 1 ), 45 – 50 ( 2002 ).
- Duerr EM , ChungDC . Molecular genetics of neuroendocrine tumors . Best Pract. Res. Clin. Endocrinol. Metab.21 ( 1 ), 1 – 14 ( 2007 ).
- Corbo V , DalaiI , ScardoniMet al. MEN1 in pancreatic endocrine tumors: analysis of gene and protein status in 169 sporadic neoplasms reveals alterations in the vast majority of cases . Endocr. Relat. Cancer17 ( 3 ), 771 – 783 ( 2010 ).
- Paredes J , AlbergariaA , OliveiraJT , JeronimoC , MilaneziF , SchmittFC . P-cadherin overexpression is an indicator of clinical outcome in invasive breast carcinomas and is associated with CDH3 promoter hypomethylation . Clin. Cancer Res.11 ( 16 ), 5869 – 5877 ( 2005 ).
- Ehrlich M . DNA hypomethylation in cancer cells . Epigenomics1 ( 2 ), 239 – 259 ( 2009 ).
- Jordan PH Jr . A personal experience with pancreatic and duodenal neuroendocrine tumors . J. Am. Coll. Surg.189 ( 5 ), 470 – 482 ( 1999 ).
- Fendrich V , LangerP , WaldmannJ , BartschDK , RothmundM . Management of sporadic and multiple endocrine neoplasia type 1 gastrinomas . Br. J. Surg.94 ( 11 ), 1331 – 1341 ( 2007 ).
- Fendrich V , RamerthR , WaldmannJet al. Sonic hedgehog and pancreatic-duodenal homeobox 1 expression distinguish between duodenal and pancreatic gastrinomas . Endocr. Relat. Cancer16 ( 2 ), 613 – 622 ( 2009 ).
- Wolff EM , ChiharaY , PanFet al. Unique DNA methylation patterns distinguish noninvasive and invasive urothelial cancers and establish an epigenetic field defect in premalignant tissue . Cancer Res.70 ( 20 ), 8169 – 8178 ( 2010 ).
- Esteller M . CpG island hypermethylation and tumor suppressor genes: a booming present, a brighter future . Oncogene21 ( 35 ), 5427 – 5440 ( 2002 ).
- Banck MS , KanwarR , KulkarniAAet al. The genomic landscape of small intestine neuroendocrine tumors . J. Clin. Invest.123 ( 6 ), 2502 – 2508 ( 2013 ).
- Lindberg D , AkerstromG , WestinG . Mutational analysis of p27 (CDKN1B) and p18 (CDKN2C) in sporadic pancreatic endocrine tumors argues against tumor-suppressor function . Neoplasia9 ( 7 ), 533 – 535 ( 2007 ).
- Lindberg D , AkerstromG , WestinG . Evaluation of CDKN2C/p18, CDKN1B/p27 and CDKN2B/p15 mRNA expression, and CpG methylation status in sporadic and MEN1-associated pancreatic endocrine tumours . Clin. Endocrinol. (Oxf.)68 ( 2 ), 271 – 277 ( 2008 ).
- Milne TA , HughesCM , LloydRet al. Menin and MLL cooperatively regulate expression of cyclin-dependent kinase inhibitors . Proc. Natl Acad. Sci. USA102 ( 3 ), 749 – 754 ( 2005 ).
- Fontaniere S , CasseH , BertolinoP , ZhangCX . Analysis of p27(Kip1) expression in insulinomas developed in pancreatic beta-cell specific Men1 mutant mice . Fam. Cancer5 ( 1 ), 49 – 54 ( 2006 ).