
Abstract
Aim: The RAISE project aimed to find a surrogate end point to predict treatment response early in patients with enteropancreatic neuroendocrine tumors (NET). Response heterogeneity, defined as the coexistence of responding and non-responding lesions, has been proposed as a predictive marker for progression-free survival (PFS) in patients with NETs. Patients & methods: Computerized tomography scans were analyzed from patients with multiple lesions in CLARINET (NCT00353496; n = 148/204). Cox regression analyses evaluated association between response heterogeneity, estimated using the standard deviation of the longest diameter ratio of target lesions, and NET progression. Results: Greater response heterogeneity at a given visit was associated with earlier progression thereafter: week 12 hazard ratio (HR; 95% confidence interval): 1.48 (1.20–1.82); p < 0.001; n = 148; week 36: 1.72 (1.32–2.24); p < 0.001; n = 108. HRs controlled for sum of longest diameter ratio: week 12: 1.28 (1.04–1.59); p = 0.020 and week 36: 1.81 (1.20–2.72); p = 0.005. Conclusion: Response heterogeneity independently predicts PFS in patients with enteropancreatic NETs. Further validation is required.
Plain language summary
Response heterogeneity as a new biomarker of treatment response in patients with neuroendocrine tumors: Neuroendocrine tumors (NET) are rare, slow-growing cancers that can grow in various parts of the body. By understanding how NETs are responding to treatment, doctors can choose the best treatment for a patient and monitor whether the treatment needs to be changed. Treatment response is determined using ‘Response Evaluation Criteria in Solid Tumors (RECIST)’: a technique which measures the size of tumors to assess whether they are shrinking. However, RECIST is not always useful in NETs, which grow slowly and rarely shrink.
‘Response heterogeneity’ describes the situation in which some tumors respond well to treatment, while other tumors in the same patient do not. Response heterogeneity may be important in understanding how tumors are responding to treatment and predicting outcomes for patients. Until now, the link between response heterogeneity and treatment response has not been studied in patients with NETs.
The RAISE project examined data from a clinical trial of patients with NETs treated with lanreotide. In RAISE, response heterogeneity was estimated using imaging scans of NETs. Response heterogeneity was compared with factors such as tumor size and amounts of certain molecules found in the blood, to see how well response heterogeneity could predict outcomes for patients with NETs.
In this study, response heterogeneity was linked with worse outcomes for patients. Therefore, it may be useful in understanding how NETs respond to treatment. Further research is needed in a different group of patients with NETs, and in patients receiving other treatments, to better understand response heterogeneity.
Neuroendocrine tumors (NET) are rare tumors, accounting for approximately 0.5% of all newly diagnosed malignancies [Citation1]. NETs are a diverse group of neoplasms, often distinguished and classified by their site of origin, functional status, and degree of proliferation and differentiation [Citation2]. In enteropancreatic NETs, metastases typically develop initially in regional lymph nodes, most commonly in the liver, and less frequently in the bone and distal lymph nodes, or the lungs [Citation3,Citation4].
Systemic treatment options for patients with advanced and metastatic NETs, which have been shown to delay progression and diminish symptoms related to hormone hypersecretion, have grown in recent years, including somatostatin analogs (SSA), peptide receptor radionuclide therapy (PRRT), chemotherapy, and targeted agents [Citation5–9]. However, the long-term effectiveness of these treatments vary, and toxicity data for targeted therapies demonstrate that high heterogeneity and variation exist in the extent to which they improve progression-free survival (PFS) [Citation10]. Despite the broad range of treatment options for NETs, dependent on the tumor profile and patient characteristics [Citation11], few biomarkers exist to help predict prognosis and guide treatment decisions [Citation12].
There is an ongoing debate surrounding the most suitable tool to assess treatment outcomes in patients with NETs. Currently, the preferred choice is Response Evaluation Criteria in Solid Tumors (RECIST), which uses the sum of the longest diameter (SLD) of target lesions, together with the appearance of new lesions, to compute a categorical variable (complete response [CR], partial response [PR], stable disease [SD], or progressive disease [PD]) and determine objective treatment response [Citation13,Citation14]. However, RECIST does not account for the wide variation in the clinical and biological presentation of NETs, including in tumor growth, secretory capacity and anatomical localization [Citation15,Citation16]. Choi criteria have been proposed as an alternative set of response criteria to RECIST, measuring treatment-induced necrosis. Choi criteria can be considered in the assessment of treatment response in NETs as they account for intratumor changes through the evaluation of tumor density. However, since SSAs do not induce tumor necrosis in patients with NETs, Choi criteria are not well-suited to assessing response to SSA treatment in these patients [Citation15]. Recently, post-hoc analyses of data from the CLARINET phase III trial (NCT00353496) of lanreotide in patients with enteropancreatic NETs demonstrated the clinical utility of tumor growth rate (TGR) as a measure of tumor progression and as a prognostic factor for PFS [Citation17]. A less categorical definition of treatment response, which is more sensitive to the biology of NET evolution, might aid in selecting the most appropriate therapeutic strategy from an expanding treatment landscape [Citation17]. This would allow the personalization of treatment based on clinical and biological features of NETs, driving advancements in clinical management of the disease [Citation5,Citation18].
The Research for Artificial Intelligence-Based Surrogate Endpoint (RAISE) project aimed to harness the emerging promise shown by artificial intelligence and deep learning concepts in precision and personalized medicine [Citation19], and in tumor grading in NETs [Citation20–22], to create a multimodal surrogate end point for RECIST. Clinical data and imaging biomarkers were derived from CT scans of hepatic lesions over multiple visits, in a subset of patients from the CLARINET phase III trial (NCT00353496). These were used to assess whether this new end point could allow for earlier prediction of PFS and facilitate treatment adaptation in patients with NETs [Citation23]. Deep learning models were shown to capture information from CT scans, complementary to the lesion shape and size, that may benefit the early prediction of PFS in patients with enteropancreatic NETs. Main findings from the RAISE project have recently been published [Citation24]. During the project, response heterogeneity observed in CT scans was hypothesized to be important in understanding treatment response in patients with NETs. This hypothesis prompted further investigation into its potential role as a marker of treatment response in these patients.
Response heterogeneity has been defined previously, based on RECIST, as the coexistence of responding and non-responding target lesions. Responding lesions are those with a CR (disappearance of all target lesions) or a PR (a >30% decrease in sum of diameters of target lesions). Non-responding lesions demonstrate PD (a >20% increase in sum of diameters of target lesions) or SD (neither a sufficient shrinkage to be classed as PR, nor sufficient increase to qualify as PD) [Citation13,Citation14]. Studies of response heterogeneity, also referred to elsewhere as a dissociated or mixed response, have since shown that response heterogeneity has different predictive implications depending on treatment type [Citation25,Citation26].
Thus, the predictive value of response heterogeneity in determining treatment response and patient outcome remains unclear, and the association between response heterogeneity and PFS in patients with NETs is yet to be assessed. As an extension of the RAISE project, the potential of response heterogeneity as a biomarker to allow earlier prediction of PFS in patients with NETs was investigated, using a new definition of response heterogeneity for assessing slow-growing NETs.
Materials & methods
Study design & included patients
The design and methods of the CLARINET study have been described previously [Citation23]. Briefly, CLARINET was a randomized, double-blind, placebo-controlled, multinational, phase III study which assessed the efficacy and safety of lanreotide in tumor control in patients with enteropancreatic NETs. The CLARINET study was approved by all relevant local ethical committees. Consent was obtained from each patient after full explanation of the purpose and nature of all procedures used.
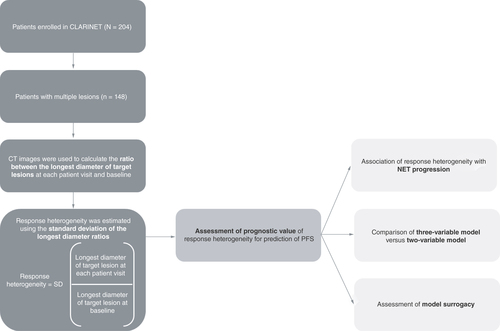
Patients eligible for enrollment in CLARINET were those with advanced, well- or moderately-differentiated, non-functioning, somatostatin receptor-positive, enteropancreatic NETs, with Ki-67 index less than 10% (N = 204; placebo: n = 103; lanreotide: n = 101). Tumor growth and disease progression were not assessed prior to enrolment in the trial, but were prospectively evaluated on study entry before randomization to placebo or lanreotide. Disease progression, and hence PFS, was evaluated using CT scans according to RECIST 1.0. CT imaging was performed twice during screening, 12 weeks apart, to determine the baseline disease progression status of patients; the second image scan was used to determine target lesion sizes and was considered the baseline assessment in CLARINET. Patients with progressive disease at baseline and previous therapy at study entry were combined with patients with progressive disease at study entry and no previous therapy at entry. The analysis of response heterogeneity in RAISE was restricted to the subset of patients enrolled in CLARINET with multiple lesions.
Study procedures & evaluations
In this study, a maximum of ten target lesions per patient, with a maximum of five lesions per organ, were selected according to RECIST 1.0. Selected lesions were ≥10 mm in size, with a slice thickness of <5 mm.
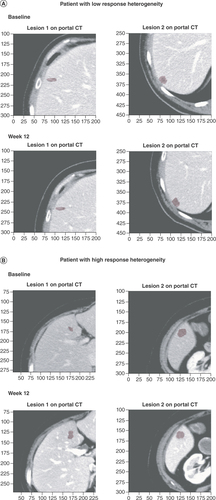
The definition of response heterogeneity was adapted in this study as previous definitions of response heterogeneity, such as the coexistence of responding lesions (CR and PR) and non-responding lesions (PD and SD) in the same patient, are not suitable for slow-growing tumors such as low-grade NETs. For the analyses reported here, the ratio between the longest diameter at each patient visit and at baseline (longest diameter ratio; LDr) was computed for each target lesion using CT images taken at weeks 12, 24, 36, 48 and 72; non-target lesions and new lesions since baseline were excluded from these analyses. Response heterogeneity was therefore considered to be a continuous variable, estimated using the standard deviation (SD) of the LDr of all target lesions measured in axial view for each patient, rather than being defined according to a distinct cut-off value. As response heterogeneity is not binary, the response heterogeneity metric was standardized at each timepoint by its SD at that same timepoint. An overview of the assessment of the response heterogeneity biomarker in the RAISE project is provided in . CT images of patients with lesions demonstrating high response heterogeneity and low response heterogeneity at baseline and at week 12 are shown in to illustrate this concept.
A Cox regression analysis assessed the association of response heterogeneity with NET progression at each patient visit at weeks 12, 24, 36, 48 and 72. Cox models were also trained on patient samples of available data at patient visits (week 12: n = 148; week 24: n = 131; week 36: n = 108; week 48: n = 90; week 72: n = 70). A three-variable model (combining the response heterogeneity output with the SLDr and change in logCgA between each patient visit and baseline), was compared with a two-variable model (based on SLDr and change in logCgA between each patient visit and baseline only), and a model based on SLDr alone for the prediction of PFS at patient visits at weeks 12, 24, 36, 48 and 72. The surrogacy of the models, as measured by the proportion explained metric, was also compared at patient visits at weeks 12, 24, 36, 48 and 72.
CgA: Chromogranin A; NET: Neuroendocrine tumor; PFS: Progression-free survival; SD: Standard deviation; SLDr: Sum of longest diameter ratio.
(A) CT scans of lesions demonstrating low response heterogeneity at baseline and week 12. The response heterogeneity value, calculated as the SD of the LDr of the target lesions, was 0.01 for this patient. (B) CT scans of lesions demonstrating high response heterogeneity at baseline and week 12. The response heterogeneity value was 0.11 for this patient.
CT: Computerized tomography; LDr: Longest diameter ratio; SD: Standard deviation.
Assessment of response heterogeneity & NET progression
To determine the predictive value of response heterogeneity in determining PFS, a Cox regression analysis, stratified by the number of lesions for each patient, was used to evaluate the association of response heterogeneity with NET progression.
This relationship was assessed both including and excluding the sum of the longest diameter ratio (SLDr) as a covariate in the repeated Cox model at each patient visit.
Assessment of the influence of response heterogeneity in the prediction of PFS
The predictive performance of response heterogeneity in determining PFS in patients with enteropancreatic NETs was also assessed using Cox models. Cox models were trained by treating each patient visit as an independent observation, with the remaining time to progression as the associated outcome. Performance of the models in predicting PFS was compared using c-index values at patient visits at weeks 12, 24, 36, 48 and 72 to determine overall best model performance. Models were evaluated using leave-one-out validation; therefore, it was not possible to assess the significance of model comparisons using other test coefficients. Standard errors of the mean values are also presented.
A three-variable model (combining the response heterogeneity output with the SLDr and change from baseline in logarithmically transformed CgA [logCgA]) was compared with a two-variable model (based on SLDr and change in logCgA only) and SLDr alone for the prediction of PFS across patient visits. SLDr was selected for inclusion in the multivariate models as it is an equivalent but simpler measure of tumor growth than TGR. The raw CgA values were large and had a skewed distribution; therefore, CgA was logarithmically transformed to normalize the distribution of CgA values, which is desirable when performing Cox regression analyses.
Assessment of surrogacy of the models & PFS alone
Surrogacy, defined as the ability of the models to predict PFS, was then assessed using the proportion explained metric [Citation27]. This metric quantified the proportion of treatment effect on PFS that could be accounted for by the variables included in the models. The value for the proportion of treatment effect explained generally lies between 0, indicating a poor surrogate to explain the treatment effect, and 1, indicating a perfect surrogate [Citation28,Citation29].
The surrogacy of the three-variable model, the two-variable model, the model based on SLDr and PFS alone were compared at patient visits at weeks 12, 24, 36, 48 and 72.
Results
Patient disposition & baseline characteristics
The analysis of response heterogeneity was restricted to the subset of patients enrolled in CLARINET with multiple lesions (N = 148) who were randomized to receive either lanreotide (n = 69) or placebo (n = 79), representing 72.5% of the total CLARINET population.
Baseline demographics and disease characteristics were balanced across treatment groups in this patient subset (). Of these patients, 61 (41.2%) had NETs that originated in the pancreas, 56 (37.8%) had NETs that originated in the midgut, and 10 (6.8%) had NETs that originated in the hindgut. In total, 100 patients (67.6%) had Grade 1 NETs and 46 patients (31.1%) had Grade 2 NETs, based on Ki-67 proliferative activity. Ki-67 index data were missing for two patients in the placebo group.
Table 1. Baseline demographics and patient disease characteristics for the patients in the RAISE response heterogeneity analysis.
Assessment of response heterogeneity & NET progression
At week 12, the mean value for response heterogeneity in the included patients was 0.05 (SD: 0.06; n = 148). By week 24, the value for response heterogeneity was higher, at 0.08 (SD: 0.07; n = 131), . Values for response heterogeneity at weeks 36, 48, and 72 were 0.09 (SD: 0.08; n = 108), 0.09 (SD: 0.07; n = 90) and 0.09 (SD: 0.07; n = 70), respectively.
Table 2. Response heterogeneity and NET progression at patient visits over 72 weeks in the subset of patients with multiple lesions enrolled in CLARINET.
A Cox regression analysis demonstrated that greater response heterogeneity was associated with faster progression. The reported hazard ratio (HR) for response heterogeneity at week 12 was 1.48 (95% CI: 1.20–1.82; p < 0.001 n = 148). This value was greater by week 36, at 1.72 (95% CI: 1.32–2.24; p < 0.001; n = 108). The HR with control for SLDr was 1.28 (95% CI: 1.04–1.59; p = 0.020) at week 12, with a greater value of 1.81 (95% CI: 1.20–2.72; p = 0.005) reported at week 36 (). This relationship was maintained both when SLDr was included in or excluded from the model as a covariate (), but was weaker at later patient visits.
Assessment of the influence of response heterogeneity in the prediction of PFS
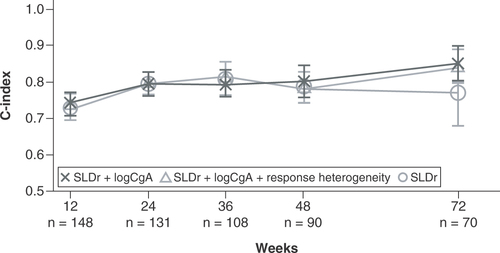
At week 12, all three models demonstrated similar performance. The three-variable model achieved a c-index value of 0.75 for the prediction of PFS, compared with c-index values of 0.74 (two-variable model) and 0.73 (SLDr alone; ). By week 36, the c-index value of the three-variable model for the prediction of PFS was 0.82, which was greater than that achieved by the two-variable model (0.79) and the model based on SLDr alone (0.80). At week 72, the three-variable model and the two-variable model demonstrated similar model performance, achieving c-index values of 0.84 and 0.85, respectively. However, performances of both of these models were greater than that of the model based on SLDr alone, which achieved a c-index value of 0.77 for the prediction of PFS at week 72.
C-index values are reported for the prediction of PFS in the subset of patients with multiple lesions enrolled in CLARINET at patient visits at weeks 12, 24, 36, 48 and 72 for the entire subset. The figure shows the comparison between the three-variable model (incorporating response heterogeneity with SLDr and change from baseline in logCgA), the two-variable model (combining SLDr and change from baseline in logCgA) and SLDr alone.
CgA: Chromogranin A; PFS: Progression-free survival; SLDr: Sum of longest diameter ratio.
Assessment of surrogacy of the models & PFS alone
Surrogacy of the three-variable model at week 24 (0.72) was similar to that of the two-variable model (0.75) but greater than surrogacy of the model based on SLDr (0.41; ). PFS alone at week 24 was not shown to be predictive of PFS at later visits.
Surrogacy of the models was evaluated by the proportion explained metric. This metric quantifies the proportion of treatment effect on PFS that could be accounted for by the variables included in the models (SLDr, change from baseline in logCgA, response heterogeneity) and SLDr and PFS alone at earlier timepoints. The figure shows surrogacy of the three-variable model (incorporating response heterogeneity with SLDr and change from baseline in logCgA), the two-variable model (combining SLDr and change from baseline in logCgA), and SLDr and PFS alone at patient visits at weeks 12, 24, 36, 48 and 72.
CgA: Chromogranin A; PFS: Progression-free survival; SLDr: Sum of longest diameter ratio.
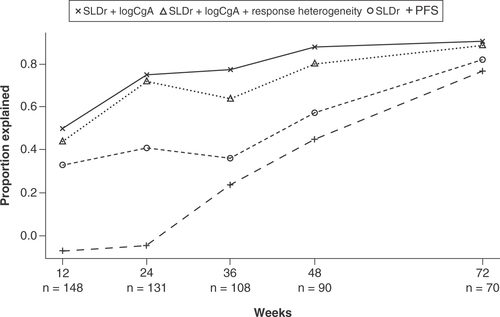
Surrogacy of each of the three models and PFS alone increased at each patient visit through to week 72. At week 72, the values of the proportion explained metric for the three-variable model (0.89) and the two-variable model (0.91) were greater than those achieved by the model based on SLDr (0.82), and PFS alone (0.77).
Discussion
Early detection of progression in patients with NETs is crucial to avoid ineffective treatment and to guide treatment adaptation. The utility of tumor size-based RECIST is limited in the assessment of treatment efficacy in slow-growing NETs, where treatment response to targeted therapy often takes the form of disease stabilization rather than tumor shrinkage [Citation15]. Given the limitations of RECIST, there is a need for additional informative parameters. In RAISE, the presence of response heterogeneity (the coexistence of responding and non-responding lesions in the same patient) emerged as a secondary finding. Response heterogeneity was then further investigated as a biomarker for the prediction of PFS in a subset of patients with enteropancreatic NETs from the CLARINET study (n = 148/204). This extension to the RAISE project demonstrates ongoing efforts to improve timely adaptation of treatment strategies for these patients.
In this investigation, response heterogeneity between different metastatic lesions was found to be associated with tumor progression. This finding is consistent with previous reports, which indicated that response heterogeneity is an independent, unfavorable prognostic factor for PFS in patients with non-small-cell lung cancer (NSCLC), and in patients with solid tumors treated with immunotherapy [Citation30,Citation31]. These results suggest that response heterogeneity may provide further clinical value than is currently afforded by RECIST, through determining the likelihood of poor patient outcomes without relying on tumor size-based criteria. The association with tumor progression was present both with and without the SLDr covariate. This finding is significant given the known pertinence of the SLDr, which is used in RECIST to define treatment response in patients with NETs [Citation13,Citation14]. However, the association was weaker at later patient visits, possibly due to the sample size being more than 50% smaller at week 72 (n = 70) compared with the initial evaluation (n = 148), as disease progression in patients led to their withdrawal from the trial.
Performance of the three-variable model (combining response heterogeneity with the clinical features logCgA and SLDr) was similar to that of the two-variable model (based on clinical features alone), both in the prediction of PFS and in model surrogacy. These findings are consistent with reports suggesting that baseline plasma CgA level is a predictor of overall survival [Citation32]. However, it remains controversial as to whether changes in CgA reflect tumor response to treatment [Citation33], given the numerous other pathological processes which can lead to an increase in CgA concentration, resulting in confusion and diagnostic difficulties [Citation34]. The inhibitory effect of lanreotide on CgA secretion may explain the increased performance of both the three-variable and the two-variable model in the lanreotide arm versus the placebo arm. This improved performance in the lanreotide arm of both models was likely due to the inclusion of CgA, rather than the inclusion of response heterogeneity (present in the three-variable model only). These findings from RAISE validate the significance of CgA in the clinical evaluation of patients with enteropancreatic NETs, suggesting that this plasma marker may hold greater value in the prediction of PFS than response heterogeneity in an SSA-naive population with slow to moderate tumor growth. This investigation also builds on the identification of TGR as a valuable indicator of tumor progression by Dromain et al. [Citation35]. Indeed, in this study the potential for surrogacy of SLDr, as an equivalent for TGR, was considered alongside the performance of other biomarkers, such as logCgA and response heterogeneity, in the prediction of PFS. Overall, incorporating the response heterogeneity output into the model was not found to benefit early prediction of PFS in patients with enteropancreatic NETs, compared with clinical features alone.
In RAISE, response heterogeneity was considered to be a continuous variable, estimated using the SD of the LDr of target lesions. This definition is more appropriate in the assessment of NETs, which are slow-growing, than previous definitions, which are unlikely to identify response heterogeneity in these patients.
Our investigation therefore differs from other similar recent studies, in which response heterogeneity in tumors has been described more strictly in line with RECIST [Citation30,Citation36], or through changes in metabolic responses of lesions [Citation25,Citation37,Citation38]. For example, Dong et al. evaluated the response to epidermal growth factor receptor-tyrosine kinase inhibitors or chemotherapy in patients with NSCLC [Citation30]. Three types of response heterogeneity were defined: a mixed response between primary and metastatic lesions (43.4%); a mixed response between primarily targeted lesions and new lesions (34.0%); and a mixed response between separated metastatic lesions (22.6%) in situations where the primary lesion was removed. These definitions are consistent with a separate investigation into tumor heterogeneity in patients with chemorefractory metastatic colorectal cancer treated with sorafenib and capecitabine; in this study, metabolic response was measured using fluorodeoxyglucose (FDG)-positron emission tomography (PET) to detect tumor heterogeneity in a whole-body tumor load [Citation39]. Both investigations differ to our study, in which response heterogeneity was determined using changes in lesion size, only metastatic lesions located in the same organ were considered, new lesions were excluded, and the effect of only one treatment was examined.
Moreover, in RAISE, response heterogeneity was measured using CT imaging data from patients in CLARINET whose lesions were classified on somatostatin receptor scintigraphy [Citation23]. Somatostatin receptor imaging by single photon emission CT (SPECT) or PET is an efficient diagnostic tool for patients with NETs that is thought to cope well with tumor heterogeneity, by incorporating metabolic imaging features known to be correlated with tumor grade [Citation40]. However, this imaging method was not used in the CLARINET trial, and therefore could not be used to assess response heterogeneity in this study [Citation23,Citation40,Citation41]. Recently, texture analysis using skewness and kurtosis of lesions on pre-treatment 68Ga DOTA-TATE PET/CT has been shown to be capable of predicting treatment responsiveness to PRRT in patients with NETs [Citation42]. Further investigation using somatostatin receptor SPECT/PET or 68Ga DOTA-TATE PET/CT imaging in patients with NETs may increase the strength of the response heterogeneity signal detected and help to detect it earlier.
Eligible patients for RAISE were a subset of those enrolled in the CLARINET study with multiple lesions. Patients in CLARINET generally had homogenous and stable disease according to RECIST 1.0; almost all patients in CLARINET did not have disease progression in the 3 to 6 months before randomization (96%) [Citation23], and in this analysis of response heterogeneity, no included patients had disease progression at baseline. Additionally, the majority of patients in the subset assessed for response heterogeneity in RAISE had Grade 1 pancreatic NETs. In the wider NET population, patients tend to have disease with varying degrees of tumor aggressiveness [Citation43,Citation44]. Response heterogeneity may correlate with a different clinical phenotype in the wider patient population, and may be expected to be greater in patients with tumors with higher proliferative activity. This analysis was also limited by the low number of patients, which prevented separate analysis of response heterogeneity in patients with Grade 1 and Grade 2 NETs and in patients with midgut and pancreatic NETs, which is pertinent considering that median overall survival in patients with NETs reportedly varies according to tumor site, grade, and stage [Citation45]. Furthermore, this study has not been reproduced in another independent cohort, and no sensitivity analysis was performed to compare the potential of response heterogeneity for the prediction of PFS in the 148 patients from CLARINET who were included in this analysis with the 56 who were not. Such analyses may have improved support for the reproducibility of these findings in other patient populations. Future work assessing heterogeneity of response in a different real-world population of patients with NETs of varying location, grade and stage may help to determine the usefulness of this biomarker in the assessment of PFS. In addition, further studies assessing the predictive performance of response heterogeneity alone, or in comparison with RECIST or Choi criteria, would be useful to determine the value of response heterogeneity as an imaging biomarker for patients with NETs, both as a standalone assessment and compared with currently available imaging criteria.
Conclusion
We found that response heterogeneity may be a predictor of PFS in patients with enteropancreatic NETs, independent of other markers of progression such as the SLDr of lesions. This predictive performance is based on features impacted by treatment and allows monitoring of ongoing enteropancreatic NET evolution.
These findings warrant further validation of response heterogeneity as a biomarker for the prediction of PFS in a different group of patients with NETs, who are more representative of the general NET population with a heterogeneous disease course, and in patients receiving treatments other than lanreotide. The SD of the LDr is not a straightforward measure for clinicians to calculate in their daily practice, which may limit the widespread application of response heterogeneity as a predictive biomarker. A clearer and more uniform definition of response heterogeneity, with a cut-off threshold to assign greater clinical value to this metric, may improve the applicability of these findings.
Neuroendocrine tumors (NET) are rare, diverse, slow-growing tumors, often distinguished and classified by their site of origin, functional status, and degree of proliferation and differentiation.
Systemic treatment options for patients with advanced and metastatic NETs have grown in recent years. Despite this, few biomarkers exist to help predict prognosis and guide treatment decisions.
Response Evaluation Criteria in Solid Tumors (RECIST) is commonly used to determine treatment response in NETs. However, RECIST does not account for the wide variation in the clinical and biological presentation of NETs, including in tumor growth, secretory capacity and anatomical localization. As such, there is a need for a more informative biomarker that is better suited to NETs.
The RAISE project aimed to harness the emerging promise shown by artificial intelligence and deep learning concepts in precision and personalized medicine, and in tumor grading in NETs, to create a multimodal surrogate end point for RECIST using clinical data and imaging biomarkers.
Response heterogeneity has been previously defined, based on RECIST, as the coexistence of responding and non-responding target lesions in the same patient. During the RAISE project, response heterogeneity observed in computerized tomography scans was hypothesized to be important in understanding treatment response in patients with NETs. The potential of response heterogeneity as a biomarker for earlier progression-free survival (PFS) prediction was investigated, using a new definition of response heterogeneity for assessing slow-growing NETs.
This study included a subset of patients from the CLARINET phase III trial (NCT00353496) with multiple lesions (N = 148/204), who were randomized to receive either lanreotide (n = 69) or placebo (n = 79).
Cox regression analyses evaluated the predictive value of response heterogeneity in the prediction of PFS, assessed both with inclusion and exclusion of sum of longest diameter ratio (SLDr) as a covariate in the Cox model. These analyses demonstrated that greater response heterogeneity was associated with faster progression: at week 12, hazard ratio (HR) = 1.48 (95% CI: 1.20–1.82; p < 0.001; n = 148); at week 36, HR = 1.72 (1.32–2.24; p < 0.001; n = 108). With control for SLDr: at week 12, HR = 1.28 (95% CI: 1.04–1.59; p = 0.020); at week 36, HR = 1.81 (95% CI: 1.20–2.72; p = 0.005).
The surrogacy (or ability of the models to predict PFS) of the three-variable model (combining response heterogeneity, change from baseline in logarithmically transformed CgA [logCgA] and SLDr) compared with the two-variable model (SLDr and logCgA) versus SLDr alone was assessed using the proportion explained metric. At week 24, surrogacy of the three-variable model (0.72) was similar to that of the two-variable model (0.75), but greater than that of SLDr alone (0.41). At week 24, PFS alone was not predictive of PFS at week 96.
Overall, it was found that response heterogeneity may be a predictor of PFS in patients with enteropancreatic NETs, independent of other markers of progression such as the SLDr of lesions. This predictive performance is based on features impacted by treatment and allows monitoring of ongoing tumor evolution.
Author contributions
Substantial contributions to study conception and design: C Dromain, M Pavel, M Ronot, N Schaefer, D Mandair, D Gueguen, C Cheng, O Dehaene, K Schutte, D Cahané, S Jégou, F Balazard; substantial contributions to analysis and interpretation of the data: C Dromain, M Pavel, M Ronot, N Schaefer, D Mandair, D Gueguen, C Cheng, O Dehaene, K Schutte, D Cahané, S Jégou, F Balazard; drafting the article or revising it critically for important intellectual content: C Dromain, M Pavel, M Ronot, N Schaefer, D Mandair, D Gueguen, C Cheng, O Dehaene, K Schutte, D Cahané, S Jégou, F Balazard; final approval of the version of the article to be published: C Dromain, M Pavel, M Ronot, N Schaefer, D Mandair, D Gueguen, C Cheng, O Dehaene, K Schutte, D Cahané, S Jégou, F Balazard.
Financial & competing interests disclosure
This study was sponsored by Ipsen. Support for third-party writing assistance for this article was funded by Ipsen in accordance with Good Publication Practice guidelines. The collaboration between Ipsen and Owkin was funded by Ipsen.
C Dromain: Received consultancy fees and honoraria from Ipsen; M Pavel: participated in advisory boards for, and received honoraria from AAA, Amgen, Eli Lilly, Ipsen, Lexicon, Novartis, Pfizer and Riemser; M Ronot: Received honoraria from Alexion Pharmaceuticals, Canon Toshiba, GE Healthcare, Guerbet, Ipsen, Servier and Sirtex; N Schaefer, D Mandair: None to declare; D Gueguen, C Cheng: Former employees of Ipsen; O Dehaene, S Jégou: Former employees of Owkin; K Schutte, D Cahané, F Balazard: Employees of Owkin. The authors have no other relevant affiliations or financial involvement with any organization or entity with a financial interest in or financial conflict with the subject matter or materials discussed in the manuscript apart from those disclosed.
The authors thank Izzy Hawkes, and Erin O’Neil, of Costello Medical, UK, for medical writing support and editorial assistance, which was sponsored by Ipsen in accordance with Good Publication Practice guidelines.
Ethical conduct of research
Data are from the CLARINET study. The CLARINET study was approved by all relevant local ethical committees. Consent was obtained from each patient after full explanation of the purpose and nature of all procedures used.
Data sharing statement
The authors certify that this manuscript reports the secondary analysis of clinical trial data that have been shared with them, and that the use of this shared data is in accordance with the terms (if any) agreed upon their receipt. The source of this data is: CLARINET phase III trial (NCT00353496).
Qualified researchers may request access to patient-level study data that underlie the results reported in this publication. Additional relevant study documents, including the clinical study report, study protocol with any amendments, annotated case report form, statistical analysis plan and dataset specifications may also be made available. Patient level data will be anonymized, and study documents will be redacted to protect the privacy of study participants.
Where applicable, data from eligible studies are available 6 months after the studied medicine and indication have been approved in the US and EU or after the primary manuscript describing the results has been accepted for publication, whichever is later.
Further details on Ipsen’s sharing criteria, eligible studies and process for sharing are available here (https://vivli.org/members/ourmembers/).
Any requests should be submitted to www.vivli.org for assessment by an independent scientific review board.
Restrictions apply to the availability of these data since the data underlying this publication were provided by Owkin under contract to Ipsen.
Acknowledgments
The authors thank all patients involved in the study, as well as their caregivers, care team, investigators and research staff in participating institutions. The authors also thank Julie Benzimra, Thibaut Emorine, Lise Minssen, and Ilan Obadia for the annotation of images in the study.
Additional information
Funding
References
- Oronsky B , MaPC, MorgenszternD, CarterCA. Nothing But NET: A Review of Neuroendocrine Tumors and Carcinomas. Neoplasia19(12), 991–1002 (2017).
- Rindi G , MeteO, UccellaSet al. Overview of the 2022 WHO Classification of Neuroendocrine Neoplasms. Endocr Pathol33(1), 115–154 (2022).
- Metz DC , JensenRT. Gastrointestinal neuroendocrine tumors: pancreatic endocrine tumors. Gastroenterology135(5), 1469–1492 (2008).
- Garcia-Carbonero R , CapdevilaJ, Crespo-HerreroGet al. Incidence, patterns of care and prognostic factors for outcome of gastroenteropancreatic neuroendocrine tumors (GEP-NETs): results from the National Cancer Registry of Spain (RGETNE). Ann Oncol21(9), 1794–1803 (2010).
- Cives M , StrosbergJR. Gastroenteropancreatic neuroendocrine tumors. CA Cancer J Clin68(6), 471–487 (2018).
- Raymond E , García-CarboneroR, WiedenmannB, GrandeE, PavelM. Systemic therapeutic strategies for GEP-NETS: what can we expect in the future?Cancer Metastasis Rev33(1), 367–372 (2014).
- Narayanan S , KunzPL. Role of somatostatin analogues in the treatment of neuroendocrine tumors. Hematol Oncol Clin North Am30(1), 163–177 (2016).
- Khan MS , PritchardDM. Neuroendocrine tumours: what gastroenterologists need to know. Frontline Gastroenterology13(1), 50 (2022).
- Raj N , FazioN, StrosbergJ. Biology and systemic treatment of advanced gastroenteropancreatic neuroendocrine tumors. American Society of Clinical Oncology Educational Book38, 292–299doi:10.1200/EDBK_200893 (2018).
- Roviello G , ZanottiL, VenturiniS, BottiniA, GeneraliD. Role of targeted agents in neuroendocrine tumors: results from a meta-analysis. Cancer Biol Ther17(9), 883–888 (2016).
- Uri I , Grozinsky-GlasbergS. Current treatment strategies for patients with advanced gastroenteropancreatic neuroendocrine tumors (GEP-NETs). Clin Diabetes Endocrinol4, 16 (2018).
- Chan DL , ClarkeSJ, DiakosCIet al. Prognostic and predictive biomarkers in neuroendocrine tumours. Crit Rev Oncol Hematol113, 268–282 (2017).
- Therasse P , ArbuckSG, EisenhauerEAet al. New guidelines to evaluate the response to treatment in solid tumors. European Organization for Research and Treatment of Cancer, National Cancer Institute of the United States, National Cancer Institute of Canada. J Natl Cancer Inst92(3), 205–216 (2000).
- Eisenhauer EA , TherasseP, BogaertsJet al. New response evaluation criteria in solid tumours: revised RECIST guideline (version 1.1). Eur J Cancer45(2), 228–247 (2009).
- Vullierme MP , RuszniewskiP, de MestierL. Are recist criteria adequate in assessing the response to therapy in metastatic NEN?Rev Endocr Metab Disord22, 637–645 (2021).
- van Treijen MJC , SchoeversJMH, HeeresBCet al. Defining disease status in gastroenteropancreatic neuroendocrine tumors: Choi-criteria or RECIST? Abdominal Radiology 47(3), 1071–1081 (2022).
- Cives M , PelleE, StrosbergJ. Emerging treatment options for gastroenteropancreatic neuroendocrine tumors. J Clin Med9(11), 3655 (2020).
- Cives M , SoaresHP, StrosbergJ. Will clinical heterogeneity of neuroendocrine tumors impact their management in the future? Lessons from recent trials. Curr Opin Oncol28(4), 359–366 (2016).
- Gatta R , DepeursingeA, RatibO, MichielinO, LeimgruberA. Integrating radiomics into holomics for personalised oncology: from algorithms to bedside. Eur Radiol Exp4(1), 11 (2020).
- Govind D , JenKY, MatsukumaKet al. Improving the accuracy of gastrointestinal neuroendocrine tumor grading with deep learning. Sci Rep10(1), DOI: 10.1038/s41598-020-67880-z (2020).
- Luo Y-J , ChenX, ChenJet al. Preoperative prediction of pancreatic neuroendocrine neoplasms grading based on enhanced computed tomography imaging: validation of deep learning with a convolutional neural network. Neuroendocrinology110, 338–350 (2019).
- Gao X , WangX. Deep learning for World Health Organization grades of pancreatic neuroendocrine tumors on contrast-enhanced magnetic resonance images: a preliminary study. Int J Comput Assist Radiol Surg14(11), 1981–1991 (2019).
- Caplin ME , PavelM, ĆwikłaJBet al. Lanreotide in metastatic enteropancreatic neuroendocrine tumors. N Engl J Med371(3), 224–233 (2014).
- Pavel M , DromainC, RonotMet al. The use of deep learning models to predict progression-free survival in patients with neuroendocrine tumors. Future Oncology (2023).
- Huyge V , GarciaC, AlexiouJet al. Heterogeneity of metabolic response to systemic therapy in metastatic breast cancer patients. Clin Oncol (R Coll Radiol)22(10), 818–827 (2010).
- Humbert O , ChardinD. Dissociated response in metastatic cancer: an atypical pattern brought into the spotlight with immunotherapy. Front Oncol10, DOI: 10.3389/fonc.2020.566297 (2020).
- Parast L , CaiT, TianL. Evaluating surrogate marker information using censored data. Stat Med36(11), 1767–1782 (2017).
- Wang X , ParastL, TianLU, CaiT. Model-free approach to quantifying the proportion of treatment effect explained by a surrogate marker. Biometrika107(1), 107–122 (2020).
- Wang Y , TaylorJM. A measure of the proportion of treatment effect explained by a surrogate marker. Biometrics58(4), 803–812 (2002).
- Dong ZY , ZhaiHR, HouQYet al. Mixed Responses to Systemic Therapy Revealed Potential Genetic Heterogeneity and Poor Survival in Patients with Non-Small Cell Lung Cancer. Oncologist22(1), 61–69 (2017).
- Vitale I , ShemaE, LoiS, GalluzziL. Intratumoral heterogeneity in cancer progression and response to immunotherapy. Nat Med27(2), 212–224 (2021).
- Chou WC , ChenJS, HungYSet al. Plasma chromogranin A levels predict survival and tumor response in patients with advanced gastroenteropancreatic neuroendocrine tumors. Anticancer Res.34(10), 5661–5669 (2014).
- Kim M , LeeS, LeeJet al. The role of plasma chromogranin A as assessment of treatment response in non-functioning gastroenteropancreatic neuroendocrine tumors. Cancer Res Treat48(1), 153 (2016).
- Gut P , CzarnywojtekA, FischbachJet al. Chromogranin A - unspecific neuroendocrine marker. Clinical utility and potential diagnostic pitfalls. Arch Med Sci12(1), 1–9 (2016).
- Dromain C , PavelME, RuszniewskiPet al. Tumor growth rate as a metric of progression, response, and prognosis in pancreatic and intestinal neuroendocrine tumors. BMC Cancer19(1), 66 (2019).
- Tazdait M , MezquitaL, LahmarJet al. Patterns of responses in metastatic NSCLC during PD-1 or PDL-1 inhibitor therapy: Comparison of RECIST 1.1, irRECIST and iRECIST criteria. Eur J Cancer88, 38–47 (2018).
- Hendlisz A , DeleporteA, DelaunoitTet al. The Prognostic Significance of Metabolic Response Heterogeneity in Metastatic Colorectal Cancer. PLOS ONE10(9), e0138341 (2015).
- Carlino MS , SaundersCA, HayduLEet al. (18)F-labelled fluorodeoxyglucose-positron emission tomography (FDG-PET) heterogeneity of response is prognostic in dabrafenib treated BRAF mutant metastatic melanoma. Eur J Cancer49(2), 395–402 (2013).
- Woff E , HendliszA, GarciaCet al. Monitoring metabolic response using FDG PET-CT during targeted therapy for metastatic colorectal cancer. Eur J Nucl Med Mol Imaging43(10), 1792–1801 (2016).
- Puranik AD , DromainC, FleshnerNet al. Target Heterogeneity in Oncology: The Best Predictor for Differential Response to Radioligand Therapy in Neuroendocrine Tumors and Prostate Cancer. Cancers (Basel)13(14), 3607 (2021).
- Wang L , TangK, ZhangQet al. Somatostatin Receptor-Based Molecular Imaging and Therapy for Neuroendocrine Tumors. Biomed Res Int2013, DOI: 10.1155/2013/102819 (2013).
- Önner H , AbdülrezzakÜ, TutuşA. Could the skewness and kurtosis texture parameters of lesions obtained from pretreatment Ga-68 DOTA-TATE PET/CT images predict receptor radionuclide therapy response in patients with gastroenteropancreatic neuroendocrine tumors?Nucl Med Commun41(10), 1034–1039 (2020).
- Boudreaux JP , KlimstraDS, HassanMMet al. The NANETS Consensus Guideline for the Diagnosis and Management of Neuroendocrine Tumors: Well-Differentiated Neuroendocrine Tumors of the Jejunum, Ileum, Appendix, and Cecum. Pancreas39(6), 753–766 (2010).
- Kunz PL , Reidy-LagunesD, AnthonyLBet al. Consensus guidelines for the management and treatment of neuroendocrine tumors. Pancreas42(4), 557–577 (2013).
- Dasari A , ShenC, HalperinDet al. Trends in the Incidence, Prevalence, and Survival Outcomes in Patients With Neuroendocrine Tumors in the United States. JAMA Oncol3(10), 1335–1342 (2017).