In the article: Kim J, Lee S-Y & Lee K-A. Copy number variation and gene rearrangements in CYP2D6 genotyping using multiplex ligation-dependent probe amplification in Koreans. Pharmacogenomics 13(8), 963–973 (2012) (www.tandfonline.com/doi/pdf/10.2217/pgs.12.58), Figures 2 and 3 were incorrectly shown as:
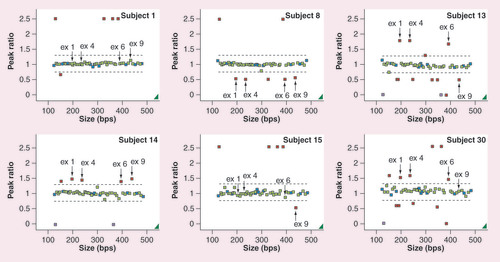
Each colored box represents a probe for a region of amplified DNA. Two dashed black lines represent defined boundaries (0.75–1.3). Blue boxes represent reference probes. Green boxes represent amplified fragments of CYP and glutathione S-transferase genes within the range of the population while red boxes represent beyond the normal, indicating an aberrant gene dosage. Solid black arrows indicate the probe location of the CYP2D6 exons 1, 4, 6 and 9. The subject number is marked in the right upper corner. Each figure represents subject 1 with normal CYP2D6 copy number, subject 8 with whole-gene deletion, subject 14 with whole-gene duplication, subject 15 with two normal copies of exons 1–6, but one copy deletion of exon 9, and subject 30 with three copies of exons 1–6 while having two copies of exon 9 of the CYP2D6 gene.
ex: Exon.
Each peak represents a specific probe amplification product. The first chromatogram represents whole-gene deletion (blue peak) while the bottom chromatogram represents the duplication of exon 1–6 and normal copy number of exon 9 compared with the normal control group (red peak). Note how the blue peak is 0.5-times higher and shorter for 1-copy duplication and deletion, respectively.
ex: Exon; nt: Nucleotide; RFU: Relative fluorecent unit.

The correct figures are shown below:
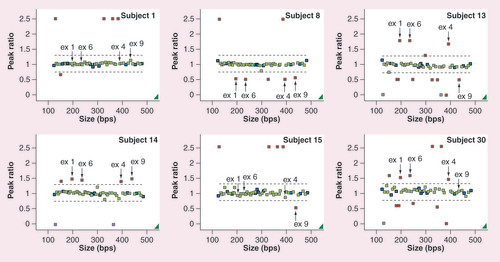
Each colored box represents a probe for a region of amplified DNA. Two dashed black lines represent defined boundaries (0.75–1.3). Blue boxes represent reference probes. Green boxes represent amplified fragments of CYP and glutathione S-transferase genes within the range of the population while red boxes represent beyond the normal, indicating an aberrant gene dosage. Solid black arrows indicate the probe location of the CYP2D6 exons 1, 4, 6 and 9. The subject number is marked in the right upper corner. Each figure represents subject 1 with normal CYP2D6 copy number, subject 8 with whole-gene deletion, subject 14 with whole-gene duplication, subject 15 with two normal copies of exons 1–6, but one copy deletion of exon 9, and subject 30 with three copies of exons 1–6 while having two copies of exon 9 of the CYP2D6 gene.
ex: Exon.
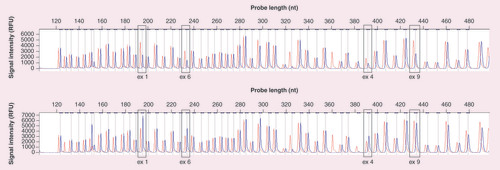
Each peak represents a specific probe amplification product. The first chromatogram represents whole-gene deletion (blue peak) while the bottom chromatogram represents the duplication of exon 1–6 and normal copy number of exon 9 compared with the normal control group (red peak). Note how the blue peak is 0.5-times higher and shorter for 1-copy duplication and deletion, respectively.
ex: Exon; nt: Nucleotide; RFU: Relative fluorecent unit.
The authors and editors would like to sincerely apologize for any confusion or inconvenience caused.