
Abstract
Conclusion: Three-dimensional cone beam computed tomography (3DCT) images revealed characteristic malformations of the membranous labyrinth of the inner ear in Meniere’s disease (MD). The morphology of the membranous region between the vestibular cecum of the cochlea and the saccule of ears with MD was compared to that of healthy ears. The present study supports the hypothesis proposed earlier that reuniting duct blockade is a result of the dislodgement of saccular otoconia. Objective: To visualize the membranous labyrinth using 3DCT and to investigate the pathology of MD. Methods: A preparatory study was conducted to determine the optimal 3DCT window settings for the detection of water, muscle, calcium carbonate (CaCO3), and bone. Based on this preparatory study, the ears of 13 healthy volunteers and 25 MD patients definitely diagnosed according to the criteria issued by the Committee on Hearing and Equilibrium of the American Academy of Otolaryngology, Head and Neck Surgery (AAO-HNS), were visualized. Results: The differences in the membranous labyrinth between MD ears and healthy ears could be visualized using 3DCT. The images were classified into three types based on their morphological pattern. The ears of patients with MD were different from normal ears in terms of this classification.
Introduction
The cause of Meniere’s disease (MD) remains unknown despite the many studies reported so far. Currently, the pathophysiology of MD is described as idiopathic endolymphatic hydrops [Citation1,2].
According to the guidelines of the American Academy of Otolaryngology, Head and Neck Surgery (AAO-HNS), the diagnosis of MD requires the detection of endolymphatic hydrops in the inner ear [Citation3]. However, this is only possible in temporal bone specimens, and thus, not feasible in clinical settings. Some indirect methods, such as electrocochleography [Citation4] and vestibular evoked myogenic potential (VEMP) [Citation5], can suggest the existence of endolymphatic hydrops. Recently, magnetic resonance imaging (MRI) has been used to detect endolymphatic hydrops using local or systemic gadolinium contrast enhancement via the middle ear [Citation6]. However, the need for qualitative MRI, the difficulty in confirming endolymphatic hydrops, and the administration of contrast agents into the middle ear limit the number of capable medical facilities. Despite having been used to describe MD [Citation7–9], computed tomography (CT) has not been accepted as a useful tool to detect or diagnose MD [Citation10]. To implement a more widely available method, we have been suggesting the use of three-dimensional cone beam CT (3DCT) imaging [Citation11–13]. This strategy is based on the idea that the disturbance in longitudinal flow of endolymph leads to endolymphatic hydrops. In animal models [Citation14] and human temporal bone specimens of MD cases [Citation15], endolymphatic hydrops occur at the anatomic narrows of the endolymphatic pathway [Citation16]. These narrow points can be visualized using 3DCT imaging, and their patency can be investigated by analyzing their bony grooves [Citation11–13]. The frequently recognized distorted visualization of these narrow points in MD cases suggests disturbances in the endolymphatic flow.
Visualization of the membranous labyrinth would provide more precise information on the characteristic malformations of the MD inner ear. With 3DCT imaging, it is possible to use several CT window values (CTWVs) per image. Therefore, in the present study, we used 3DCT to compare the anatomical narrows of the endolymphatic pathway of the membranous labyrinth of MD ears with those of normal cases.
Material and methods
Preparatory study for 3DCT window settings
Various substances, specifically soft tissue (meat fragment), water, CaCO3 (main component of otoconia), and bovine bone, were placed into polyethylene tubes and imaged using the appropriate CTWVs by using a cone beam CT scanner (3D Accuitomo; J. Morita Mfg Corp., Kyoto, Japan) under the same conditions as previously reported [Citation11–13]: 80 kV, 6 mA; voxel size 0.125 × 0.125 × 0.125 mm; and slice thickness 0.5 mm. CT images were acquired for a column of 6 cm in diameter and 6 cm in height. Reconstructed 3D images of the inner ear were obtained using rendering software (IVIEW) in a perspective view with a viewing angle of 15° and 0.25 mm voxel size (0.25 × 0.25 × 0.25 mm). The data obtained in this preparatory study were applied for imaging of the inner ear of the study subjects.
Subjects
This study included 25 definite MD patients (18 men and 7 women; mean age 58.1 years) who were diagnosed according to the AAO-HNS guidelines [Citation3] (). The 26 ears of 13 healthy volunteers (7 men and 6 women; mean age 57.6 years) were used as controls. Approval for the study was obtained from the ethics committee of Osaka City University Graduate School of Medicine.
Table I. Records of patients with Meniere’s disease.
The membranous components of the inner ear were imaged with the 3D Accuitomo cone beam CT scanner using the CT window settings obtained in the preparatory study. We focused on the 3DCT images of the membranous image between the vestibular cecum of the cochlea and saccule (MICS), i.e. where the reuniting duct is located, by adopting the additional image in which the common crus formed a horizontal line in the view. The 3DCT images were examined by three otolaryngologists. Four-frequency pure-tone average (PTA) was calculated by measuring the hearing thresholds at 0.5, 1, 2, and 4 kHz. AAO-HNS guidelines suggest that 3 kHz can be used to calculate PTA. However, 3 kHz is not commonly used in Japan, and was thus replaced by 4 kHz in this study.
Statistical analysis
The frequencies of the MICS components in the affected and non-affected ears of MD patients and control volunteers were analyzed by Yates m × n chi-squared tests.
Results
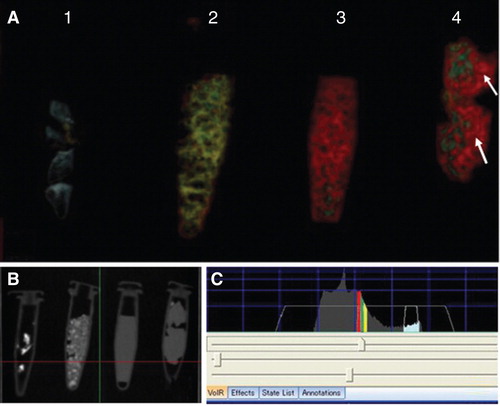
The 3DCT images of the meat fragment, water, CaCO3, and bone obtained in the preparatory study are shown in . Their CTWVs were found to vary in the following order: air spaces, water, meat fragment, CaCO3, and bone. The water, meat fragment, and CaCO3 had similar CTWVs, but CTWV of the CaCO3 most located to that of bone. It was possible to observe water in the 3DCT image of the meat fragment ().
Figure 1. 3DCT images of several substances. (A) 3DCT images of bone, CaCO3, water, and soft tissue at optimal CT window values (CTWVs). 1, Bone (bovine; blue); 2, CaCO3 (yellow); 3, water (red); 4, soft tissue (meat fragment; green). Note that the meat fragment contains water (arrows). (B) Simple CT view of the several substances in the polyethylene tubes. (C) CTWVs of each substance.
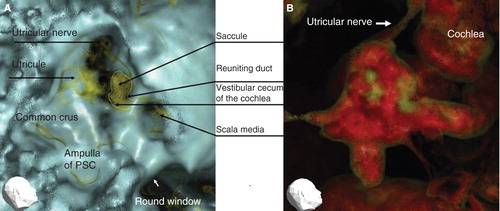
Membranous inner ear imaging revealed the location of the saccule and the utricles of human subjects, irrespective of whether they were healthy subjects () or MD patients ().
Figure 2. Representative 3DCT images of a right healthy ear. (A) Image obtained using CT window values (CTWVs) of CaCO3 (yellow) and bone (blue). (B) Image obtained using CTWV of CaCO3 (yellow) and water (red). PSC, Posterior semicircular canal.
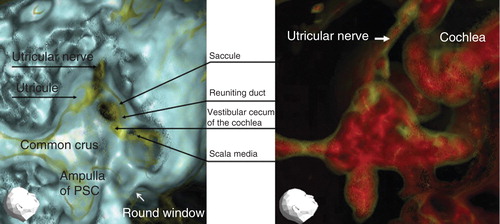
Figure 3. Representative 3DCT images of the right ear of a patient with Meniere’s disease. (A) Image obtained using CT window values (CTWVs) of CaCO3 (yellow) and bone (blue). (B) Image obtained using CTWV of CaCO3 (yellow) and water (red). PSC, Posterior semicircular canal.
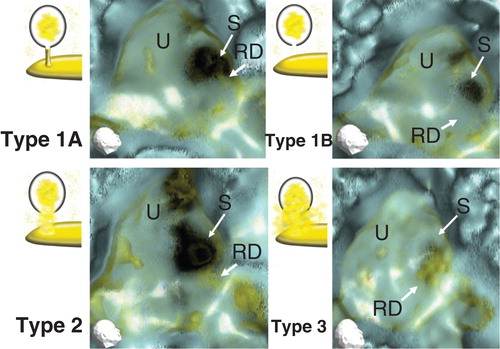
However, the MICS were different between healthy and MD ears (). Generally, the morphology of MD ears was impaired as compared with healthy ears. The MICS of healthy ears showed a narrow or almost absent line (). On the other hand, the MICS of MD ears showed a broad, irregular, and densely scattered line (). MICS were classified into three types as follows (). Type 1 was classified into two subtypes: type 1A showed a neck-like canal or rod image and type 1B showed no apparent object image in MICS. Type 1 was hardly recognized in the affected ears of MD patients (4/25, 16%). The ratio between type 1A and type 1B was 7/19 (36.8%) in the healthy individuals and 9/13 (69.2%) in the non-affected ears of MD patients. Type 2 showed an irregular and relatively wide MICS, which however kept the original aspect of the reuniting duct. Type 3 showed an irregular, wide, and condensed MICS with no resemblance to the reuniting duct. To avoid subjective classification bias, no further MICS subclassification was performed.
Figure 4. MICS (membranous image between the vestibular cecum of the cochlea and saccule) in a right healthy (A) and Meniere’s disease (MD) (B) ear, and schematic representation of the vestibule (C). The neck-like narrow line, here represented with a dotted line, indicates the localization of the reuniting duct. Note that the MD ear has a wide, irregular, and condensed reuniting duct, whereas that of the healthy ear is narrow. CC, vestibular cecum of the cochlea; RD, reuniting duct; S, saccule; U, utricle.
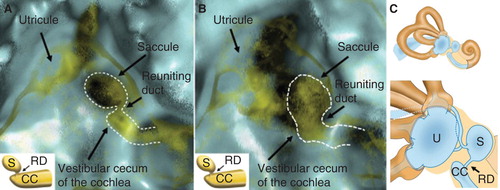
Figure 5. Representative 3D-CT MICS (membranous image between the vestibular cecum of the cochlea and saccule) classified into three types. Type 1: a neck-like or rod-like narrow line image (type 1A), and no apparent object image in MICS (type 1B). Type 2: irregular and relatively wide line, which however kept the original aspect of the reuniting duct. Type 3: irregular, wide, and condensed MICS with no resemblance to the reuniting duct. RD, reuniting duct; S, saccule; U, utricle.
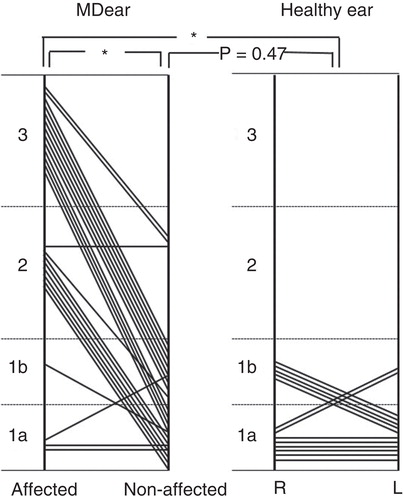
The MICS of the affected side ears of MD patients were mainly classified into type 2 or type 3 (). The MICS patterns of MD patients were significantly different from those of healthy volunteers (p < 0.01), and from those of the non-affected ears of MD patients (p < 0.01). However, there was no significant difference between the healthy ears and the non-affected ears of MD patients (p = 0.47).
Figure 6. Distribution of the MICS (membranous image between the vestibular cecum of the cochlea and saccule) pattern in Meniere’s disease (MD) and healthy ears. For a description of MICS types, please refer to the legend for . *p < 0.01.
Discussion
The visual assessment of the bony grooves of the reuniting duct, saccular duct, and endolymphatic sinus can provide information about their membranous composition because they lodge on those grooves [Citation11–13]. In the present study, the membranous inner ear of the temporal bones was visualized as MICS, and the differences between healthy and MD ears were clarified.
Water, soft tissue, and CaCO3 each have their CTWVs. However, the values are very similar, with increasingly smaller differences toward the bone’s CTWVs levels in that order. The CTWV of soft tissue (meat fragment) partially overlaps with that of water. This provides an explanation for the fact that soft tissue revealed water in its content, as shown in . This result confirmed the validity of the present investigation, i.e. it is possible to use different CTWVs per image as a strategy to visually interpret the morphology of the membranous inner ear (tentatively named as membranous composition of the inner ear).
In human subjects, the frame of the membranous inner ear showed a CTWV different from that of the inner ear fluids (water) but similar to that of CaCO3. This suggests that the frame of the membranous inner ear is composed of a more hydrophobic substance such as fibrous tissue. In this line, the saccule and utricle were outlined by a membranous frame and CaCO3-rich otoconia in the inner ear fluid. However, it was difficult to discriminate between the membranous frame of the inner ear and CaCO3 in our 3DCT images.
By using the CTWV for the utricle and saccule, we were able to visualize the reuniting duct. The visualization of this membranous labyrinth of the reuniting duct among the membranous inner ear has led to some thoughts. The reuniting duct (a narrow duct) shows a narrow (7 of 26 ears) or almost absent band (19 of 26 ears) in the MICS of the healthy ear. This visualization was probably possible because the reuniting duct is very narrow [Citation17,18], and therefore, its surrounding membranes locate close together to sometimes appear in the 3DCT image as a membranous labyrinth. However, the constant discrimination of the membranous labyrinth of the reuniting duct from the other membranous inner ear components is difficult in healthy ears.
On the other hand, the MICS of the reuniting duct of MD patients showed irregular widening and broad condensed aspects, which differed greatly from those of healthy ears ( and ). This irregular widening (type 3) does not correspond to the simple widening of the membranous labyrinth. When the membranous labyrinth is enlarged, its image is darkened owing to the fact that the surrounding facing membranes are far from each other. On the other hand, the enhanced image of the reuniting duct with irregular and widening aspects in MD is caused by morphological malformations. These morphological malformations may be detected by using the same CTWV as for CaCO3. From the limited viewpoints of 3DCT, this characteristic image in the affected ears of MD patients may originate from the existence of otoconia-like substances, infection-associated hydrophobic substances, or both.
The present study supports the hypothesis proposed earlier that reuniting duct blockade is a result of the dislodgement of saccular otoconia [Citation11,13]. The 3DCT images of the vestibule in MD cases were generally messy, which suggests possible infection (e.g. non-diagnosed vestibulitis or sacculitis). The non-affected ears of MD patients sometimes showed type 2 MICS. The frequency of those cases was not significantly different from that of healthy volunteers, and a larger sample number might be needed to distinguish between them.
The vestibular cecum of the cochlea (CC) is frequently visible. This may be explained by the fact that facing membranes of the membranous labyrinth are located near each other. The CC has a narrower lumen than other cochlear turns, making it more readily visible.
However, the CC seemed more visible as a condensed and irregular image in MD cases. The CC can have precipitation of otoconia-like substances in patients with MD symptoms [Citation19,20]. Therefore, it is possible that the CC was affected by the dislodged otoconia from the saccule and/or some kinds of insults there.
Nonetheless, the differences in 3DCT images show different characteristics between healthy and MD ears.
The present investigation first shows the usefulness of 3DCT imaging of the membranous labyrinth for the objective diagnosis of MD, and strongly suggests that dislodged saccular otoconia have an important role in MD.
Assessment of the reuniting duct may not be sufficient to explain the cause of MD. It is also necessary to assess the other membranous narrow points in the endolymphatic pathway, such as the saccular duct and the endolymphatic duct. This should be elucidated in a future study.
Declaration of interest: The authors report no conflicts of interest. The authors alone are responsible for the content and writing of the paper.
References
- Yamakawa K. Über die pathologishe Veränderung bei einem Meniere Kranken. J Otorhinolarngol Soc (Jpn) 1938;44:2310–12.
- Hallpike CS, Cairns H. Observation on the pathology of Meniere’s syndrome. J Laryngol Otol 1938;53:625–55.
- Committee on Hearing and Equilibrium guidelines for the diagnosis and evaluation of therapy in Meniere’s disease. American Academy of Otolaryngology-Head and Neck Foundation, Inc. Otolaryngol Head Neck Surg 1995;113:181–5.
- Eggermont JJ. Summating potential and Meniere’s disease. Arch Otorhinolaryngol 1979;222:63–75.
- De Waele C, Tran Ba Huy P, Diard JP. Saccular dysfunction in Meniere’s disease. Am J Otol 1999;20:223–32.
- Nakashima T, Naganawa S, Sugiura M, Teranishi M, Sone M, Hayashi H, et al. Visualization of endolymphatic hydrops in patients with Meniere’s disease. Laryngoscope 2007;117:415–20.
- Stahle J, Friberg U. The vestibular aqueduct in patients with Meniere’s disease. Acta Otolaryngol 1974;78:36–48.
- Yazawa Y, Kitahara M. Computerized tomography of the petrous bone in Meniere’s disease. Acta Otolaryngol Suppl 1994;510:67–72.
- Yamamoto E, Mizukami C, Isono M, Ohmura M, Hirono Y. Observation of the external aperture of the vestibular aqueduct using three-dimensional surface reconstruction imaging. Laryngoscope 1991;101:480–3.
- Sajjadi H, Paparella M. Meniere’s disease. Lancet 2008;732:406–14.
- Yamane H, Takayama M, Sunami K, Sakamoto H, Imoto T, Anniko M. Blockage of reuniting duct in Meniere’s disease. Acta Otolaryngol 2010;130:233–9.
- Yamane H, Takayama M, Sunami K, Sakamoto H, Imoto T, Anniko M. Visualization and assessment of saccular duct and endolymphatic sinus. Acta Otolaryngol 2011;131:469–73.
- Yamane H, Sunami K, Iguchi H, Sakamoto H, Imoto T, Rask-Andersen H. Assesment of Meniere’s disease from a radiological aspect – saccular otoconia as a cause of Meniere’s disease? Acta Otolaryngol 2012;132:1054–60.
- Kimura RS, Schuknecht HF, Ota CY, Jones DD. Obliteration of the ductus reuniens. Acta Otolaryngol 1980;89:295–309.
- Schuknecht HF, Rüther A. Blockage of longitudinal flow in the endolymphatic hydrops. Eur Arch Otorhinolaryngol 1991;248:209–17.
- Kitamura K, Schuknecht H, Kimura R. Cochlear hydrops in association with collapsed saccule an ductus reuniens. Ann Otol Rhinol Laryngol 1982;91:5–13.
- Jahnke V, Giebel W. Unterschuungen zur Durchängigkeit des Ductus reuniens beim Menschen. Larung Rhinol 1975;54:667–70.
- Anson BJ, Donaldson JA. 1981. Surgical anatomy of the temporal bone. 3rd edn. Philadelphia: WB Saunders.
- Gussen R, Adkins WY Jr. Saccule degeneration and ductus reuniens obstruction. Arch Otolaryngol 1974;99:132–5.
- Gussen R. Saccule otoconia displacement into cochlea in cochleosaccular degeneration. Arch Otolaryngol 1980;106:161–6.