Abstract
Results of measurements of quantities in laboratory medicine are used for diagnosis, prediction and monitoring of disease. Evaluation of results is based on evidence and practical experience. In both cases consistency and transferability of results is needed. For diagnosis and prediction a result is compared to a reference value or reference interval whereas in monitoring it is more important to compare results of measurements with previous results. The analytical goals may therefore vary depending on the intended use of the results and both trueness and precision will need to be considered. The analytical goals may also be influenced by the disease characteristics. A brief review of available methods and principles will be given.
Introduction
A huge number of laboratory results are produced daily and modern medicine relies heavily on their availability. As discussed in the present Supplement verification of the clinical importance is often disputable and always difficult to accomplish. It is reasonable to assume that some or many are requested and reported without any noticeable or even possible contribution to the diagnosis or outcome of treatment. In some health cultures requests of measurements may be justified for legal protection of professionals. The usefulness of results depends on many factors e.g. relevance for the suspected condition (diagnostic performance) and trueness and precision of the measurement.
It may be assumed that a majority of laboratories at one time or another has tried to reduce the use of laboratory investigations. It is unlikely and experience has shown that this is not a way forward; the pieces of information that the laboratories provide are useful contributions to the clinicians in the overall decision regarding diagnosis and treatment of a patient. The risk for false results that may distract the physician is probably small considering the wealth of additional information that is available to the experienced physician. Moreover, the modern health care systems require a fast processing – almost industrial – of patients and therefore cannot afford too much of deliberations of physicians before ordering a test.
“Evidence based laboratory medicine” may therefore have a minor impact on the use of existing routines. The results of even the most sophisticated evaluation of the performance of a diagnostic test may be offset by experienced clinicians' ability to increase the prevalence of disease or the pretest probability of a specific diagnose.
There have been numerable attempts to define the analytical goals in terms of trueness and precision. This report will therefore focus on defining goals in terms of understanding of the concept of uncertainty of measurements.
Clinical goals
The ISO technical committee 212 established a working group in the 1990-ies to rationalize the various approaches for determining desirable analytical goals. Although the ambition was good it proved impossible to reach a consensus and the project was eventually disbanded [Citation1]. However, in the Stockholm conference in 1999 [Citation2] a hierarchical structure was accepted:
Evaluation of the effect of analytical performance on clinical outcomes in specific clinical settings
Evaluation of the effect of analytical performance on clinical decisions in general
a. Data based on components of biological variation
b. Data based on analysis of clinicians opinions
Published professional recommendations
a. From national and international expert bodies
b. From expert local groups or individuals
Performance goals set by
a. Regulatory bodies
b. Organizers of EQA schemes
Goals based on the current state of the art
a. As demonstrated by data from EQA or PT schemes
b. As found in current publications on methodology
The approach using intra- and inter-individual variations seems to have generated most attention and a table comprising the biological variation of several hundred quantities has been published [Citation3] and is currently updated and maintained on the Westgard homepage [Citation4].
The desirable quality specifications were based on the interindividual (CVb) and intraindividual (CVw) variation

The total error (TE) is a sum of bias and imprecision. It contains information on bias and it raises the question why carry it along if it is known and thus could be eliminated with an uncertainty that can be estimated.
Analytical goals
Precision is “closeness of agreement between indications or measured quantity values obtained by replicate measurements on the same or similar objects under specified conditions” and
“Measurement precision is usually expressed numerically by measures of imprecision, such as standard deviation, variance, or coefficient of variation under the specified conditions of measurement” [Citation5].
This is thus a fairly straightforward concept that is used in virtually all laboratories. However, it can be estimated in different ways and – as the definition implies – needs specified conditions. To be comparable between laboratories, comparable to claims by manufacturers and publishable in scientific reports the statistical procedures needs to be agreed.
Already in the original Ricos' paper [Citation3] the statistical method to estimate the within- and between individual variation that scored highest was a nested ANOVA to estimate the biological variance components. This approach is now more and more used also in estimating the analytical imprecision, e.g. recommended in the CLSI EP documents [Citation6]. This approach allows a better understanding of the contribution from within and between series variation.
There are other variables that need to be considered in the design of an imprecision estimation e.g. lot-to-lot variation, changes of calibrators and other unspecified operation conditions. Although in the short term these variations may be viewed as systematic errors they may become random variables in the longer perspective. The conditions under which the imprecision has been estimated therefore needs to be specified. It is of importance that a common understanding is developed between laboratories and industry. Laboratories need to be able to verify the industry's claims and industry needs to understand the claims in the laboratories' specifications of new equipment.
Trueness
VIM [Citation5] defines
Trueness as the “closeness of agreement between the average of an infinite number of replicate measured quantity values and a reference quantity value” “Measurement trueness is inversely related to systematic measurement error” and Bias is the “estimate of a systematic measurement error” and the numeric expression of trueness.
Measurement accuracy – closeness of agreement between a measured quantity value and a true quantity value of a measurand” therefore, Accuracy should not be used for ‘measurement trueness’ and vice versa.
The concepts of trueness and bias thus no longer include a comparison with a “true value” whereas accuracy does. It is unclear why this difference remains but it is essential that the requirement of comparing with a true value has been abandoned for trueness and bias. Accuracy is reserved for describing the characteristics of one result and thus comprises both precision and trueness.
Trueness has become more important as the health systems rely on global experience and expertise and in comparing results with defined values e.g. reference intervals in setting diagnosis and in defining diagnostic and therapeutic strategies. Patients move more than previously and consult different levels of health care systems. A global attention to this is imperative as more information becomes available to patients and physicians over the internet. Unless we can find a technique to ensure trueness, reference intervals, diagnostic strategies and treatment recommendations remain local. Conclusions drawn from multicenter studies and meta-analysis will be difficult or impossible to carry out and trust.
Previous attempts to characterize laboratory performance
Drs William Sunderman Sr in Boston [Citation7], Ian Wootton [Citation8] in London and David Tonks in Toronto [Citation9] were vanguards in improving “accuracy and precision” i.e. trueness and precision in modern terminology. They established models for comparison of results between laboratories. These studies probably generated the generic templates for external quality assessment schemes (EQA) or proficiency testing (PT) which still are in use although much more sophisticated control materials, calculations and presentations are now available.
The Belk and Sunderman's study was designed to investigate the trueness (called accuracy) of laboratories from the “above” perspective. They did not address the precision of the individual laboratory but described the distribution of the results in a region (Pennsylvania). The methods used by the laboratories were not mentioned. A total of eight quantities were studied. Basically, the circulated samples were supposed to be treated and their concentrations measured as patient samples, i.e. just once and without any particular precautions. The results were presented in multiple histograms and as a table from which the data in have been extracted. The analytical goals were specified and the outcome in terms of how many laboratories reported results within the defined intervals. As comparison a similar report from a routine EQA survey is presented. Klee recently published a review of different outcome related performance goals [Citation10].
Table I. Analytical goals specified by Belk and Sunderman 1946 [Citation7] and outcome of a survey by the Swedish EQAS Equalis (www.equalis.se, available in English). US values in g/dL, SE values in SI units. Glucose in the 1946 study was most likely “reducing substance”.
The importance of laboratory services to medicine was pointed out by Sir Henry Dale [Citation11] and this spurred the development the performance of measurements. Wootton and King [Citation12] established a first presentation of “normal values” and the distribution of 19 quantities in serum and plasma and eight in whole blood. They concluded that “very large disagreement exists between different laboratories”. Wootton, a year later, presented the first international survey under the auspices of IFCC and IUPAC [Citation8]. It was concluded that laboratories were able to compare two samples better than they were to determine the value of a quantity, which illustrates the problem of bias.
Tonks [Citation9] made similar observations of the differences between results from the participating 170 laboratories in Canada and formulated goals for their performance. It is not quite clear if that concept refers to the distribution among laboratories or within the specific laboratory.
The much used “Tonks rule” describes the “allowable limits of error”
It is amazing that this rule could gain such an acceptance particularly in view of the definition of normal ranges – nowadays reference intervals. Most quantities are not normally distributed and the mean is not a relevant measure. Gräsbeck [Citation13] pointed out that “normal” is an undefined concept and has no theoretical foundation or rational and coined the concept “reference interval”. Tonks described his rule as “an empirical formula which the author has found usefulbut it does address the fundamental idea of goal setting: relating the goal to the interval outside which results should be identified as potentially erroneous or misleading.
On another note it is important to emphasize that an “interval” is always between – or including – two limits whereas “range” is always the difference between two limiting values [Citation5]. Therefore, it is erroneous to use “reference range”; it should be “reference interval”.
Calibration
Trueness is probably a difficult performance criterion to assess. In physics and in pure analytical chemistry it may be manageable; those disciplines often work with pure systems and quantities such as length, area, time or concentration of pure or simple mixtures. A well characterized calibrator will stand a good chance to provide transferable and reproducible results.
In more complex systems, like those we face in laboratory medicine this is rarely possible. Forensic, food and environmental chemistry and other disciplines have similar problems as laboratory medicine and clinical chemistry.
Various methods have been tried to calibrate measurements in our systems i.e. blood, serum and plasma. Anecdotally, Jaffe who has given his name to the reaction between creatinine and alkaline picrate is not known to ever have measured the creatinine concentration. One of the first who actually documented the use of this reaction was Otto Folin professor at Harvard and proposed for the Nobel prize on six occasions. He used deproteinized blood or serum and purified creatinine as the calibrator. The sample and calibrator solutions reacted with alkaline picrate and the colour of the solutions were compared using a Dubosque colorimeter.
The principle is the same for many quantities that we measure today. A calibration function is established between the absorbance, fluorescence or radioactivity, and known concentrations of the pure material. The caveat is that the pure material and compound in the particular system may not react quantitatively identically as the biological sample. This is known as deficient commutability of the calibrator/reference material, i.e. it does not respond in the reactions like the sample.
The more complex molecules we want to study, the higher the demands on the assay, including the calibrator and reference materials. There have been several initiatives to improve the calibrators. The most promising are coordinated by the Joint Committee for Traceability in Laboratory Medicine (JCTLM) which is a collaboration between the International Committee for Weights and Measures (CIPM), the International Federation for Clinical Chemistry and Laboratory Medicine (IFCC), and the International Laboratory Accreditation Cooperation (ILAC). JCTLM “provides a worldwide platform to promote and give guidance on internationally recognized and accepted equivalence of measurements in laboratory medicine and traceability to appropriate measurement standards”.
IFCC has launched calibrators together with industry e.g. the IFCC protein calibrator 470, the HbA1c and apolipoprotein calibrators. For many years the WHO has provided industry and profession with calibrators, mainly in the field of hormones. Other organizations like the NIST (National Institute for Science and Technology) in the US and IRMM (Institute for Reference Materials and Measurements) in Europe produce reference materials of very quality that can also be used for calibration.
The ISO TC 212 has published three very important standards on the traceability of calibrators and on the requirements for reference materials [Citation14–16]. “Definitive methods” or reference methods were developed in the 80-ies and 90-ties and are based on measuring the concentration of the component with a method with a high precision and specificity. The method of choice is often based on mass-isotope dilution spectrometry which allows the intensity of characteristic fragments to be used for quantifications. Also these methods may suffer from lack of trueness if, for instance, the formation of the derivative is not 100 percent or the used internal standard does not react to 100 percent.
Uncertainty of measurements
There is a vast literature about goal setting [Citation17–19] and there are national lists established for instance in the US, Germany and Russia of performance goals. Sometimes the goals are not possible to reach with the present technique; sometimes the performance is much better than the goals. The analytical methods have improved by introducing better reagents, calibrators and automation. New techniques and understanding of the pathophysiology have fuelled the development.
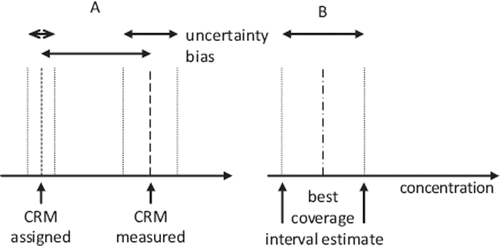
In view of modern thinking we should abandon the total error concept and estimate the uncertainty of the measurement procedure. The main difference lies in the perception of the “error”. In short, if the error is known let us compensate for it. The bias should be established in a comparison between the test method and the best available comparative method and a “recalibration function” established by a suitable regression analysis and used either on each quantity value or in adjusting the value of the calibrator. An uncertainty of the success of recalibration remains and this will therefore be added to the measurement uncertainty to obtain the combined uncertainty (). The outcome is an uncertainty interval within which the best estimate of the quantity value will expected with a given probability.
Figure 1. A) The bias of the measured quantity value of a Certified Reference Material (CRM) is adjusted to the assigned value giving B) the “best estimate” of the quantity value with an increased uncertainty. The “best estimate” of the quantity value coincides with the assigned value of the CRM after the correction. The best estimate will be within the coverage interval with a stated probability (p). From CLSI, with permission
Comparison of measurement methods – recalibration with patient material
It is still an open question if the problem of insufficient trueness can be solved with traceable calibrators, i.e. imprecision between laboratories. Bias is therefore usually assessed by comparison of measurements of biological samples by two methods, one of which is assumed to be on a higher metrological level. Comprehensive schemes for the comparisons have been published by CLSI – the EP documents [Citation6]. Ideally a comparison should be between a test method and a method on a “higher metrological level”. The latter need not have a zero bias i.e. absolute trueness but it should be stable and possible to reproduce at various locations with a measurable reproducibility.
The CLSI procedures require a large number of samples which can be impossible to collect even for larger laboratories. We have therefore tried another approach, taking advantage of the fact that between two points only one straight line can be drawn. If these two points can be determined with a high precision it would be possible to estimate a regression and thus a recalibration function and simultaneously estimate the uncertainty in the estimates. This requires two representative samples and that the regression must be linear.
In essence this is a two-point calibration using calibrators which concentrations have been either determined by a dedicated method or as a mean of several laboratories. It is likely that their commutability is good.
Recalibration of apolipoprotein concentration measurements
Several studies have shown that there is an almost linear relationship between the relative risk for MI and the ratio between ApoB and ApoA. It has been suggested that a target value of the ratio should be 0.8 for men and 0.7 for women. This can be translated to a necessary sensitivity of 0.1, i.e. the method should allow differentiating between a ratio of 0.7 and 0.8. Let us assume that the assays can be performed with the same relative uncertainty. The combined uncertainty of the difference shall be less than the minimal recognizable difference with a given probability. This allows us to define an analytical goal:
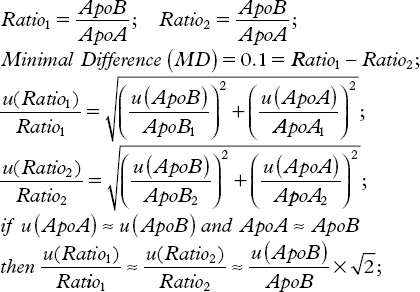

The relative within laboratory uncertainty of the measurement of each of the apolipoproteins need to be less than about 7% or about 3,5% for a probability to recognize a difference of about 95%. To establish reference intervals or diagnostic and therapeutic recommendations the between laboratory variation needs to be of the same magnitude.
Results
We pooled serum to obtain two calibration samples at a high and low concentration respectively and enough material of 40 serum samples of various concentrations for eleven laboratories. The eleven laboratories used their routine methods. Reagents and instruments were from Abbott, Bayer/Siemens, Beckman and Kone. All kits used calibrators that were traceable to the IFCC calibrator.
The patient samples were split into 11 portions and frozen at −20°C. Each laboratory was instructed to measure the calibrators six times and submit the results. These were used to establish a recalibration function for each of the laboratories in relation to the mean of all results. Three months after the recalibration the frozen patient samples were distributed and measured by each of the laboratories. The results were recalculated using the previously established recalibration functions.
In the mean values of the laboratory results are reported and the between laboratory variation as estimated from analysis of the variance components. A recalibration improves the performance to a degree that would make the apolipoprotein measurements useful for diagnosis and monitoring, provided the individual laboratory can keep up the precision of measurement.
Table II. Results of recalibrating Apolipoprotein A1 and B.
We thus have a technique to estimate the performance of the laboratories. We have techniques to monitor the performance of laboratories to guarantee that results will stay within certain intervals of random variation and within definable limits of systematic error. We also have a mechanism to estimate an analytical goal from clinical demands, if they can be agreed.
The error grid
Another approach that has been used is risk evaluation. It can conveniently be explained in terms of an “error grid” based on the comparison between two methods. Probably the most well-known are the Clark [Citation20] and the Parkes or Consensus [Citation21] error grids for describing the performance of blood glucose instruments. In principle the methods under study are supposed to give the same numeric and diagnostic result. A zone can be defined around the equal line where results would be accepted and other zones where results must not appear because a an unacceptable risk for the patient. The error grid has recently been described in detail by CLSI, EP 27 [Citation6]. Essentially it applies an uncertainty to the results and allows a limited number of what might otherwise be assumed as outliers.
Summary
The concept of uncertainty requires that the measurement is compensated for any known and significant bias. Instead the uncertainty of the measurement will increase. This will not change the reference intervals but widen them. Harmonization of measurement results can be achieved by recalibration using patient samples either using a regression function or recalibration with patient samples.
Declaration of interest: The authors report no conflicts of interest. The authors alone are responsible for the content and writing of the paper.
References
- Kaplan LA. determination and application of desirable analytical performance goals: The ISO/TC 212 approach. Scand J Clin Lab Invest 1999;59:479–82
- Kenny D, Fraser CG, Hyltoft Petersen P, Kallner A. Consensus agreement. Scand J Clin Lab Invest 1999;59: 585–6.
- Ricós C, Alvarez V, Cava F, Garcia-lario JV, Hernández A, Jimenez CV, Minchinela J, Perich C, Simón M. Current databases on biological variation: pros, cons and progress. Scand J Clin Lab Invest 1999;59:491–500.
- www.westgard.com. Visited 100503.
- International Vocabulary of Metrology – Basic and General Concepts and Associated Terms. VIM, 3rd, JCGM 200:2008. www.BIPM.org. Visited 100503.
- List of recommendations www.CLSI.org. Visited 100219.
- Belk WP, Sunderman FW. A survey of the accuracy of chemical analyses in clinical laboratories. Am J Clin Pathol 1947;17:853–61.
- Wootton IDP. International Biochemical Trial 1954. Clin Chem 1956;2:296–301.
- Tonks DB. A Study of the Accuracy and Precision of Clinical Chemistry Determinations in 170 Canadian Laboratories. Clin Chem. 1985;9:217–33.
- Klee G. Establishment of Outcome-Related Analytic Performance Goals. Clin Chem. 2010;56:714–22.
- Dale H. Measurement in Medicine: Brit Med Bull 1951;7:261.
- Wootton IDP and King EJ. Normal values for blood constituents. Inter-hospital differences. Lancet 1953;461: 470–1.
- Gräsbeck R. The evolution of the reference value concept. Clin Chem Lab Med 2004;42(7):692–7.
- In vitro diagnostic medical devices – Measurement of quantities in biological samples – Metrological traceability of values assigned to calibrators and control materials ISO 212/ ISO17511:2003.
- In vitro diagnostic medical devices – Measurement of quantities in biological samples – Metrological traceability of values for catalytic concentration of enzymes assigned calibrators and control materials. ISO 18153:2003.
- In vitro diagnostic medical devices – Measurement of quantities in samples of biological origin – Requirements for certified reference materials and the content of supporting documentation. ISO 15194:2009.
- Fraser CG. Biological variation: from principles to practise. AACC Press Washington DC. 2001.
- Fraser CG. The application of theoretical goals based on biological variation data in clinical chemistry. Arch Pathol Lab Med. 1998;112:404–15.
- Fraser GF, Petersen PH. Analytical performance characteristics should be judged against objective quality specifications. Clin Chem. 1999;45:3:321–3.
- Clarke WL, Cox D, Gonder-Frederick LA, . Evaluating clinical accuracy of systems for self-monitoring of blood glucose. Diabetes Care. 1987;10:622–8.
- Parkes JL, Slatin SL, Pardo S, Ginsberg BH. A new consensus error grid to evaluate the clinical significance of inaccuracies in the measurement of blood glucose. Diabetes Care. 2000; 23:1143–8.