Abstract
Ultrasound (US)-mediated gene transfection in the presence of microbubbles is a recently developed and promising non-viral gene delivery method. Optimising the parameters used in ultrasonic transfection is urgently required in order to realise higher transfection efficiencies in clinical settings. This study examined the effect of ultrasound exposure parameters on plasmid DNA transfection in mouse embryonic fibroblast cell lines using perfluorobutane bubbles. Variations in US intensity (0–11 W/cm2), pulse repetition frequency (PRF, 50–50,000 Hz), duty ratio (10 to 50%), exposure time (0–120 s) and microbubble volume concentration (0 to 10%) were tested, and the microbubble volume concentration was also monitored during exposure. Through the experiments, the mechanism of how variations in parameters influence US-mediated gene transfection was discussed, which can provide a basis for future applications of ultrasound mediated transfection.
Introduction
Gene therapy is a topic of intense interest due to the potential application of these methods to the treatment of a large number of inherited and acquired diseases Citation[1], Citation[2]. Because it deals with the causes rather than the symptoms of diseases, this radical therapy is considered to be capable of significantly influencing medical science, particularly in the treatment of difficult or rare diseases, such as cancer and cardiovascular diseases Citation[3–5]. Having gained an understanding of the genetic mechanisms underlying gene therapy, research has progressed to the process of manipulation, which typically involves the delivery of a therapeutic gene into a target cell or tissue. The low efficiencies obtained by simply injecting naked DNA directly into cells make it necessary to use vehicles or special vectors; indeed, the lack of safe and effective vectors has constituted one of the greatest limitations to the widespread application of gene therapy. To this end, a variety of both viral and non-viral methods have been developed Citation[5]. Of the various viral vectors that have been applied as gene vectors, the most extensively researched are retroviruses, adenoviruses and adeno-associated viruses. Each type of virus has its own unique advantages and limitations, most of which are reviewed elsewhere in the literature Citation[6–10]. Although viral vectors are typically more efficient than non-viral vectors, their application is often limited by factors such as immune recognition, mutagenic integration, inflammatory toxicity, and difficulties with production Citation[9], Citation[11].
Consequently, since non-viral methods offer relatively simpler quantitative production, low host immunogenicity, and flexibility with respect to the size of the targeted gene, such techniques are attracting more attention Citation[11], Citation[12]. Thus, despite having significantly reduced transfection efficiencies compared to virus-based transfection methods, non-viral delivery systems are still preferred, and a variety of methods have been developed. Non-viral delivery systems can generally be divided into two categories: physical methods such as gene bombardment, electroporation and US-related, and chemical methods such as lipid-based vectors, polymeric vectors and dendrimer-based vectors Citation[13–17]. Of these, the US-mediated method, which was developed relatively recently Citation[18], has several advantages over the other non-viral methods. Specifically, it is less invasive than the electroporation method since the ultrasound wave can propagate through soft tissue and reach the cells of internal organs Citation[19], Citation[20]. In addition, both spatial and temporal aspects of delivery can be controlled by adjusting the US parameters, transducers and acoustic waves, and in so doing, the desired area can be targeted and side effects can be reduced Citation[19].
Ultrasound-mediated gene delivery
US is a type of mechanical wave that has a frequency exceeding 20 kHz; it cannot be heard by human ears. The pressure amplitude of the longitudinal wave (also called compressional wave) is typically specified in Pascal, but kPa or MPa is more commonly seen in the medical field, and the intensity (W/cm2) is proportional to the square of the pressure amplitude. US is one of the most widely applied clinical diagnostic tools and most of the therapeutic effects of US have been developed during the long period it has been used. These effects have included techniques such as ablation of tissue or cancer (by high intensity focused ultrasound (HIFU)), sonophoresis, haemostasis, and vascular occlusion. Heating, streaming and cavitation are the primary mechanisms of action underlying these therapeutic effects, all of which arise from the propagation of US waves in cells and tissues Citation[21], Citation[22].
US-mediated gene delivery is considered to be closely related to acoustic cavitation. Cavitation and cavitation-induced activities can temporarily increase cell membrane permeability through a process referred to as sonoporation; briefly, transient holes are induced in the phospholipid bilayer of the cell membrane, which allows large DNA molecules to be transferred into the cell Citation[23]. While the mechanisms underlying sonoporation have yet to be clarified, like all of the non-viral gene transfer methods, efforts have focused on increasing the efficiency of delivery.
The first report of gene delivery into cultured cells using US was by Kim et al. Citation[24]. However, despite the importance of this discovery, one element was missing: microbubbles. Gas bodies added to the transfection medium can serve as cavitation nuclei, which lower the sonoporation threshold and intensify the collapsing process of bubbles, improving transfection efficiency Citation[25], Citation[26]. With the aid of microbubbles, which are served by US contrast agents (UCA) (originally used in a diagnostic setting), various types of cells were transfected both in vitro and in vivo Citation[27–37]. To increase delivery efficiency and decrease damage to cells or tissues even further, particularly in future clinical applications, the influences of the different delivery system parameters need to be investigated.
Microbubbles are now considered to be essential in gene transfection. However, changes in US intensity, the duration of exposure, and burst settings of the wave also influence delivery efficiency and cell viability. Although a number of parametric studies have examined the efficiency associated with various exposure systems Citation[31], Citation[35–37], control over the wave is sometimes limited when using commercial diagnostic systems. A thorough parametric study was conducted and each parameter was examined independently Citation[38]. The results showed that optimisation of the parameters is necessary, but the marker for sonoporation was dextran; similar work was undertaken for plasmid DNA transfection to investigate the influence of exposure parameters on transfection efficiency and cell viability, but the parametric space was not as large as the work using dextran Citation[39]. In addition, lack of adequate explanations for the parametric effects on sonoporation also hinders further improvements in delivery efficiency.
In our study, a US gene transfection system with fully adjustable US parameters was developed to investigate the effects of these parameters including bubble volume concentration, US intensity, irradiation time and burst settings on gene transfection efficiency and cell viability. The experiments were performed in vitro in multi-welled plates to ensure high reproducibility. Considering that bubbles are crucial in sonoporation, the volume concentrations of the contrast agents were also monitored for the same period of time as used in the transfection protocols. The trend in concentration changes can help us understand the process of irradiation and sonoporation, which can provide suggestions for optimising delivery. The aim of the study was to understand the influence of different US parameters and to optimise settings to increase delivery efficiency and minimise cell death.
Materials and methods
Cell line
Mouse embryonic fibroblast cells (NIH3T3), adherent, were incubated as monolayer at 37°C under a humidified atmosphere of 5% CO2 in 55 cm2 tissue culture dishes containing Dulbecco's modified Eagle's medium (DMEM) supplemented with 10% v/v foetal bovine serum (FBS) and 1% v/v antibiotics (penicillin-streptomycin and L-glutamine). All of the reagents were purchased from Invitrogen (Carlsbad, CA). The cells were detached using trypsin and transferred to a standard commercial 24-well plate and left to grow to 60–70% confluence before being irradiated.
A plasmid encoding green fluorescent protein (GFP) was obtained from a coliform bacterium with a concentration of 1.46 mg/mL (Hispeed Plasmid Maxi Kit, QIAGEN, Dusseldorf, Germany). In transfection experiments, the plasmid DNA concentration was maintained at 15 µg/mL.
US exposure apparatus
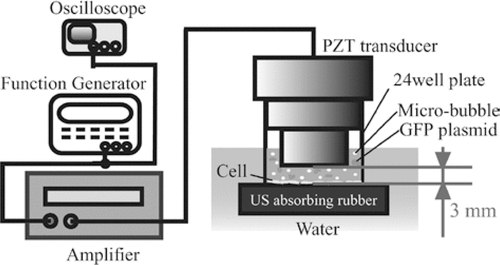
A schematic diagram of the US exposure apparatus is shown in . The system was comprised of an arbitrary waveform generator (model WF1944A, NF Corporation, Yokohama, Japan), a 50 dB gain radio frequency amplifier (2100L, E&I, Rochester, NY), an oscilloscope, and a custom-designed, single piezoceramic element plane transducer (13.5 mm diameter, Japan Probe, Yokohama) with a central frequency of 2 MHz. During the experiments, the transducer was inserted into the wells of a 24-well plate (BD Falcon, Bedford, MA), which was placed on sound-absorbing material in a 37°C water bath. All the manipulations were done within a clean bench.
Figure 1. US exposure system.
Burst wave
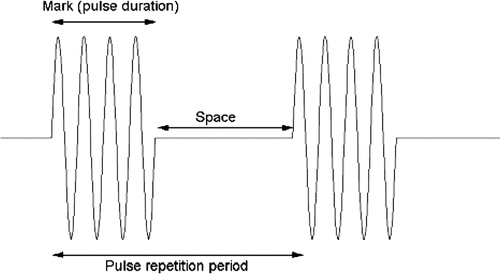
In all experiments, ‘burst’ mode of US was applied. Since a 2 MHz transducer is used, the period of a cycle is 0.5 µs. A burst signal is composed of a mark component and a space component (both components are quantified by the number of cycles), as shown in . The length of the mark component (also called pulse duration) divided by the total length of the pulse (pulse repetition period) is referred to as the duty ratio. In our study, a 40-cycle pulse duration (20 µs) was used for most transfections.
Figure 2. Burst wave characteristics.
US contrast agent
The US contrast agent used in all of the experiments was Sonazoid® (Daiichi Sankyo, Tokyo, Japan). Sonazoid is a kind of perfluorobutane microbubble (C4F10) with a resonance frequency of 2 MHz (according to the size distribution data supplied by the manufacture), which is the exact value that was referred to when designing the transducers. The bubble sample was prepared half an hour before irradiation experiments by injecting 2 mL pure distilled water into each bottle of powder and then shaking for 1 min. According to the manufacturer, the microbubble diameter ranges from 1 to 10 µm.
Flow cytometry and viability analysis
The transfection of GFP was measured by flow cytometry (BD LSRII, BD Bio-Sciences International, San Jose, CA). After irradiation, plates were incubated for 48 h and then rinsed with phosphate buffered saline (PBS). Cells were then detached using trypsin and then analysed in a cytometer (at least 10,000 cells were analysed for each well). The gene transfection rate was taken as the number of cells that exhibited green fluorescence divided by the number of live cells after 2 days of incubation.
Cell viability was measured using a cell counting kit (CCK8, Dojindo Laboratories, Kumamoto, Japan), a photometric cell proliferation assay using tetrazolium salt-WST-8 (2-(2-methoxy-4-nitrophenyl)-3-(4-nitrophenyl)-5-(2,4-disulfophenyl)-2H-tetrazolium, monosodium salt). 50 µL CCK8 solution and 500 µL culture medium were placed into each well and the plate was then incubated for 4 h before reading the absorbance of each well using a multi-well plate reader at 450 nm. Cell viability was then determined using the absorbance values of irradiated wells divided by the values of the control wells after subtracting the blank well values. Control wells were prepared in the same way as experimental wells except that they were not irradiated. Blank wells were prepared before the assay by placing 500 µL culture medium and 50 µL CCK8 solution in each well. Both test wells and control wells were rinsed with PBS before the viability assay to exclude the effect of dead cells floating in medium. Cell viability was measured in duplicate: once immediately after irradiation and then immediately before the cytometry assay.
Laser diode system
A laser diode system (670 nm, Beta-TX, Abertillery, UK) was used to measure the change in concentration of microbubbles during irradiation. The exposure system is the same as that shown in . The laser beam goes through the 3-mm interval between transducer surface and well bottom surface and is then received by a diode sensor connected to an oscilloscope controlled by MATLAB™ software (MathWorks, Natick, MA) in a PC. Calibration was carried out to determine the relationship of transmission and bubble concentration before recording data. A sinusoidal wave with 1 kHz frequency was used for modulation to avoid noises.
Results
Acoustic pressure
The pressure field of the transducer was measured with a needle hydrophone (model 80-0.5-40, Imotec Messtechnik, Warendorf, Germany) at a fixed distance of 3 mm from the transducer surface; the distance between the transducer and the well-bottom surface was also 3 mm. The pressure field (peak-to-peak value, maximum value, minimum value) was recorded at 0.5 mm increments along an axis running perpendicular to the direction of beam propagation. The data in was obtained when the function generator output was 100 mV (peak-to-peak value). Since the distribution is not very uniform, the intensity value was averaged over the circular transducer surface in all of the subsequent irradiation experiments.
Figure 3. Acoustic pressure field measured with needle hydrophone. (A) Hydrophone placed 3 mm away from the transducer. Max, maximum value of signal recorded, i.e. peak positive pressure; Min, minimum value (absolute value of min is also called the peak negative value). (B) Hydrophone placed 6 mm away from the transducer. +, 24-well plate positioned between the hydrophone and the transducer; –, no 24-well plate positioned between the hydrophone and the transducer.
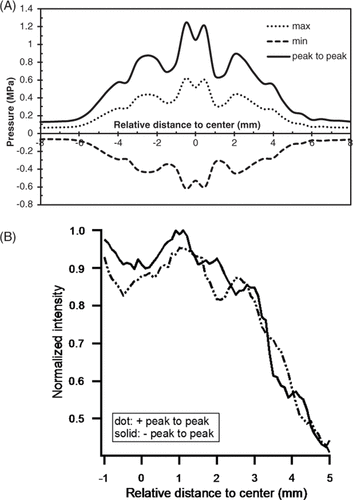
Furthermore, because the plastic bottoms of plates could absorb and reflect incident waves, causing attenuation and reflection, and possibly forming a standing wave, the acoustic field with 24-well plates that was 3 mm away from the transducer was also measured. The needle hydrophone was positioned 3 mm away from the plate bottom (6 mm away from the transducer surface) and the pressure field was recorded with and without the plate (). Since the difference in the sound fields of the two cases was negligible, neither attenuation nor reflection was considered.
Confirmation of transfection and effects of microbubble volume concentration
Before testing the influence of microbubble volume concentration on GFP transfection rates, the bubble density at different volume concentrations was measured. The microbubble solution was first observed under a high-magnification microscope (VH-Z450, Keyence, Osaka, Japan) and the density was calculated using standard image processing methods (). The microbubble diameter ranges from 1 to 10 µm (data from manufacture) and the average diameter is measured to be 2.6 µm.
Table I. Sonazoid® bubble density at different volume concentrations.
To confirm that cells were transfected with GFP, cells were observed by a fluorescent microscope (Keyence, Osaka, Japan). Both fluorescent images at the wavelength of GFP and bright field images were captured and then overlaid as shown in . Transfected cells expressed GFP and were thus visible in fluorescent mode while untransfected cells were only visible in bright field mode.
Figure 4. Confirmation of gene transfection rates at different bubble volume concentrations. US intensity 1.76 W/cm2, burst duty ratio 10%, pulse repetition frequency (PRF) 5 kHz, insonation time 60 s. (A) was obtained with 10% microbubble volume concentration on a fluorescent microscope. The data is averaged from three independent replicates (12 samples) and shown as the mean ± standard deviation.
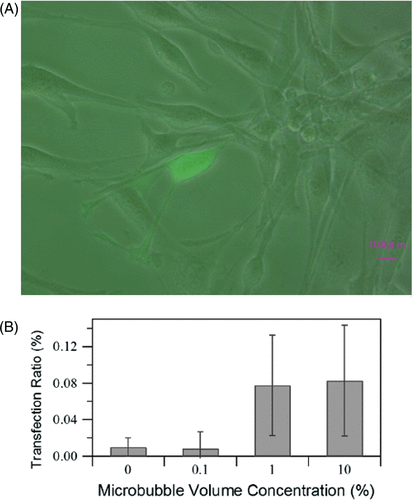
The gene transfection rates at different bubble concentrations are shown in . Transfection efficiency increases as the density of microbubbles increases, and the sharp increase in the transfection rate observed where the concentration of microbubbles is 0.1–1% indicates that a threshold exists. At higher microbubble concentrations (1–10%), the transfection rate appeared to plateau. We therefore kept the bubble concentration at 10% v/v for all subsequent tests in this study.
US intensity
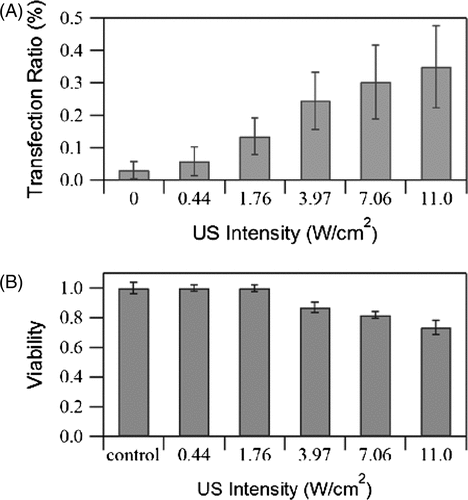
The effects of acoustic pressure on GFP transfection and cell viability are shown in . For cases without exposure (US intensity = 0), since no transfection has been reported in the literature in cases without exposure Citation[36], Citation[39], the ultra-low transfection rates (0.03%) reported here are believed to be due to measuring error. In cases where transfection was observed, the transfection rate increased with US intensity while cell viability decreased. The overall transfection rates were relatively low (maximum 0.35%), which is partly due to the fact that the cells were incubated for 48 h before the cytometry test (GFP transfection was temporal and the incubation period would have resulted in an increase in the total number of cells). However, even if the effect of proliferation is not considered, transfection efficiency was still relatively low, which, as mentioned previously, is one of the major disadvantages associated with non-viral transfection methods. Although the efficiency of delivery could be enhanced by increasing the US intensity, a concomitant increase in cell death would be likely. It would therefore be necessary to optimise the states of the other parameters in order to improve transfection efficiency.
Figure 5. Effects of US intensity on (A) GFP transfection rate and (B) cell viability measured immediately after exposure. Burst duty ratio 10%, pulse repetition frequency 5 kHz, insonation time 60 s, microbubble concentration 10%. The data is averaged from three independent replicates (12 samples) and shown as the mean ± standard deviation.
Pulse repetition frequency
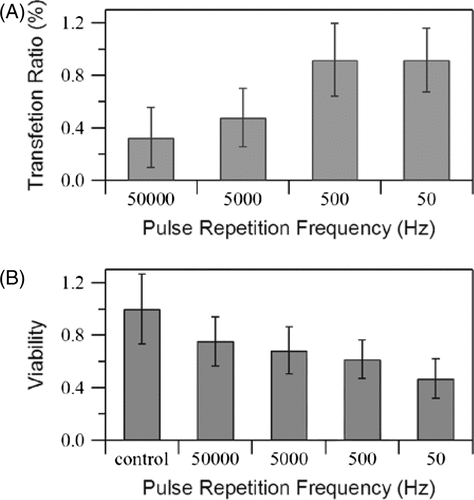
The pulse repetition frequency (PRF) is an important parameter of burst waveforms. In this study, the PRF was adjusted with a fixed duty ratio (i.e. the pulse duration was changed) and the effects are shown in . Since the transfection efficiency is clearly higher at a lower PRF (∼0.92% at both 50 and 500 Hz), cell viability decreases together with PRF. Further, the duty ratio is constant (10%), which means that the lower PRF translates to an increase in the number of cycles of US exposure, i.e. the cells are exposed more total energy. The observation that approximately the same efficiencies were obtained at 50 Hz and 500 Hz indicates that simply increasing the number of exposure cycles is not effective for increasing transfection efficiency.
Figure 6. Effects of PRF on (A) GFP transfection rate and (B) cell viability measured immediately after US exposure. US intensity 4.94 W/cm2, burst duty ratio 10%, insonation time 60 s, microbubble concentration 10%. The data is averaged from three independent replicates (12 samples) and shown as the mean ± standard deviation.
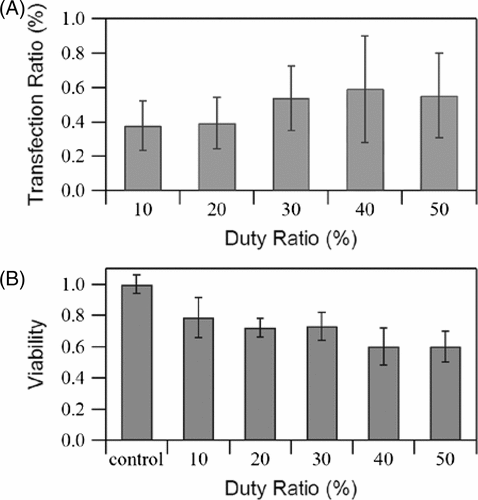
Duty ratio
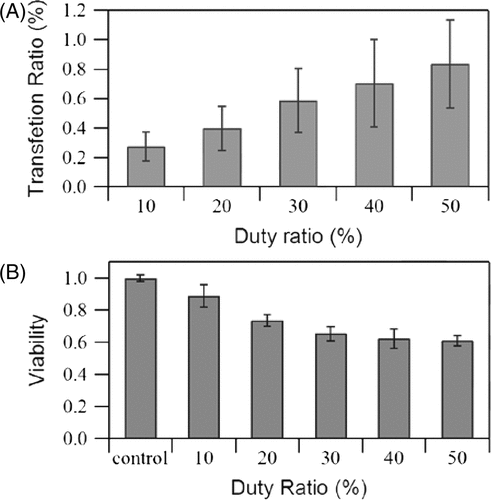
If PRF remains constant, then the duty ratio represents the length of the pulse duration, and the effect of this duration on transfection rate and cell viability is shown in . The transfection rate increases as the duty ratio increases. Thus, the transfection rate reaches maximum level (0.83%) when the duty ratio is 50%, while cell viability decreases with an increase in the duty ratio. Increasing the duty ratio from 20 to 30% (for a pulse duration of 40 to 60 µs) or from 40 to 50% (for a pulse duration of 80 to 100 µs) increases the transfection efficiency by about 50% and 20%, respectively, indicating that the rate tends to plateau. A high duty ratio also implies that more energy is exerted on cells; similar trends to PRF prove that simply increasing the energy of the sound wave is only effective in a short range.
Figure 7. Effects of duty ratio on (A) GFP transfection rate and (B) cell viability measured immediately after exposure. US intensity 4.94 W/cm2, pulse repetition frequency 5 kHz, insonation time 60 s, microbubble concentration 10%. The data is averaged from three independent replicates (12 samples) and shown as the mean ± standard deviation.
Irradiation time
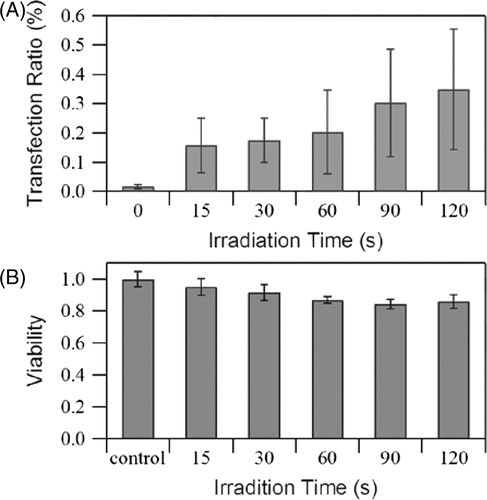
The effects of irradiation time (0 to 120 s) on the transfection rate and cell viability are shown in . It can be seen that efficiency increases as exposure time increases while viability decreases slightly. An increase in transfection efficiency was observed when irradiation was 60–90 s (50% increase) relative to that when irradiation was 90–120 s (16% increase), implying that prolonging exposure time does not enhance delivery of DNA. The US intensity used in the exposure tests was low because cell death increases with intensity. In addition, the transducer itself cannot withstand high temperatures for extended periods of time.
Figure 8. Effects of irradiation time on (A) GFP transfection rate, and (B) cell viability measured immediately after exposure. US intensity 1.76 W/cm2, burst duty ratio 10%, pulse repetition frequency 5 kHz, microbubble concentration 10%. The data is averaged from three independent replicates (12 samples) and shown as the mean ± standard deviation.
Fixed energy
Although the effects of duty ratio and exposure time were investigated independently, these two parameters were combined here to examine the effect of fixed energy (total cycles of US exposure are identical) on GFP transfection rate, and the results are shown in . PRF was constant (5 kHz) and five different combinations of duty ratio and irradiation time were tested (duty ratio ranged from 10–50%, irradiation time ranged from 12–60 s). At a fixed energy, the transfection rate increased with the duty ratio before plateauing from 30% onward as cell viability continued to decrease. These findings indicate that it is better to use relatively low duty ratio burst waves for the same energy exerted on cells.
Figure 9. Effects of duty ratio with fixed energy on (A) GFP transfection rate and (B) cell viability measured immediately after exposure. US intensity 4.94 W/cm2, pulse repetition frequency 5 kHz, microbubble concentration 10%. Corresponding duty ratios and insonation times are 10% 60 s, 20% 30 s, 30% 20 s, 40% 15 s, 50% 12 s. The data is averaged from three independent replicates (12 samples) and shown as the mean ± standard deviation.
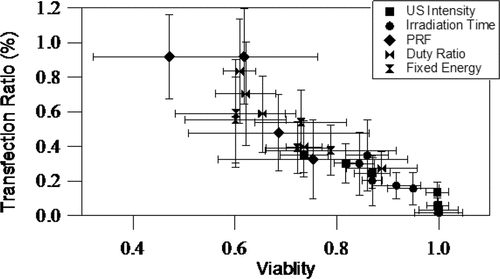
Parametric space
shows a summary of all of the experiments performed in this study. The data from the five data series discussed above (US intensity, irradiation time, PRF, duty ratio and duty ratio with fixed energy) are presented as a scatter plot. The overall trend for the data is that increases in transfection efficiency are associated with decreased cell viability. Transfection rates ranged from 0.0–0.918% and cell viability ranged from 100–47. Taken together, the findings showed that maximum transfection rates were obtained with the following settings: US intensity 4.94 W/cm2, burst duty ratio 10%, PRF 500 Hz, insonation time 60 s, microbubble concentration 10%.
Figure 10. Parametric space containing the results of all treatments. Central frequency 2 MHz, microbubble concentration 10%. The data is averaged from three independent replicates (12 samples) and shown as the mean ± standard deviation.
Microbubble concentration change
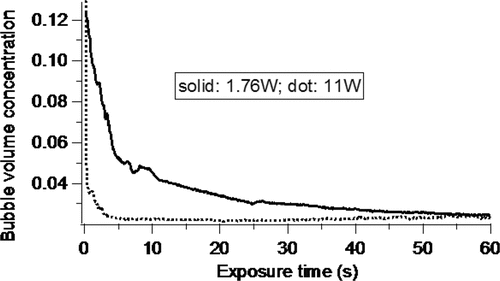
After calibration, the signal value received by the diode sensor was converted to microbubble volume concentration in the well. The concentration change in 60 s was monitored at two intensities, 1.76 W/cm2 and 11.0 W/cm2, and shown in . The volume concentration of bubbles decreased very rapidly soon after exposure began at both intensities. Within 5 s after exposure began, the concentration had decreased to 42.5% and 17.7% of its initial value for 1.76 W and 11 W respectively. Bubble concentration decreased due to collapse during the cavitation process, thus with higher intensities the cavitation will also be stronger.
Figure 11. Change in volume concentration of microbubbles during 60 s exposure at two intensities. Central frequency 2 MHz, initial microbubble concentration 10%. US intensity, 1.76 W/cm2 and 11 W/cm2 (dotted line for 11 W/cm2 and solid line for 1.76 W/cm2), pulse repetition frequency 5 kHz, insonation time, 60 s.
Discussion
Low transfection efficiency
Irrespective of which US exposure regime is employed or what types of cells are used, a major problem associated with US-mediated transfection methods is the issue of low transfection efficiency Citation[40]. In our case, transfection rates were in the order of 10-3 (maximum value, 0.918%), which could mainly be due to two issues. One is that the piezo-ceramic element area is only ∼1.2 cm2 and is thus unable to cover all the cells in a well that has an area of ∼1.9 cm2 (∼63% covered). The other issue is that while cells are usually only incubated for 1 day before analysis by flow cytometry, in our experiment 1 day more of incubation was needed to allow cells in each well to proliferate to an amount meaningful for flow cytometry analysis because of the commercial multi-well plate we used. Because transfection is temporal, the doubling of the amount of cells will obviously also lower the transfection rate.
Effects of exposure parameters
Although the overall transfection efficiency obtained is not very high, the trends in transfection rates and cell viability are still quite clear with changes in parameters in our study. At present, the detailed mechanisms underlying sonoporation are unclear and the complicated kinetics associated with plasmid internalisation and gene expression Citation[30] have contributed to making the transfection process more difficult to control. Although resolving these problems will require considerable effort and time, the application of parametric tests could be used to elucidate manipulation strategies that would have more efficient outcomes. We investigated how manipulating several of the parameters of an exposure system could influence both transfection efficiency and cell viability.
The use of microbubbles in US-mediated gene delivery is an essential technique and different bubbles have been shown to be effective Citation[32]. In this study, the commercial contrast agent that we used was also critical to the transfection process. The transfection efficiency of plasmid DNA was shown to be proportional to plasmid concentration in a small range, before becoming constant Citation[41]. A similar test was also performed in our study (data not shown) and a constant concentration (15 µg/mL) was selected for use in all of the experiments in this study.
Exposures with continuous US waves have been tested previously and have been shown to be effective for transfecting genes, albeit at relatively low efficiencies Citation[42]. We used a burst wave-type exposure pattern in this study. The effect of the energy produced and the effect of cell exposure to US in burst waves was examined over a relatively large range in order to assess its effect on transfection Citation[43]. We examined the individual components of the burst parameters and then combined them in a constant energy study (a constant energy can be realised using a burst wave system through careful combination of burst parameters such as pulse repetition frequency and duty ratio). In addition, we tested the influence of the mark component (pulse duration) and the space component with fixed energy (data not shown). Taken together, our findings showed that high transfection efficiencies are associated with low cell viability and that high energy does not necessarily mean high transfection rate but will induce low cell viability.
Mechanism of parametric influence
Parametric effects show that optimisation is needed since maximum transfection rate and cell viability cannot be obtained together. A further understanding of the mechanisms is needed in order to give any detailed instructions on parameter optimisation.
No transfection was found without bubbles (), and bubbles collapsing in a very short time () proved that the transfection process is strongly related to cavitation and cavitation-induced activities. High US intensity, i.e. high acoustic pressure, will intensify the radial movement (expansion and compression) of bubbles and result in violent collapse and thus enhanced sonoporation. also shows that high intensity US resulted in quicker as well as stronger collapse of bubbles. It can be expected then that more cells will be transfected and that more cells will die (the membrane is disrupted). In addition, intense cavitation can cause quick heat deposition, which will also cause cell death. The effect of irradiation time on transfection rate can be also explained similarly since long irradiation prolongs both cavitation and sonoporation process. The influence of burst parameters on transfection is relatively more complicated. Bubble activities, convective flow and self-repair of cells Citation[44] can be all involved. Propagation of US can cause convection in wells (bulk movement) and push bubbles to near wall area. But the space component in a burst gives bubbles time to restore to a relatively even distribution in the medium and can thus enhance cavitation near cells since cells attached to the bottom appear centralised in distribution. Low PRF means long irradiation time but also long space component which added together will induce intense cavitation, so high transfection efficiency and low cell viability are anticipated. Low PRF also means the bubble collapse process lasts for a relatively longer time.
On the other side, small duty ratio signifies short irradiation time and eventually low transfection rate and high cell viability. Small duty ratio also implies long space component, which facilitates cells’ self-repair of pores after sonoporation and improves cell viability.
For parameter optimisation, collapse of bubbles should be controlled so that it occurs in a relatively mild way and over a relatively long time. Furthermore, keeping bubbles uniformly distributed around cells is also needed.
Limitations of the study
The present parametric study is limited by a variety of factors. Firstly, the transducer was inserted into the wells of the plate and was thus on top of cells; however, the microbubbles would also rise upwards to the top of the medium due to buoyancy. In addition, the number of bubbles surrounding each cell could not be determined. Supplementation of bubbles should also be considered for future settings. Secondly, cell viability was measured after the cells were washed once with PBS. Dead cells resulting from irradiation may have become detached from the well bottom, floating in the medium before being washed away and not considered in the viability analysis. Finally, although sonoporation occurs at the level of individual cells Citation[45], US intensity was averaged spatially in this study. Since the acoustic field of the transducer was not uniform, not even in a single well, the intensity of exposure experienced by cells would not have been identical.
Conclusions
In this study, US in the presence of microbubbles was used to transfect NIH3T3 cells with GFP plasmid in vitro. Four US wave-related parameters – intensity, irradiation time, pulse repetition frequency and duty ratio – were tested independently together with microbubble concentration to investigate their effects on gene transfection rate and cell viability. The findings revealed that an increase in the transfection rate is associated with a concomitant decrease in cell viability decrease. Transfection rate increases as the US intensity and irradiation time increases. For pulse repetition frequency and duty ratio, a plateau in the transfection efficiency was observed, requiring optimisation of burst-related factors. Bubbles collapsed very quickly after exposure, and high intensity resulted in even quicker collapse. The highest transfection rate obtained was 0.918% (US intensity 4.94 W/cm2, burst duty ratio 10%, PRF 500 Hz, insonation time 60 s, microbubble concentration 10%), which corresponded with a cell viability of 61.7%. Although this level of transfection efficiency was not high when compared to levels obtained using other transfection methods, the methods employed here do nonetheless illustrate the effects that the tested parameters have on transfection efficiencies. In addition, the findings also provide a practical basis for optimising these parameters to achieve high transfection efficiency together with high cell viability.
Declaration of interest: This work was partially supported by the Translational Systems Biology and Medicine Initiative (TSBMI), from the Ministry of Education, Culture, Sports, Science and Technology of Japan. The authors alone are responsible for the content and writing of the paper.
References
- Friedmann T, Roblin R. Gene therapy for human genetic disease?. Science 1972; 175: 949–955
- Friedmann T. Progress toward human gene therapy. Science 1989; 244: 1275–1281
- Mountain A. Gene therapy: The first decade. Tibtech 2000; 18: 119–128
- Verma IM, Weitzman MD. Gene therapy: Twenty-first century medicine. Annu Rev Biochem 2005; 74: 711–738
- Gardlík R, Pálffy R, Hodosy J, Lukács J, Turňa J, Celec P. Vectors and delivery systems in gene therapy. Med Sci Monit 2005; 11: 110–121
- Robbins PD, Ghivizzani SC. Viral vector for gene therapy. Pharmacol Ther 1998; 80: 35–47
- Stone D, David A, Bolognani F, Lowenstein PR, Castro MG. Viral vectors for gene delivery and gene therapy within the endocrine system. J Endocrinol 2000; 164: 103–118
- Kootstra NA, Verma IM. Gene therapy with viral vectors. Annu Rev Pharmacol Toxicol 2003; 43: 413–439
- Thomas CE, Ehrhardt A, Kay MA. Progress and problems with the use of viral vectors for gene therapy. Nature Rev Genet 2003; 4: 346–358
- Davidson BL, Breakefield XO. Viral vectors for gene delivery to the nervous system. Nature Rev Neurosci 2003; 4: 353–364
- Gao X, Kim KS, Liu D. Nonviral gene delivery: What we know and what is next. AAPS Journal 2007; 9: E93–E104
- Davis ME. Non-viral gene delivery systems. Curr Opin Biotech 2002; 13: 128–131
- Wiethoff CM, Middaugh CR. Barriers to nonviral gene delivery. J Pharm Sci 2003; 92: 203–217
- Wells DJ. Gene therapy progress and prospects: Electroporation and other physical methods. Gene Ther 2004; 11: 1363–1369
- Mintzer MA, Simanek EE. Nonviral vectors for gene delivery. Chem Rev 2009; 109: 259–302
- Seow Y, Wood MJ. Biological gene delivery vehicles: Beyond viral vectors. Mol Ther 2009; 17: 767–777
- Wells DJ. Electroporation and ultrasound enhanced non-viral gene delivery in vitro and in vivo. Cell Biol Toxicol 2010; 26: 21–28
- Newman CM, Lawrie A, Brisken AF, Cumberland DC. Ultrasound gene therapy: On the road from concept to reality. Echocardiography 2001; 18: 339–347
- Miller DL, Pislaru SV, Greenleaf JF. Sonoporation: Mechanical DNA delivery by ultrasonic cavitation. Som Cell and Mol Genet 2002; 27: 115–134
- Pitt WG, Husseini GA, Staples BJ. Ultrasonic drug delivery – A general review. Expert Opin Drug Deliv 2004; 1: 37–56
- ter Haar GR, Coussios CC. High intensity focused ultrasound: Past, present and future. Int J Hyperther 2007; 23: 85–87
- ter Haar GR, Coussios CC. High intensity focused ultrasound: Physical principles and devices. Int J Hyperther 2007; 23: 89–104
- Coussios CC, Farny CH, ter Haar GR, Roy RA. Role of acoustic cavitation in the delivery and monitoring of cancer treatment by high-intensity focused ultrasound. Int J Hyperther 2007; 23: 105–120
- Kim HJ, Greenleaf JF, Kinnick RR, Bronk JT, Bolander ME. Ultrasound-mediated transfection of mammalian cells. Hum Gene Ther 1996; 7: 1339–1346
- Stride E, Saffari N. Microbubble ultrasound contrast agents: A review. Proc Inst Mech Eng H J 2003; 217: 429–447
- Ferrara K, Pollard R, Borden M. Ultrasound microbubble contrast agents: Fundamentals and application to gene and drug delivery. Annu Rev Biomed Eng 2007; 9: 415–447
- Lawrie A, Brisken AF, Francis SE, Cumberland DC, Crossman DC, Newman CM. Microbubble-enhanced ultrasound for vascular gene delivery. Gene Ther 2000; 7: 2023–2027
- Toniyama Y, Tachibana K, Hiraoka K, Namba T, Yamasaka K, Hashiya N, et al. Local delivery of plasmid DNA into rat carotid artery using ultrasound. Circulation 2002; 105: 1233–1239
- Christiansen JP, French BA, Klibanov AL, Kaul S, Lindner JR. Targeted tissue transfection with ultrasound destruction of plasmid-bearing cationic microbubbles. Ultrasound Med Biol 2003; 29: 1759–1767
- Mehier-Humbert S, Bettinger T, Yan F, Guy RH. Ultrasound-mediated gene delivery: Kinetics of plasmid internalization and gene expression. J Control Release 2005; 104: 203–211
- Feril LB, Ogawa R, Tachibana K, Kondo T. Optimized ultrasound-mediated gene transfection in cancer cells. Cancer Sci 2006; 97: 1111–1114
- Mehier-Humbert S, Yan F, Frinking P, Schneider M, Guy RH, Bettinger T. Ultrasound-mediated gene delivery: Influence of contrast agents on transfection. Bioconjugate Chem 2007; 18: 652–662
- O’Neill BE, Li KCP. Augmentation of targeted delivery with pulsed high intensity focused ultrasound. Int J Hyperther 2008; 24: 506–520
- Kobulnik J, Kuliszewski MA, Stewart DJ, Lindner JR, Leong-Poi H. Comparison of gene delivery techniques for therapeutic angiogenesis: Ultrasound-mediated destruction of carrier microbubbles versus direct intramuscular injection. J Am Coll Cardiol 2009; 54: 1735–1742
- Phillips LC, Klibanov AL, Wamhoff BR, Hossack JA. Targeted gene transfection from microbubbles into vascular smooth muscle cells using focused, ultrasound-mediated delivery. Ultrasound Med Biol 2010; 36: 1470–1480
- Reslan L, Mestas JL, Herveau S, Béra JC, Dumontet C. Transfection of cells in suspension by ultrasound cavitation. J Control Release 2010; 142: 251–258
- Delalande A, Bouakaz A, Renault G, Tabareaue F, Kotopoulis S, Midoux P, et al. Ultrasound and microbubble-assisted gene delivery in Achilles tendons: Long lasting gene expression and restoration of fibromodulin KO phenotype. J Control Release 2011; 156: 223–230
- Karshafian R, Bevan PD, Willams R, Samac S, Burns PN. Sonoporation by ultrasound-activated microbubble contrast agents: Effect of acoustic exposure parameters on cell membrane permeability and cell viability. Ultrasound Med Bio 2009; 35: 847–860
- Rahim A, Taylor SL, Bush NL, ter Haar GR, Bamber JC, Porter CD. Physical parameters affecting ultrasound/microbubble mediated gene delivery efficiency in vitro. Ultrasound Med Biol 2006; 32: 1269–1279
- Newman CM, Bettinger T. Gene therapy progress and prospects: Ultrasound for gene transfer. Gene Ther 2007; 14: 465–475
- Liang HD, Lu QL, Xue SA, Halliwell M, Kodama T, Cosgrove DO, et al. Optimisation of ultrasound-mediated gene transfer (sonoporation) in skeletal muscle cells. Ultrasound Med Biol 2004; 30: 1523–1529
- Chen SY, Shohet RV, Bekeredjian R, Frenkel P, Grayburn PA. Optimization of ultrasound parameters for cardiac gene delivery of adenoviral or plasmid deoxyribonucleic acid by ultrasound-targeted microbubble destruction. J Am Coll Cardiol 2003; 42: 301–308
- Zarnitsyn VG, Prausnitz MR. Physical parameters influencing optimization of ultrasound-mediated DNA transfection. Ultrasound Med Biol 2004; 30: 527–538
- Wu JR, Ross JP, Chiu JF. Reparable sonoporation generated by microstreaming. J Acoust Soc Am 2002; 111: 1460–1464
- Zhou Y, Cui JM, Deng CX. Dynamics of sonoporation correlated with acoustic cavitation activities. Biophys J 2008; 94: L51–L53