Abstract
Purpose: During hyperthermia (HT), the therapeutic response of tumours varies substantially within the target temperature range (39–43 °C). Current thermometry methods are either invasive or measure only temperature change, which limits the ability to study tissue responses to HT. This study combines manganese-containing low temperature sensitive liposomes (Mn-LTSL) with proton resonance frequency shift (PRFS) thermometry to measure absolute temperature in tumours with high spatial and temporal resolution using MRI.
Methods: Liposomes were loaded with 300 mM MnSO4. The phase transition temperature (Tm) of Mn-LTSL samples was measured by differential scanning calorimetry (DSC). The release of manganese from Mn-LTSL in saline was characterised with inductively coupled plasma atomic emission spectroscopy. A 2T GE small animal scanner was used to acquire dynamic T1-weighted images and temperature change images of Mn-LTSL in saline phantoms and fibrosarcoma-bearing Fisher-344 rats receiving hyperthermia after Mn-LTSL injection.
Results: The Tm of Mn-LTSL in rat blood was 42.9 ± 0.2 °C (DSC). For Mn-LTSL samples (0.06 mM–0.5 mM Mn2+ in saline) heated monotonically from 30 °C to 50 °C, a peak in the rate of MRI signal enhancement occurred at 43.1° ± 0.3 °C. The same peak in signal enhancement rate was observed during heating of fibrosarcoma tumours (N = 3) after injection of Mn-LTSL, and the peak was used to convert temperature change images into absolute temperature. Accuracies of calibrated temperature measurements were in the range 0.9–1.8 °C.
Conclusion: The release of Mn2+ from Mn-LTSL affects the rate of MR signal enhancement which enables conversion of MRI-based temperature change images to absolute temperature.
Introduction
Mild hyperthermia (MHT) is an adjuvant cancer therapy where human tumour tissue is heated to 39–43 °C for up to 1 h. The therapeutic effects of MHT are due to a combination of related factors, including direct thermal cytotoxicity, increased tumour perfusion, decreased oxygen consumption, and increased tumour oxygenation [Citation1]. Each of these factors [Citation2–6], as well as clinical response to MHT [Citation7–10], is strongly dependent on thermal dose. Thus, in both research and clinical settings, it is necessary to directly measure the tumour temperature distribution during MHT. The ideal thermometry method would be non-invasive, have sufficient temporal and spatial resolution to adequately sample the treatment field, and would measure absolute temperature. Currently, no single thermometry method possesses all of these characteristics.
Several techniques have been proposed that enable non-invasive measurement of tissue temperature during MHT. For example, the electron paramagnetic resonance line width of nitroxide/elastin-like polypeptide conjugates has been shown to be temperature dependent [Citation11]. Additionally, several magnetic resonance imaging (MRI) parameters are temperature dependent, including water diffusion [Citation12,Citation13], chemical exchange [Citation14], the spin-lattice relaxation rate of water [Citation15], the evolution frequency of fat-water intermolecular zero quantum coherences [Citation16], the chemical shift of protons covalently bound to TmDOTA− [Citation17], and the proton resonance frequency shift (PRFS) of water protons [Citation18–22]. The PRFS method is the most widely used thermometry method clinically because it has high temporal resolution (as low as 1 image per s [Citation23]), high spatial resolution (0.5 mm in plane), does not require an exogenous contrast agent, is insensitive to coagulation and tissue type in non-fatty tissues [Citation24], and can be integrated with MR-compatible non-invasive heating devices [Citation20,Citation25–29]. One major limitation of the PRFS method is that it measures only temperature change rather than absolute temperature, and this report outlines a method to overcome this limitation.
The current study proposes a method to generate dynamic and high resolution MR images of absolute temperature during hyperthermia. Images of absolute temperature are generated by combining two separate thermometry methods. The first method is the established PRFS method, which provides a time series of temperature change images [Citation21]. The second thermometry method uses manganese-containing low temperature sensitive liposomes (Mn-LTSL) to perform a single measurement of absolute temperature. This report shows that these two methods can be combined to create a time series of absolute temperature. The absolute temperature measurement is possible because when Mn-LTSL are heated to the well-defined liposome bilayer phase transition temperature (Tm), the Mn-LTSL release Mn2+ from their core. Because released Mn2+ has a two to three times greater longitudinal relaxivity than encapsulated Mn2+, release can be imaged with MRI [Citation30–32]. Thus we used MRI to evaluate whether Mn2+ release could provide a localised one-time measurement of absolute tissue temperature during heating. While it has already been suggested that LTSL can serve as temperature probes [Citation33–35], this study introduces a method to convert a time series of temperature change images to absolute temperature using Mn-LTSL as absolute temperature detectors.
Materials and methods
Overview of experiments
Analytical experiments were conducted prior to imaging in order to characterise the material properties of Mn-LTSL. In particular, it was necessary to measure the Tm of Mn-LTSL using differential scanning calorimetry (DSC) because the numerical value of Tm was required for converting the temperature change images into absolute temperature images. Next, the release of Mn2+ from Mn-LTSL was measured as a function of time using inductively coupled plasma atomic emission spectroscopy (ICP-AES) in saline at 37 °C and at Tm. These time-dependent measurements of Mn2+ release were used to demonstrate that Mn2+ was being released most rapidly when the Mn-LTSL were heated to Tm.
Phantom imaging experiments were conducted to determine whether PRFS measurements were still accurate in image regions where Mn2+ was being released from the Mn-LTSL. It was also necessary to show that the MRI signal of Mn-LTSL samples increased when the samples (0.06 mM–0.5 mM) were heated to Tm. A signal increase at Tm is important because it provides a spatially and temporally localised absolute temperature measurement.
In vivo MRI experiments were conducted to show that, analogous to the in vitro experiments, tissue regions heated to Tm enhance the T1-weighted MRI signal, thus providing a temporally and spatially specific measurement of absolute temperature in the tumour.
Liposome formulation
Phospholipids at molar ratio (85.0:9.8:5.2; DPPC:MSPC:DSPE-PEG2000) were dissolved in chloroform/methanol. After the solvent was evaporated, the resulting thin film was dried overnight under a vacuum. The lipid film was hydrated by 3 mL of 300 mM MnSO4 solution to form vesicles with a lipid concentration of 100 mg/mL. The solution was incubated above the phase transition temperature (Tm) in a water bath at 55 °C. Incubation lasted for 30 min and the solution was shaken every 10 min. Next, the solution was passed through a polycarbonate filter with 100-nm pore size using a Lipex extruder (Northern Lipids, Burnaby, BC, Canada). Unencapsulated Mn2+ was removed by a Sephadex G50 column. The average size of the liposomes was determined to be 116 ± 2 nm (standard error of mean of three measurements) by a particle size analyser (Brookhaven Instruments, Holtsville, NY, USA). In this report, Mn-LTSL concentrations are given as the overall concentration of Mn2+ in the solution.
Phase transition temperature measurement
Differential scanning calorimetry (PerkinElmer Diamond DSC, Waltham, MA, USA) was performed to determine the phase transition temperature (Tm) of MnSO4 LTSL. Liposomes of concentration 50 mg/mL were prepared using a microsyringe, and 10 μL of the solution of Mn-LTSL was dried down overnight in an aluminium DSC pan under a regular vacuum. Prior to sample measurements, the DSC instrument was warmed up for approximately 1 h. Next, 10 μL of the appropriate solution (deionised (DI) water, saline (0.9% NaCl), rat plasma or whole rat blood) were added to the sample. Rat blood was obtained from Fischer-344 rats that weighed 300–350 g depending on the experiment. An aluminium lid was then placed on the pan and hermetically sealed. A reference pan containing 10 µL of the same added solution was also prepared in the same manner. The pans were placed into the instrument while applying an external nitrogen purge. The DSC instrument was then programmed to heat the sample to achieve a 0.5 °C/min rate of temperature increase starting at 30 °C and ending at 50 °C. The phase transition temperature was taken as the temperature corresponding to peak heat flow.
Mn2+ release assay
Measurements of Mn2+ release from the liposomes were performed in DI water and in saline. A total of 20 Sephadex G-50 spin columns (GE Healthcare Biosciences, Pittsburgh, PA) were pre-equilibrated with 0.9% NaCl. The Sephadex columns were used to separate released Mn2+ from Mn2+ still inside the liposomes. For collection of samples, 20 borosilicate test tubes (12 × 75 mm) were also pre-cooled on ice. An aliquot of 200 µL of 50 mg/mL Mn-LTSL was added to 12.0 mL of 0.9% saline that was preheated to 37 °C or 42.9 °C and mixed. The solution was continuously stirred and the temperature was monitored and maintained at 37 °C or 42.9 °C throughout the release experiment. Samples of 600 µL were extracted at 0:00, 0:20, 0:40, 1:00, 1:20, 1:40, 2:00, 2:20, 2:40, 3:00, 3:30, 4:00, 5:00, 10:00, 15:00, 20:00, 30:00, 40:00, 50:00, and 60:00 min. Each sample was quickly placed in a pre-cooled test tube which contained 500 µL of 0.9% saline for 30 s and then removed to room temperature for 10 min. The samples were then added to the top of the Sephadex columns and centrifuged at 2,000 rpm for 10 min at 25 °C to remove any free Mn2+ that was released from LTSL using size exclusion chromatography [Citation36]. The eluent was placed in a clean 1.5 mL centrifuge tube and was stored at 4 °C for ICP-AES analysis of Mn2+ and phospholipids.
Measurement of Mn2+ and phospholipids concentration using ICP-AES
ICP-AES was used to measure the concentration of Mn2+ and phosphorous (P) in order to determine the amounts of MnSO4 and phospholipid in each liposome sample generated in the Mn2+ release assay. Measurements were made with an Optima 4300DV ICP-AES (PerkinElmer Instruments) interfaced with WinLab32 (PerkinElmer Instruments). The correlation coefficients of manganese and phosphorus calibration curves were 0.9962 and 0.9997, respectively. The percentage release for various time points was calculated according to:
MRI protocol
All images (phantoms and in vivo animal model) were acquired with a 2-Tesla scanner (Signa, GE Medical Systems, Milwaukee, WI, USA). A spoiled gradient recalled acquisition at steady state (sGRASS) pulse sequence with a repetition time of 34 ms, an echo time of 15 ms, and a flip angle of 33° was used to acquire both magnitude (T1 weighted) and phase (temperature) data. Bandwidth =15.63 kHz, number of averages = 1 for in vivo, and NEX = 4 for phantom experiments. Voxel size was 0.2 mm by 0.2 mm by 1.5 mm, and matrix size was set to 256 by 256. Eight slices were acquired per animal and three slices were acquired per phantom. Imaging was conducted for 40 min, with a set of eight slices acquired every 80 s for animals and every 50 s for phantoms.
Set-up of phantom imaging experiments
For in vitro Mn-LTSL imaging experiments, suspensions of Mn-LTSL were prepared at concentrations of 0 mM, 0.016 mM, 0.03 mM, 0.06 mM, 0.13 mM, 0.25 mM, 0.5 mM, 1.0 mM, 2.0 mM, and 4.0 mM in 0.9% saline, and placed into nuclear magnetic resonance (NMR) sample tubes (5 mm outer diameter, Kontes Glass, Vineland, NJ, USA.) Also, free MnCl2 was prepared at 0.5 mM, 1.0 mM, 2.0 mM, and 4.0 mM. The vials were formed into a square array so that they were separated in MRI images. At least six silicone oil references were placed around the periphery of each array of vials to enable a correction for the effects of magnetic field drift (correction described below). After the array of vials was placed in the MRI, ambient air was blown into the magnet bore for at least 30 min to allow the samples to thermally equilibrate to the temperature of the air being blown on the phantom. The temperature of the moving air at the centre of the phantom was monitored with a digital temperature probe (YTI, Dayton, OH, USA). After 30 min of thermal equilibration, the temperature of the ambient air being blown on the samples was used as a baseline temperature measurement for PRFS temperature change maps. Next, at least eight sequential MRI phase maps were acquired to provide baseline phase measurements at room temperature. Finally, the air temperature was switched to 64° ± 1 °C and imaging continued for 30 min; the Mn-LTSL samples were heated during this period to a maximum of 50–55 °C. The raw phase data were then converted to temperature change as described in the drift correction and converting raw MRI phase data into temperature change images sections below. The average pre-heating air temperature (measured at the centre of the array) was used as an absolute baseline temperature reference for the PRFS temperature change images of the Mn-LTSL phantoms. This provided a measurement of the Mn-LTSL solution absolute temperature over the course of the experiment. The signal enhancement rate (SER) is defined as the temporal derivative of the T1-weighted MRI signal. The temporal derivative of the T1-weighted signal was computed by first calculating a time course of the average signal in each NMR tube. The derivative of the T1-weighted signal (S) at a given time point (dS/dt) was calculated as the signal difference between consecutive time points divided by the time difference between time points (in min).
Tumour model
Fibrosarcomas [Citation37] were grown in the flank of female Fischer-344 rats. For the in vivo experiments, cells were harvested from donor animals and then directly injected into the left flank of the rats. The maximum diameter of the tumours was 1.7 ± 0.5 cm (mean and standard deviation) at the time of imaging. Three tumour-bearing rats were imaged. All animal housing and handling was conducted under protocols approved by the Duke Institutional Animal Care and Use Committee (IACUC).
Animal set-up for imaging
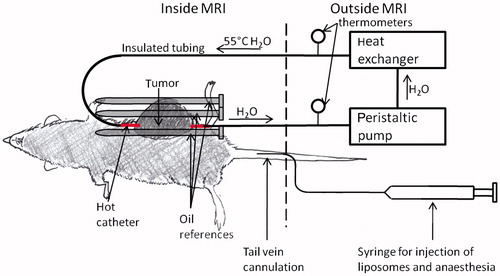
The experimental set-up for the animal imaging experiments is shown in . The tail vein was catheterised for injection of liposomes and anaesthesia. After catheterisation, the rat was anaesthetised with 50 mg/kg Nembutal by tail vein catheter followed by 1 mL saline. A 16-gauge catheter was then inserted through the centre of the tumour for administering MHT [Citation30]. The rat was then placed on a cradle, and six oil references (described below) were placed around the tumour. Also, a breathing monitor was placed under the lungs of the rat, an electrocardiograph was used to monitor heart rate, and a rectal thermometer was used to measure the core body temperature of the rat. The entire physiological monitoring system was obtained from Coulbourn Instruments (Whitehall, PA, USA), except for the digital temperature probe, which was obtained from YTI. The rat was then placed inside a 6-cm diameter custom-built transmit/receive radiofrequency coil. Warm air was blown through the bore of the scanner to keep the animal’s body temperature at a target temperature range of 35–37 °C. Imaging was initiated, and 11 min of ‘baseline’ scans (8 scans total) were acquired before any injection or heating took place. After baseline imaging, an additional dose of 17 mg/kg Nembutal was administered if the breathing monitor indicated that the animal was recovering from anaesthesia during the experiment. After the 11 min of baseline imaging, liposomes were injected into the tail vein. Heated water was pumped through the catheter that had been inserted through the tumour 10 min after the injection of liposomes. The water temperature was measured with a thermometer 1 m upstream and 1 m downstream of the tumour, and the temperature of the water in the catheter was equal to the average of the upstream and downstream water temperature [Citation30]. The heating lasted for at least 25 min during imaging.
Figure 1. Setup for in vivo imaging studies (image not to scale). The tumour, which is on the left flank and shaded dark grey, is pierced with the hot catheter. During heating, a peristaltic pump pushes heated water (55 °C) through the hot catheter. For drift correction, three oil references were placed around the tumour (shown above) and three oil references were placed under the rat’s body (not shown). Liposomes and anaesthesia were injected via tail vein catheter.
Drift correction
In the MRI scanner used in this study, the bulk magnetic field strength drifted by up to 0.05 ppm in a period of half an hour, which would result in an error of 5 °C if uncorrected [Citation38]. The method used to correct for this effect was adapted from literature [Citation19,Citation38,Citation39] and implemented in MATLAB. For both phantom and animal experiments, six oil references were placed in the field of view because oil exhibits a 200-fold weaker temperature-phase dependence than water [Citation40]. The oil references consisted of 5 mm outer diameter plastic tubes with 0.4 mm thick walls filled with silicone oil (Thomas Scientific 6428R25, Swedesboro, NJ) and sealed with parafilm (Pechiney Plastic Packaging, Chicago, IL, USA). For each time point, an image of field drift was calculated by fitting a minimum curvature spline [Citation41] to the change in oil reference phase between time points. The phase was unwrapped on a voxel-by-voxel basis using MATLAB based on the assumption that a change in voxel phase by more than 180° between consecutive time points was due to phase wrapping. This resulted in an image of drift across the entire field of view (including the tumour). For each slice, the field drift maps were then summed over time to calculate a field drift phase map over the course of the experiment. The resulting field drift phase maps were then subtracted from the entire phase map at each time point, so that the remaining phase maps represent changes in the temperature-dependent proton resonance frequency shift. After the drift correction, the phase maps were converted to temperature change as described below.
Converting raw MRI phase data into temperature change images
Temperature change images were obtained by phase mapping [Citation39]. Phase mapping creates an image where the value of each voxel is equal to the phase of the magnetisation in that voxel at the echo time. After correcting for field drift, the change in phase of each voxel was converted to temperature change using the equation
where
is the phase of a voxel at time t. t0 is the time point corresponding to the reference image for which ΔT = 0 °C, α is the temperature dependence of the chemical shift of water protons (−0.01 ppm/°C [Citation42]), B0 is the magnetic field strength (2 Tesla), γ is the gyromagnetic ratio of hydrogen nuclei, and TE is the echo time (15 ms) [Citation21].
The heat-triggered release ratio
The heat-triggered release ratio (HTRR) is a metric used during in vivo experiments to measure the release of Mn2+ from Mn-LTSL. HTRR is defined on a voxel-by-voxel basis as the signal at any given time ‘t’ normalised to the stable signal just before heating:
where S.t) is the voxel signal intensity at time ‘t’. S.t0) was chosen to be the average signal in a given voxel for the four pre-heating images acquired between 6 min and 10 min after injection of liposomes.
Conversion of temperature change to absolute temperature in vivo
Conversion of PRFS measurements to absolute temperature was performed separately for each of five image slices taken from three different rats. The conversion began by first dividing the tumour images into annular regions of interest (ROIs) centred on the heating catheter. The thickness of the ROIs in the imaging plane (inner minus outer diameter) was 3 voxels (0.6 mm). Next, the time series of HTRR was calculated separately for each annular ROI using MATLAB. The HTRR time series were then analysed to find annular ROIs that experienced greater than 0.07 min−1 HTRR increase after the initiation of heating. The 0.07 min−1 threshold was chosen because it was above the noise level, but low enough to isolate peaks in HTRR. This step typically isolated two or three consecutive time points (hereafter referred to as the ‘calibration time points’) for each of the four annular ROIs closest to the heating catheter (hereafter referred to as ‘calibration ROIs’).
Next, for all of the calibration ROIs in a given image slice, the average temperature change was computed during the calibration time points, yielding a single average temperature change (ΔTcal) and a corresponding standard error of the mean (SEM) for the entire image. ΔTcal was calculated once for each image slice. The final step in the conversion was to add a constant temperature correction (Tcorr) to the entire PRFS time series, thus converting temperature change to absolute temperature. The approximation was made that the initial baseline temperature in the calibrated region was spatially constant, and thus Tcorr has no spatial dependence. Tcorr was calculated from the following equation:
where the value 43.1 °C was determined in the Results section as the temperature corresponding to the maximum SER. A time series of images of absolute temperature (T.t, x, y)) were obtained from the following equation:
where ΔT.t, x, y) are the temperature change images generated with the PRFS method. In this report, the images T.t, x, y) are referred to ‘calibrated’ or ‘absolute’ temperature images. The standard error of the mean of T.t, x, y) was calculated in annular ROIs using error propagation:
where
,
,
, and
are respectively the SEM of T.t, x, y) within the ROI, the SEM of Tm measured with MRI in the 0.06–0.5 mM concentration range (0.3 °C), the SEM of ΔTcal for the imaging slice, and the SEM of the temperature change image voxels within the ROI.
Comparison of MR and thermocouple temperature measurements
The calibrated MR temperature measurements made in this study were compared to a model of the actual temperature distribution [Citation30]. The model was validated against measurements made with thermocouples in a previous study [Citation30]. The heat applicator, tumour model, rat gender/species, MR scanner and console were identical between the current study and the thermocouple study [Citation30]. The temperature distribution in the tumour was described by the radial 1D steady-state heat transfer equation
where Q is the internal heat generation of the tissue, k is the thermal conductivity of the tissue, and C1 and C2 are integration constants that depend on the catheter and surface temperature of the tumour [Citation30].
Equation 7 was used to calculate the tumour temperature distribution in two steps. As an overview, first Q/4k (°C/mm2) was calculated for each analysed image slice (five slices total from three rats). Second, the catheter surface temperature and tumour surface temperature together with Q/.k were used to solve for T.r). For the step where Q/4k was calculated, Equation 7 was fitted to uncalibrated MR temperature change measurements 20 min after the initiation of heating. The radial temperature change measurements (ΔT.r)) were generated by taking the average temperature change within an annular ROI centred at the catheter. For a given annular ROI, ‘r’ was the average of the inner and outer diameter of the ROI. Finally, the plot of ΔT.r) was fitted to Equation 7 using the ‘fit’ function of MATLAB, yielding a value of Q/4k for that tumour. The values of C1 and C2 generated by this fit are not used in further analysis because they were generated from a fit to temperature change.
For the step that modelled for the absolute temperature distribution in the tumour (T.r)), the procedure introduced in reference [Citation30] was used. The procedure uses the catheter surface temperature, the tumour skin temperature, and the Q.4k for a given tumour to solve for T.r) in terms of absolute temperature [Citation30]. The catheter surface temperature was equal to 6 °C less than hot water temperature in the catheter [Citation30]. Measurement of the hot water temperature was described above. The average skin surface temperature was measured in the MRI to be 39.5 °C in Viglianti et al. [Citation30]. Q/4k was calculated separately for each image slice as described in the previous paragraph. The catheter surface temperature (r = 0.83 mm), the skin surface temperature (r = 7–9 mm depending on image slice and tumour) together with Q/4k provided enough information to fit Equation 7, providing a curve for T.r). The radius of the skin surface temperature (39.5 °C) was calculated as one half of the largest diameter of the tumour in the image. The resulting T.r) curve was plotted on the same graph as the T.r) curve measured with MRI, and the root mean squared difference (RMSD) between the two curves was calculated and reported.
Results
Mn-LTSL phase transition: determining the Tm of Mn-LTSL with DSC
DSC was used to measure the Tm of the Mn-LTSL in four media: DI water, saline, rat plasma, and whole rat blood (). The phase transition temperature was relatively consistent across these four media, and the average across all systems was 42.8° ± 0.1 °C. For rat blood, the Tm was 42.9° ± 0.2 °C, and this is the temperature that was assumed for an in vivo value of Tm.
Table 1. Phase transition temperature (Tm) of Mn-LTSL in various media measured with DSC.
Determining whether the release of Mn2+ from LTSL interferes with PRFS-based MR thermometry measurements
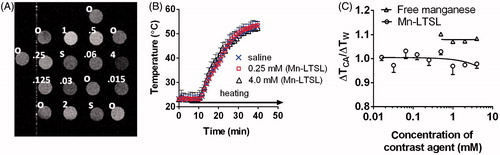
The PRFS-based temperature change images of Mn-LTSL tubes (0–4 mM) were analysed to determine whether the release of Mn2+ from Mn-LTSL interferes with PRFS temperature measurements. A T1-weighted image of the sample tubes containing oil, water, and Mn-LTSL is shown in . shows MRI temperature change measurements in a tube of water, 0.06 mM Mn-LTSL, and 4.0 mM Mn-LTSL. By 35 min after initiation of heating, all samples had reached a steady-state temperature (). The temperature change in the samples containing free Mn2+ or Mn-LTSL contrast agent (ΔTCA) was normalised to the temperature change measurements in water (ΔTW) in the same image 20 min after initiation of heating. The ratio ΔTCA/ΔTW is shown as a function of sample concentration in . An ANOVA test found that ΔTCA/ΔTW was not different for samples containing different Mn2+ or Mn-LTSL concentrations (Liposomal Mn2+: P = 0.3430). These data suggest release of Mn2+ from the liposome core does not affect MRI-based PRFS temperature measurements.
Figure 2. The effect of Mn2+ release on PRFS temperature. (A) A T1-weighted image of liposome samples, saline controls, and oil standards. The contents of the samples are indicated in the upper left of the samples. ‘o’ stands for silicone oil, ‘s’ stands for saline, and numbers stand for the overall Mn2+ concentration in Mn-LTSL samples in millimolar. During heating, 64 ± 1 °C air is blown through the bore, across the samples. (B) The temperature change during heating of a DI water sample and two Mn-LTSL samples, measured with MRI. Error bars are the standard error of the mean temperature change in each sample. (C) The MRI-measured temperature change in Mn-LTSL (ΔTCA) normalised to the temperature change in water (ΔTW) in the same image slice. Error bars for the Mn-LTSL data are equal to the standard error of the mean of three measurements. For free manganese, N = 2 and for Mn-LTSL, N = 4.
Release of Mn2+ from Mn-LTSL in saline measured with ICP-AES and MRI
ICP-AES measurements
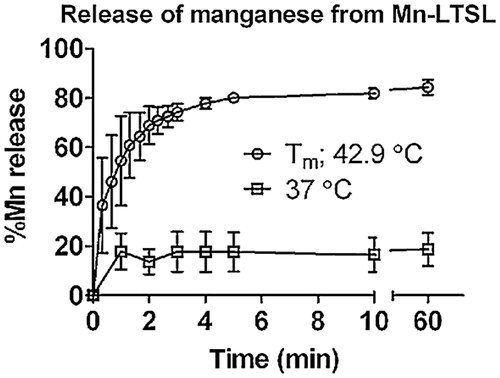
The percentage of Mn2+ released from Mn-LTSL (in saline) was measured at physiological temperature (37 °C) and at Tm (42.9 °C) in saline as a function of time using ICP-AES (). Approximately 20% of the encapsulated Mn2+ was released within 1 min at 37 °C, no further release occurred during the subsequent 59 min at 37 °C. When the sample was held at the Tm of the Mn-LTSL in saline (42.9 °C), 55% of the encapsulated Mn2+ was released after 1 min, rising to 80% release after 4 min. No further release was observed after 4 min. These data show that Mn2+ ions are released within minutes from the aqueous Mn-LTSL core when the liposome environment reaches the Tm of the liposome. Because the release of Mn2+ from Mn-LTSL causes signal enhancement on T1 weighted MR images, these data suggest that as the temperature of a voxel approaches the Tm of the liposome, MRI signal enhancement will occur at that time.
Figure 3. Release of Mn2+ from Mn-LTSL measured with ICP-AES. The time-release plots in saline of Mn-LTSL (0:9.8:5.2; DPPC:MSPC:DSPE-PEG2000; 50 mg lipid/mL; 63 mM overall Mn2+ concentration), was measured as a function of time. Error bars are the standard deviation of three measurements.
MRI measurements
The hypothesis that T1-weighted signal enhancement occurs when a sample is heated to Tm was tested by dynamic imaging of tubes of Mn-LTSL (similar set-up to ) during monotonic heating from 23–50 °C. shows the signal, normalised to baseline, of a saline sample of 0.25 mM Mn-LTSL, and a sample of 2.0 mM Mn-LTSL during heating. Before heating, the normalised signal was stable in all Mn-LTSL and water samples. shows that initiation of heating caused the signal of saline (by 20%) and 0.25 mM Mn-LTSL (initially by 10%) to decrease, simply because the T1 of water increases with increasing temperature. also shows that for 2.0 mM of Mn-LTSL, the signal initially increases during heating. After further heating, while the signal from the saline solution continued to decrease, the Mn-LTSL sample exhibited an increase in signal relative to the saline samples due to heat-triggered release of Mn2+ from the liposomes (, t = 25 min). An increase in signal during heating was observed for all samples in the 0.06–0.5 mM concentration range. Also, in , at ∼25 min the signal in the 2.0 mM Mn-LTSL sample decreased due to release of Mn2+. The opposing behaviour of the 2.0 mM and 0.25 mM samples will be interpreted below. In , the temperature during heating is shown for the same samples as in . shows that the temperature readings in the samples were the same to within experimental error throughout the experiment, and were unaffected by release of Mn2+ from the liposome.
Figure 4. The temperature-dependent T1-weighted MRI signal of Mn-LTSL phantoms. (A) The normalised (to baseline) signal intensity in saline and Mn-LTSL (0.25 mM and 2.0 mM) during heating. Error bars are the standard error of the mean signal intensity in each vial, and are displayed in one direction for better visualisation. (B) The PRFS-measured temperature of the same samples shown in A. Error bars are the standard error of the mean. Calculation of absolute temperature for this experiment is described in the Set-up of phantom imaging experiments in the Methods section. (C) The normalised signal intensity of a saline, 0.25 mM and 2.0 mM Mn-LTSL sample, plotted as a function of sample temperature during heating. (D) The rate of signal enhancement (i.e. the first temporal derivative of the T1-weighted MRI signal) as a function of temperature. The positive (0.25 mM) curve demonstrates an important observation made by this study, namely that the rate of signal enhancement change during heating reaches a maximum as the Mn-LTSL sample (0.06–0.5 mM) reaches the Tm of the liposome.
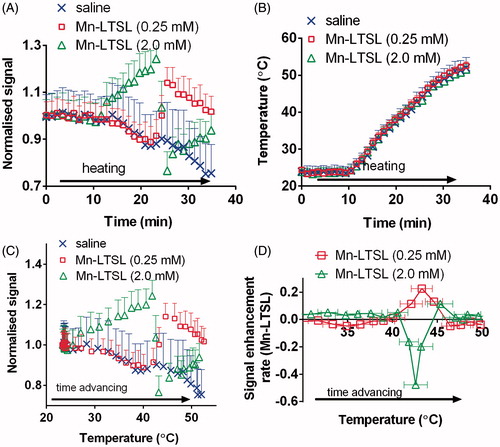
shows the T1-weighted MRI signal, normalised to baseline, as a function of absolute sample temperature for saline and two different LTSL samples: a low concentration of 0.25 mM Mn-LTSL, and an almost one order of magnitude higher concentration of 2.0 mM Mn-LTSL. In the 25–50 °C temperature range, the temperature of the samples increased monotonically as the experiment progressed. As can be seen in , the temperature dependence of the T1-weighted signal depended critically on the concentration of Mn-LTSL. In the case of saline, the signal decreased throughout the experiment, because the temperature and therefore T1 of water increased as the experiment progressed. A longer T1 results in a lower signal on T1-weighted images. In the case of the 0.25 mM sample () the signal initially decreased much like the saline sample, but then increased at approximately 43 °C due to heat-triggered release of Mn2+ from the liposome core. Finally, for the 2.0 mM sample, the normalised signal increased with increasing temperature below Tm, and decreased upon release. The phenomenon of decreasing signal upon release was only observed at high concentrations (>2 mM) in phantoms, and was not observed in rats (see below). An important observation related to is that the signal intensity of all Mn-LTSL samples changed abruptly near the liposome Tm (42.92 ± 0.02 °C in saline). Therefore, close to the Tm of the liposomes a peak in the rate of signal change was observed. This is depicted in , where the temporal first derivative of the T1-weighted signal (i.e. the signal enhancement rate; SER) is plotted as a function of absolute temperature. It was found that the SER reached a peak (hereafter referred to as a SER peak) when the sample was close to the Tm of the liposomes (). As shown in , for the 0.06–0.5 mM samples the SER peak was positive and fell in the 42.5–43.6 °C temperature range. For samples with Mn-LTSL concentration equal to 2.0 mM or 4.0 mM, the SER peak was negative and occurred in the 43.4–44.6 °C temperature range. For the 1.0 mM sample, there was no observed peak in signal enhancement rate, presumably because T1 and T2 shortening effects cancelled, resulting in a low net change in MRI signal.
Table 2. Temperature at which the maximum MRI signal enhancement rate occurred (Mn-LTSL samples suspended in saline).
The temperatures at which the SER peaks occurred are given in for different Mn-LTSL concentrations in saline. A paired ANOVA test was used to check whether the temperature corresponding to the SER peaks was statistically different between samples of different Mn-LTSL concentrations. The ANOVA test did not detect a significant difference (P = 0.08). Additionally, for the concentration range resulting in a positive SER peak (0.06–0.5 mM), the temperatures corresponding to SER peaks were not significantly different from the Tm of the liposome (t-test, P = 0.67). The data in also show that in the range 0.05–0.5 mM the temperature at which the peak signal enhancement rate occurs depends only weakly on Mn-LTSL concentration, and that the peak occurs when the liposome environment reaches the Tm of the liposome. The data in this section suggest that a SER peak gives a single (peak hold) measurement of absolute temperature.
Conversion of temperature change to absolute temperature in vivo
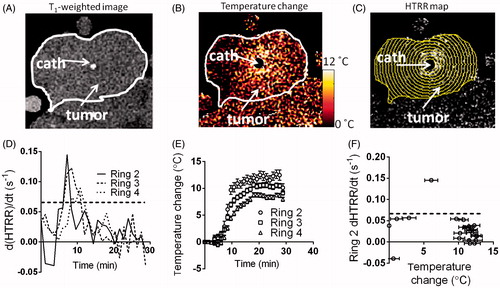
shows a T1-weighted image of a rat tumour prior to injection of Mn-LTSL. The location of the tumour and catheter are indicated on the image. Because the heating catheter was located in the centre of the tumour, the heating pattern was approximately circularly symmetric and centred at the catheter (). To take advantage of the symmetry of the system, annular ROIs were used to analyse temperature and HTRR time series. shows the annular ROIs drawn over a HTRR map of a tumour 15 min after Mn-LTSL injection and 5 min after the initiation of heating. shows the d(HTRR)/dt (analogous to the SER in the in vitro experiments) as a function of time for three of the annular ROIs in . The second, third and fourth annular ROIs from the centre are the calibration ROIs for this image slice. Local maxima in d(HTRR)/dt rise above the dotted line (0.07 min−1) in , resembling the findings of the phantom imaging experiments (). The times at which the d(HTRR)/dt rose above the dotted line are the calibration time points. The peaks in occurred due to heat-triggered release of Mn2+ from the Mn-LTSL. The temperature change of the same three annular ROIs as in is shown in . As can be seen, the temperature in each ring monotonically increased after initiation of heating, and the rings closer to the heat source (catheter) experience the greatest temperature increase (). The d(HTRR)/dt measurements from were plotted as a function of temperature change () and placed in a separate graph (). Note that the data in are the in vivo analogue of the data in . The temperature of the data point above the dotted line (0.07 min−1) in is used for the calculation of ΔTcal for that image time series.
Figure 5. Conversion of temperature change (PRFS) to absolute temperature. (A) A T1-weighted image of the tumour prior to heating and Mn-LTSL injection. The catheter is labelled and the tumour outlined in white. (B) A temperature change map 5 min after initiation of heating. (C) A HTRR map of the tumour 5 min after initiation of heating. The annular ROIs used to analyse the data are superimposed. The innermost ring is ring 1 and the ring number increases as the rings move outwards. (D) A plot of the rate of change of HTRR (d(HTRR)/dt) in rings 2–4 as a function of time. (E) A plot of temperature change as a function of time, in the same rings as in C. (F) The rate of HTRR increase plotted as a function of temperature change. The data point above the dotted threshold line was used for calculating ΔTcal and calibration of the MRI temperature maps.
It is useful to quantify the behaviour of the HTRR in the time range surrounding the onset of heat-triggered release of Mn-LTSL contents. To quantify this behaviour, ROIs were drawn close to the heating catheter in image slices taken through the centre of each rat tumour (one image per rat for this analysis). Using the HTRR time series in these ROIs, it was found that in the 5 min before the onset of heat-triggered signal enhancement, the HTRR decreased by 0.02 ± 0.01 (mean ± standard deviation of three rats). In the 5 min after the onset of heat-triggered signal enhancement, the HTRR increased by 0.34 ± 0.12. These data indicate that temporal changes in HTRR were dominated by heat-triggered release when the tumour reached Tm.
Comparison between MRI-measured temperature distribution and a reference temperature measurement
In order to quantify the accuracy of the calibration method proposed in this study, MRI temperature measurements were compared to a model of the actual temperature distribution in the tumour. Because the actual temperature distribution was partially determined from the tumour Q/4k (Equation 7 [Citation30]), the value of Q/4k was calculated for five image slices from three rats (). For rats 2 and 3, the confidence interval of Q/4k contained the value of 0.0202 ± 0.0034 °C/mm2 measured for the same tumour model in Viglianti et al. [Citation30]. Rats 2 and 3 were therefore analysed further to quantify the accuracy of the calibration method. However, rat 1 exhibited a nearly 10 times greater Q/4k than the tumours in Viglianti et al. [Citation30], and so it was not possible use determine C1. C2, and T.r) using Equation 7 for the tumour of rat 1. It is worth noting that rat 1 exhibited hypointense regions on T1-weighted images (not shown), which is caused by macroscopic regions of necrosis.
Table 3. Thermal parameters (Q/4k) of tumour and accuracy of calibration.
The calibrated measurements of T.r) are plotted for all three rats in . For rats 2 and 3 it was possible to compute the actual T.r) from equation 7, and the model is also plotted on and . To be clear, the model curves on are not fits to the data, but are modelled temperature distributions calculated from Q/4k, the water temperature, and the surface temperature of the tumour [Citation30]. Based on the model and MRI data in , the RMSD between the model and MRI was calculated for rats 2 and 3 and written in the rightmost column of . This analysis yielded a RMSD of between 0.9–1.8 °C depending on the experiment.
Figure 6. A comparison between the MRI-measured absolute temperature and modelled temperature distribution. (A) The MRI-measured absolute temperature for rat 1. No modelled temperature is shown for rat 1 because, as described in the main text, the value of Q.4k for this rat was much greater than the value of Q.4k for the tumours in Viglianti et al. [Citation30]. (B, C) The modelled and MRI-measured absolute T.r) for rats 2 and 3 respectively. Note that the ‘model’ data is not a fit to the MRI data, but is the temperature distribution in the tumour calculated from the procedure outlined in the methods section and Viglianti et al. [Citation30]. Error bars were calculated using Equation 6.
![Figure 6. A comparison between the MRI-measured absolute temperature and modelled temperature distribution. (A) The MRI-measured absolute temperature for rat 1. No modelled temperature is shown for rat 1 because, as described in the main text, the value of Q.4k for this rat was much greater than the value of Q.4k for the tumours in Viglianti et al. [Citation30]. (B, C) The modelled and MRI-measured absolute T.r) for rats 2 and 3 respectively. Note that the ‘model’ data is not a fit to the MRI data, but is the temperature distribution in the tumour calculated from the procedure outlined in the methods section and Viglianti et al. [Citation30]. Error bars were calculated using Equation 6.](/cms/asset/1e15b23f-ce31-4af6-8699-5b83e5be1946/ihyt_a_790091_f0006_b.jpg)
Spatial correlation between absolute temperature Mn-LTSL content release in vivo
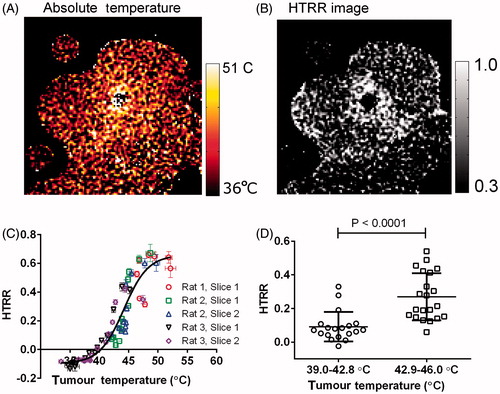
The final aim of this study was to test whether the spatial distribution of liposome content release within a tumour spatially correlates with absolute tumour temperature. To test this, HTRR and absolute (calibrated) temperature images were obtained 20 min after initiation of heating, at which time the tumour temperature was no longer increasing through time (see ). shows an absolute temperature image generated with the procedure described in the section above. shows an HTRR image of the same image slice and time point as the temperature image in . By qualitatively comparing and , it is observed that the HTRR is greater close to the heat source, where the tumour temperature was the greatest. This comparison suggests that there was a spatial correlation between tumour temperature and heat-triggered release. To more quantitatively test for a spatial correlation between Mn2+ release and absolute temperature, five image slices from three different rats were divided into annular ROIs centred at the hot catheter. The HTRR in each ROI was plotted then as a function of absolute temperature in that ROI (.) shows that there was indeed a spatial correlation between the HTRR and the absolute temperature, and the relationship was sigmoid (). The heat-triggered release ratio was markedly greater in regions above the Tm of the Mn-LTSL in rat blood (42.9 ± 0.2 °C). Next, the data from was split into temperature groups below (39.4–42.8 °C) and above (42.9–45.9 °C) the Tm (). shows that tumour regions below the liposome Tm experience less heat-triggered release than regions above the Tm.
Figure 7. A spatial correlation between HTRR and absolute tumour temperature. (A) An image of absolute temperature in the rat tumour 15 min after the initiation of heating. (B) An image of HTRR 15 min after the initiation of heating. (C) A plot of the HTRR as a function of absolute temperature. Each data point corresponds to the absolute temperature (abscissa) and HTRR measurement (ordinate) in a single annular ROI (see ) 15 min after the initiation of heating. (D) In this graph only tumour regions that fell in the 39.4–45.9 °C temperature range 15 min after initiation of heating were considered, because this range surrounds the liposome bilayer Tm. The HTRR values for annular ROIs were split into a 39.4–42.8 °C group (below Tm) and a 42.9–45.9 °C group (above Tm), and each group was plotted in a separate column. The P-value was obtained with a one-tailed t-test without assuming equal variances between groups (Mann-Whitney test).
Discussion
Current methods for measuring tumour temperature during mild hyperthermia have limitations. Invasive temperature measurements are accurate and fast, but they sample the treatment volume sparsely and/or require surgical implantation. PRFS thermometry overcomes these limitations by providing non-invasive volumetric images of temperature change. However, PRFS thermometry is only able to measure temperature change and not absolute temperature [Citation21]. In some cases, such as preclinical animal imaging, or measurements of extremity tumours in humans, the absolute baseline tumour temperature is uncertain. The results from the current study show that PRFS-based images of temperature change can be calibrated with T1-weighted images of Mn-LTSL content release, allowing dynamic and high resolution images of absolute temperature in solid tumours. In this study, a single calibration was performed for an entire image slice, but in principle the calibration could be performed on a voxel-by-voxel basis if the signal to noise ratio is sufficient.
Using SER to measure temperature
Using Mn-LTSL to measure temperature required a simple relationship between SER and temperature. However, in the Mn-LTSL concentration range between 0–4.0 mM the dependence of SER on temperature was not simple because the temperature of the SER peak varied by about 2 °C and changed sign above 1.0 mM. This complex behaviour was due to T2-shortening obscuring T1-shortening effects above 0.5 mM Mn-LTSL, which resulted in signal decrease after heat triggered release [Citation32]. The situation was further complicated because below Tm, the longitudinal relaxivity of Mn-LTSL increases with increasing temperature due to increased exchange of water across the liposome membrane [Citation30], which resulted in a higher signal at higher temperature even without Mn2+ release (, 2.0 mM sample, 25–42 °C). However, in the range 0–0.5 mM the relationship between SER and temperature was much simpler; in that range the SER peak was always positive and occurred within 1 °C of Tm measured with DSC (). Thus Mn-LTSL are most useful for measuring temperature in the 0–0.5 mM range when the SER peak is positive, as was the case in the in vivo experiments. Because the signal enhancement after heating was always positive in vivo, a localised positive peak in d(HTRR)/dt suggested that the tissue had been heated to Tm as shown in phantoms (; 0.065–0.5 mM). The negative signal enhancement that occurred at (Mn-LTSL) > 2.0 mM in phantoms was not observed in vivo, presumably because such a high Mn-LTSL concentration did not occur in the tumour.
The main purpose of this study was to develop a method to convert temperature change images into absolute temperature. The conversion was made possible by acquiring a time course of both temperature change and T1-weighted images of the tumour during MHT. It was found that the T1-weighted images of tumours exhibited a ∼50% increase in local signal in regions that were heated above the Tm of the liposome. It was also noted that this heat-triggered signal increase occurred locally in heated tumour regions, occurred at a well-defined temperature in phantoms, and occurred within minutes of reaching the liposome Tm in phantoms and tumours. These findings suggested that a local increase in T1-weighted signal within a tumour region signifies that the region has been heated to Tm, thus providing a one-time (i.e. peak hold) measurement of absolute temperature. The peak hold measurement of absolute temperature was used to convert an entire PRFS relative temperature time series into an absolute temperature time series.
The accuracy of the absolute temperature measurements made in this study was calculated by comparing the MRI-measured absolute temperature to a model of the temperature distribution generated in a previous study (Equation 7) [Citation30]. Using a modelled temperature distribution was necessary due to the experimental difficulty of measuring the entire temperature distribution with a thermocouple inside the MRI [Citation30]. When calculating the accuracy of the temperature measurements, the measurements of rat 1 were excluded because the estimated value of Q/4k was an order of magnitude higher than the Q/4k of the tumours in Viglianti et al. [Citation30] and the other tumours of this study. The larger value of Q/4k could be explained by the hypointense regions of necrosis observed in T1-weighted images; necrosis would result in regions of decreased blood flow. For rats 2 and 3, the measured Q/4k values were consistent with those in Viglianti et al. [Citation30], which enabled us to model the actual temperature distribution and compute the RMSD between the MRI measurements and the actual temperature. Overall, the calculated RMSD values varied between 0.9° and 1.8 °C depending on the experiment.
The current absolute thermometry method has a few limitations worth considering. First, a reliable conversion to absolute temperature requires that the tissue must be heated above Tm, which in general will not occur for all regions within a tumour. Thus, the utility of the absolute thermometry method proposed here will depend on factors including the desired temperature distribution within a tumour, the Tm of the liposome, and the heat applicator. The second potentially limiting factor is that Mn2+ is currently not FDA approved for clinical use. The combined PRFS/Mn-LTSL method shown here would therefore be useful for animal studies where the absolute temperature scale is important. For human use, it would be preferable to use an approved chelated gadolinium contrast agent. Gadolinium contrast agents have already been encapsulated in LTSL, and the release of gadolinium from LTSL has been imaged in phantoms and in vivo [Citation43–46]. In the case of both gadolinium and Mn2+ contrast agents, it would be useful to test whether the magnetic susceptibility associated with paramagnetic ions would cause a shift in the water resonance frequency as the contrast agent accumulates in a tumour. Another limitation is that the dependence of SER peak temperature on heating rate has not yet been characterised. In this study, the heating rate at the Tm was 0.28 ± 0.14 °C/min (mean ± standard deviation) for in vitro experiments and 0.8 ± 0.5 °C/min for the in vivo experiments. Therefore, the in vivo heating rates observed in this study are greater than those achievable by non-invasive microwave applicators, which elevate temperatures at rates in the 0.1–0.6 °C/min range [Citation47,Citation48], but less than the heating rates observed for focused ultrasound heating (1–10 °C/min [Citation49]). In general, the absolute calibration method proposed here could be optimised by using a liposome formulation where the timescale of contrast agent release at Tm is comparable to the timescale that tumour regions exist close to Tm. For example, in the current study, the tumours were heated from Tm−1 °C to Tm in approximately 1 min, and the Mn-LTSL release 55% of their contents in approximately 1 min. Thus for the in vivo experiments presented here, the timescale of release was comparable to the timescale where the tumours were close to Tm. Heating rates are easily calculated using the PRFS method, so if the temperature of a SER peak depends on heating rate, the dependence could be controlled for during temperature map calibration.
Thermometry in the context of LTSL-based drug delivery
In the seminal works proposing Mn-LTSL as imageable drug delivery vehicles, it was shown that T1 mapping before and after drug release in solid tumours enabled calculation of drug concentration maps in the tumour [Citation30–32]. Temperature imaging could improve the accuracy of calculated concentration maps. In the works mentioned above [Citation30–32], calculation of the drug distribution requires knowing the longitudinal relaxivity of Mn-LTSL. However, since relaxivity of free Mn2+ is itself temperature dependent, the true relaxivity is not known unless the tumour temperature distribution is also measured [Citation30]. Using the method presented in this study, the drug distribution calculations can be corrected for temperature effects using an absolute temperature image. This would require an additional injection of Mn-LTSL prior to heating the tumour.
When using LTSL to deliver chemotherapeutic agents, it is useful to understand the relationship between tumour temperature distribution and the amount of drug that actually accumulates in the tumour [Citation31]. It has been shown previously that the amount of drug delivered by LTSL can be calculated from the T1-weighted signal enhancement if Mn2+ is also loaded into the liposomes [Citation30–32]. In the current study, the spatial relationship between temperature and Mn2+ release was measured (), and it was found that there was a strong spatial correlation between temperature and Mn2+ accumulation. In a more complex tumour system, such as tumours found in humans, the relationship between temperature and release would be less straightforward because vascular perfusion is highly variable between different positions within the tumour. Thus, in more complex tumour systems, a model relating LTSL drug release to temperature should take into account spatial variations of perfusion within the tumour.
Conclusions
This report shows that Mn-LTSL can provide an absolute temperature reference for a time series of PRFS temperature change images during cancer hyperthermia. This would be useful for determining the temperature of tissue around an ablation cavity or calculating thermal dose during mild hyperthermia. This report also shows that in a preclinical tumour model system, the heat-triggered release of liposome contents into a tumour spatially correlates with the temperature distribution. In conclusion, this study characterises the release of Mn-LTSL contents into a tumour, and suggests a method to convert temperature change images into absolute temperature.
Declaration of interest
This work was supported by grants from the US NIH/NCI CA42745-21, -22, -23. All imaging was performed at the Duke Center for In Vivo Microscopy (CIVM), an NCRR/NIBIB/NCI National Resource (P41 RR005959/P41 EB015897/U24 CA092656). The authors alone are responsible for the content and writing of the paper.
References
- Dewhirst MW, Vujaskovic Z, Jones E, Thrall D. Re-setting the biologic rationale for thermal therapy. Int J Hyperthermia 2005;21:779–90
- Durand RE. Potentiation of radiation lethality by hyperthermia in a tumor model: Effects of sequence, degree, and duration of heating. Int J Radiat Oncol Biol Phys 1978;4:401–5
- Lepock JR, Cheng KH, Al-Qysi H, Sim I, Koch CJ, Kruuv J. Hyperthermia-induced inhibition of respiration and mitochondrial protein denaturation in CHL cells. Int J Hyperthermia 1987;3:123–32
- Secomb TW, Hsu R, Dewhirst MW, Klitzman B, Gross JF. Analysis of oxygen transport to tumor tissue by microvascular networks. Int J Radiat Oncol Biol Phys 1993;25:481–9
- Shakil A, Osborn JL, Song CW. Changes in oxygenation status and blood flow in a rat tumor model by mild temperature hyperthermia. Int J Radiat Oncol Biol Phys 1999;43:859–65
- Vujaskovic Z, Poulson JM, Gaskin AA, Thrall DE, Page RL, Charles HC, et al. Temperature-dependent changes in physiologic parameters of spontaneous canine soft tissue sarcomas after combined radiotherapy and hyperthermia treatment. Int J Radiat Oncol Biol Phys 2000;46:179–85
- Emami B, Scott C, Perez CA, Asbell S, Swift P, Grigsby P, et al. Phase III study of interstitial thermoradiotherapy compared with interstitial radiotherapy alone in the treatment of recurrent or persistent human tumors. A prospectively controlled randomized study by the Radiation Therapy Group. Int J Radiat Oncol Biol Phys 1996;34:1097–104
- Perez CA, Gillespie B, Pajak T, Hornback NB, Emami B, Rubin P. Quality assurance problems in clinical hyperthermia and their impact on therapeutic outcome: A report by the Radiation Therapy Oncology Group. Int J Radiat Oncol Biol Phys 1989;16:551–8
- Perez CA, Pajak T, Emami B, Hornback NB, Tupchong L, Rubin P. Randomized phase III study comparing irradiation and hyperthermia with irradiation alone in superficial measurable tumors. Final report by the Radiation Therapy Oncology Group. Am J Clin Oncol 1991;14:133–41
- Franckena M, Fatehi D, de Bruijne M, Canters RA, van Norden Y, Mens JW, et al. Hyperthermia dose–effect relationship in 420 patients with cervical cancer treated with combined radiotherapy and hyperthermia. Eur J Cancer 2009;45:1969–78
- Dreher MR, Elas M, Ichikawa K, Barth ED, Chilkoti A, Rosen GM, et al. Nitroxide conjugate of a thermally responsive elastin-like polypeptide for noninvasive thermometry. Med Phys 2004;31:2755–62
- Zhang Y, Samulski TV, Joines WT, Mattiello J, Levin RL, LeBihan D. On the accuracy of noninvasive thermometry using molecular diffusion magnetic resonance imaging. Int J Hyperthermia 1992;8:263–74
- Clegg ST, Das SK, Zhang Y, Macfall J, Fullar E, Samulski TV. Verification of a hyperthermia model method using MR thermometry. Int J Hyperthermia 1995;11:409–24
- Zhang S, Malloy CR, Sherry AD. MRI thermometry based on PARACEST agents. J Am Chem Soc 2005;127:17572–3
- Parker DL. Applications of NMR imaging in hyperthermia: An evaluation of the potential for localized tissue heating and noninvasive temperature monitoring. IEEE Trans Biomed Eng 1984;31:161–7
- Galiana G, Branca RT, Jenista ER, Warren WS. Accurate temperature imaging based on intermolecular coherences in magnetic resonance. Science 2008;322(5900):421–4
- Hekmatyar SK, Poptani H, Babsky A, Leeper DB, Bansal N. Non-invasive magnetic resonance thermometry using thulium-1,4,7,10-tetraazacyclododecane-1,4,7,10-tetraacetate (TmDOTA(−)). Int J Hyperthermia 2002;18:165–79
- De Poorter J. Noninvasive MRI thermometry with the proton resonance frequency method: Study of susceptibility effects. Magn Reson Med 1995;34:359–67
- De Poorter J, De Wagter C, De Deene Y, Thomsen C, Stahlberg F, Achten E. Noninvasive MRI thermometry with the proton resonance frequency (PRF) method: In vivo results in human muscle. Magn Reson Med 1995;33:74–81
- MacFall JR, Prescott DM, Charles HC, Samulski TV. 1H MRI phase thermometry in vivo in canine brain, muscle, and tumor tissue. Med Phys 1996;23:1775–82
- Rieke V, Butts Pauly K. MR thermometry. J Magn Reson Imaging 2008;27:376–90
- Das SK, Macfall J, McCauley R, Craciunescu O, Dewhirst MW, Samulski TV. Improved magnetic resonance thermal imaging by combining proton resonance frequency shift (PRFS) and apparent diffusion coefficient (ADC) data. Int J Hyperthermia 2005;21:657–67
- de Senneville BD, Roujol S, Jais P, Moonen CT, Herigault G, Quesson B. Feasibility of fast MR-thermometry during cardiac radiofrequency ablation. NMR Biomed 2012;25:556–62
- McDannold N. Quantitative MRI-based temperature mapping based on the proton resonant frequency shift: Review of validation studies. Int J Hyperthermia 2005;21:533–46
- Craciunescu O, Stauffer P, Soher B, Maccarini P, Das S, Cheng K, et al. Accuracy of real time noninvasive temperature measurements using magnetic resonance thermal imaging in patients treated for high grade extremity soft tissue sarcomas. Med Phys 2009;36:4848–58
- Stauffer P, Craciunescu O, Maccarini P, Arunachalam K, Arabe O, Stakhursky V, et al. Clinical utility of magnetic resonance thermal imaging (MRTI) for realtime guidance of deep hyperthermia. Proc SPIE: Energy-Based Treatment of Tissue and Assessment V, 2009;7181OI
- Li Z, Vogel M, Maccarini P, Stakhursky V, Soher B, Craciunescu O, et al. Improved hyperthermia treatment control using SAR/temperature simulation and PRFS magnetic resonance thermal imaging. Int J Hyperthermia 2011;27:86–99
- Staruch R, Chopra R, Hynynen K. Localised drug release using MRI-controlled focused ultrasound hyperthermia. Int J Hyperthermia 2011;27:156–71
- Kickhefel A, Rosenberg C, Roland J, Viallon M, Gross P, Schick F, et al. A pilot study for clinical feasibility of the near-harmonic 2D referenceless PRFS thermometry in liver under free breathing using MR-guided LITT ablation data. Int J Hyperthermia 2012;28:250–66
- Viglianti BL, Abraham SA, Michelich CR, Yarmolenko PS, MacFall JR, Bally MB, et al. In vivo monitoring of tissue pharmacokinetics of liposome/drug using MRI: Illustration of targeted delivery. Magn Reson Med 2004;51:1153–62
- Ponce AM, Viglianti BL, Yu D, Yarmolenko PS, Michelich CR, Woo J, et al. Magnetic resonance imaging of temperature-sensitive liposome release: Drug dose painting and antitumor effects. J Natl Cancer Inst 2007;99:53–63
- Viglianti BL, Ponce AM, Michelich CR, Yu D, Abraham SA, Sanders L, et al. Chemodosimetry of in vivo tumor liposomal drug concentration using MRI. Magn Reson Med 2006;56:1011–18
- Lindner LH, Reinl HM, Schlemmer M, Stahl R, Peller M. Paramagnetic thermosensitive liposomes for MR-thermometry. Int J Hyperthermia 2005;21:575–88
- McDannold N, Fossheim SL, Rasmussen H, Martin H, Vykhodtseva N, Hynynen K. Heat-activated liposomal MR contrast agent: Initial in vivo results in rabbit liver and kidney. Radiology 2004;230:743–52
- Salomir R, Palussiere J, Fossheim SL, Rogstad A, Wiggen UN, Grenier N, et al. Local delivery of magnetic resonance (MR) contrast agent in kidney using thermosensitive liposomes and MR imaging-guided local hyperthermia: A feasibility study in vivo. J Magn Reson Imaging 2005;22:534–40
- Mills JK, Needham D. The materials engineering of temperature-sensitive liposomes. Methods Enzymol 2004;387:82–113
- Grant JP, Wells SA Jr. Tumor resistance in rats immunized to fetal tissues. J Surg Res. 1974;16:533–40
- Wyatt C, Soher B, Maccarini P, Charles HC, Stauffer P, Macfall J. Hyperthermia MRI temperature measurement: Evaluation of measurement stabilisation strategies for extremity and breast tumours. Int J Hyperthermia 2009;25:422–33
- MacFall JR, Soher BJ. From the RSNA refresher courses: MR imaging in hyperthermia. Radiographics 2007;27:1809–18
- Kuroda K, Oshio K, Chung AH, Hynynen K, Jolesz FA. Temperature mapping using the water proton chemical shift: A chemical shift selective phase mapping method. Magn Reson Med 1997;38:845–51
- Frank R. Smooth interpolation of scattered data by local thin plate splines. Comput Math Applic 1982;8:273–81
- Ishihara Y, Watanabe H, Okamoto K, Kanamatsu T, Tsukada Y. Temperature monitoring of internal body heating induced by decoupling pulses in animal (13)C-MRS experiments. Magn Reson Med 2000;43:796–803
- Tagami T, Foltz WD, Ernsting MJ, Lee CM, Tannock IF, May JP, et al. MRI monitoring of intratumoral drug delivery and prediction of the therapeutic effect with a multifunctional thermosensitive liposome. Biomaterials 2011;32:6570–8
- Negussie AH, Yarmolenko PS, Partanen A, Ranjan A, Jacobs G, Woods D, et al. Formulation and characterisation of magnetic resonance imageable thermally sensitive liposomes for use with magnetic resonance-guided high intensity focused ultrasound. Int J Hyperthermia 2011;27:140–55
- de Smet M, Heijman E, Langereis S, Hijnen NM, Grull H. Magnetic resonance imaging of high intensity focused ultrasound mediated drug delivery from temperature-sensitive liposomes: An in vivo proof-of-concept study. J Control Release 2011;150:102–10
- Peller M, Schwerdt A, Hossann M, Reinl HM, Wang T, Sourbron S, et al. MR characterization of mild hyperthermia-induced gadodiamide release from thermosensitive liposomes in solid tumors. Invest Radiol 2008;43:877–92
- Craciunescu OI, Stauffer PR, Soher BJ, Wyatt CR, Arabe O, Maccarini P, et al. Accuracy of real time noninvasive temperature measurements using magnetic resonance thermal imaging in patients treated for high grade extremity soft tissue sarcomas. Med Phys 2009;36:4848–58
- Paulides MM, Bakker JF, Linthorst M, van der Zee J, Rijnen Z, Neufeld E, et al. The clinical feasibility of deep hyperthermia treatment in the head and neck: New challenges for positioning and temperature measurement. Phys Med Biol 2010;55:2465–80
- Auboiroux V, Viallon M, Roland J, Hyacinthe JN, Petrusca L, Morel DR, et al. ARFI-prepared MRgHIFU in liver: Simultaneous mapping of ARFI-displacement and temperature elevation, using a fast GRE-EPI sequence. Magn Reson Med 2012;68:932–46