Abstract
Introduction. The aims of this study were to analyze the systematic and random interfractional set-up errors during Intensity Modulated Radiation Therapy (IMRT) in 20 consecutive nasopharyngeal carcinoma (NPC) patients by means of Electronic Portal Images Device (EPID), to define appropriate Planning Target Volume (PTV) and Planning Risk Volume (PRV) margins, as well as to investigate set-up displacement trend as a function of time during fractionated RT course. Material and methods. Before EPID clinical implementation, an anthropomorphic phantom was shifted intentionally 5 mm to all directions and the EPIs were compared with the digitally reconstructed radiographs (DRRs) to test the system's capability to recognize displacements observed in clinical studies. Then, 578 clinical images were analyzed with a mean of 29 images for each patient. Results. Phantom data showed that the system was able to correct shifts with an accuracy of 1 mm. As regards clinical data, the estimated population systematic errors were 1.3 mm for left-right (L-R), 1 mm for superior-inferior (S-I) and 1.1 mm for anterior-posterior (A-P) directions, respectively. Population random errors were 1.3 mm, 1.5 mm and 1.3 mm for L-R, S-I and A-P directions, respectively. PTV margin was at least 3.4, 3 and 3.2 mm for L-R, S-I and A-P direction, respectively. PRV margins for brainstem and spinal cord were 2.3, 2 and 2.1 mm and 3.8, 3.5 and 3.2 mm for L-R, A-P and S-I directions, respectively. Set-up error displacements showed no significant changes as the therapy progressed (p>0.05), although displacements >3 mm were found more frequently when severe weight loss or tumor nodal shrinkage occurred. Discussion. These results enable us to choose margins that guarantee with sufficient accuracy the coverage of PTVs and organs at risk sparing. Collected data confirmed the need for a strict check of patient position reproducibility in case of anatomical changes.
Recent evidence from the literature shows that in the treatment of nasopharyngeal carcinoma (NPC), intensity modulated radiation therapy (IMRT) improves disease control, thus decreasing radiation induced complications, in particular xerostomia [Citation1]. In fact, NPC is a good candidate for IMRT because of its horseshoe-shaped target volumes (Gross Target Volume, GTV and Clinical Target Volumes, CTVs) and its proximity to radiosensitive normal structures (Organs at Risk, OARs).
IMRT plan optimization usually produces relatively steep dose gradients between GTV/CTVs and OARs. According to ICRU-62 report [Citation2], inappropriate definition of CTV-PTV (Planning Target Volume) and OAR-PRV (Planning Risk Volume) margins, accounting for organ motion and set-up treatment uncertainties, may yield CTV underdosing and/or OAR overdosing. In order to define this margin for head and neck cancer, organ motion could be neglected, while variability in treatment set-up must be carefully considered.
Set-up errors consist of a random component, reflecting the unpredictable daily variability in isocenter positioning, and a systematic component, impacting in a relatively stable way on each fraction of a single radiotherapy course [Citation3]. Nowadays, systematic and random deviations are commonly investigated using an electronic portal imaging device (EPID) [Citation4,Citation5].
Isocenter targeting is evaluated by comparing the portal images with reference images (both simulation images and digitally reconstructed radiographs, DRRs) aligning edge fields and bony landmarks by means of software tools. The major drawback is that it is a two dimensional (2D) image analysis method, so set-up errors caused by out-of-plane rotations can not be detected [Citation4], although several authors reported that out-of-plane rotational errors less than 3° do not significantly affect the projected anatomy [Citation6,Citation7].
In this paper we present an analysis of set-up variability in 20 consecutive patients affected by NPC treated with IMRT at our Radiation Department.
Before clinical implementation of EPID, a study using suitable phantoms had been performed to validate all quantitative analysis tools related to the use of EPID and its software.
An analysis of set-up displacements as a function of time during treatment course was also reported. Finally, appropriate PTV and PRV margins were estimated.
Material and methods
Patient group
Twenty consecutive patients with non-metastatic NPC treated with IMRT at our Institution were included in the present study.
Patient stages according to 2002 TNM classification were: Stage I in one (5%), Stage IIB in three (15%), Stage III in seven (35%), Stage IV in nine patients (45%). Three patients (15%) underwent definitive IMRT alone, four patients (20%) received IMRT plus chemotherapy (CHT) and 13 patients (65%) had induction CHT for two or three cycles and concurrent CHT-IMRT.
Definition of volumes of interest and IMRT treatment
All patients were immobilized with a thermoplastic mask, secured to a carbon fiber plate, covering head, neck and shoulders with four fixation points (Orfit Masks, Orfit Industrie NV, Wijnegem, Belgium). The base plate was not fixed to the table couch of the linac.
Patients underwent a planning computerized tomography (CT) scan (Philips Medical System, CT-PQ 2000 with AcQSIM, version 4.1) from skull apex to mid-sternum with a slice thickness of 3–5 mm.
In patients submitted to induction CHT, CT scan was generally performed after the last cycle of CHT.
Target volumes were drawn on each CT image according to ICRU recommendations [Citation2]. Two CTVs were commonly delineated in all patients: a high-risk CTV including the GTV, with a margin accounting for subclinical extension, and a low-risk CTV encompassing the high-risk CTV and all uninvolved cervical nodal levels, usually excluding submandibular regions. An intermediate-risk CTV, including the high-risk CTV, was also contoured in selected cases.
To account for set-up uncertainties, PTVs were generated by adding a 3 mm margin to corresponding CTVs. PTV margins were reduced to 1 mm close to nervous OARs with higher priority than target coverage, i.e. spinal cord, brainstem, optic pathways. A symmetric margin of 5 mm and 2 mm was added to spinal cord and brainstem respectively, to generate corresponding PRVs. The reason for this difference is related to the distance between PTV and these organs: PTV is often closer to brainstem than spinal cord. In our protocol we decided to use a smaller margin for brainstem, thus accepting a greater risk of organ damage to obtain better PTV coverage.
Total doses of 50–54 Gy and 66–70 Gy were prescribed to the low-risk PTV and to the high-risk PTV, respectively, with daily fractions of 2 Gy. The intermediate-risk PTV, when defined, received a total dose of 60 Gy at 2 Gy per fraction. The inverse planning module of the Plato system (Plato-ITP Lightning, version 2.6, Nucletron BV, Veendeaal The Netherlands) was used for the first eight patients. The XiO treatment planning (CMS INC) was employed in all the other cases. IMRT was delivered with the “step and shoot” technique, generally using seven coplanar beams extended from skull base to the lower neck. All patients were treated with 6 MV x-rays delivered by an Elekta Precise linear accelerator.
Clinical imaging protocol and set-up error measurements
Two orthogonal DRRs obtained from the treatment planning software, with a field size of 10 × 10 cm2, gantry angle of 0° (anterior) and 90° (lateral), were transferred to the treatment unit as reference images.
To verify patient set-up, two orthogonal EPIs at the same gantry angles were acquired at the treatment machine using an amorphous silicon (a-Si) flat panel imager (iView-GT, Elekta, Crawley, UK) before treatment.
Each EPI was obtained using the double exposure technique: the first image was acquired with exposure at open-field size 20 × 20 cm2 at the isocenter. A second exposure was then acquired at the isocenter with a reduced area of 10 × 10 cm2. Four monitor units (MU) were delivered for each field, in order to balance image quality against patient cumulative exposure.
The iView software allowed a semi-automatic match between DRR and the portal image. The field edges had first to be outlined on both images and the edges drawn on the verification image had to be projected onto the reference one, in order to establish a relationship between the two images, then bony structures were drawn on both images. Manual adjustment was finally performed by means of translations and rotations.
Anatomic reference landmarks included at least two well visible bony structures: external mandible profile, nasal septum, maxillary sinus and the spinous process of one of lower cervical vertebrae were generally used for the anterior images, while internal and external mandible profiles, skull base and cervical vertebral bodies, i.e. C2 and C4, were usually outlined on the lateral images ( and ).
Figure 1 a. Example of bony structures outlined on the anterior reference image (DRR). b. Example of bony structures outlined on the lateral reference image (DRR).
Bony structures were first considered all together; then, only vertebral bodies perfectly aligned with respect to mandible or maxilla were considered for matching, due to their negligible motion among one another. The images were analyzed by two radiation oncologists adequately trained to reduce inter-observer variability.
After image registration, displacement errors were recorded as translational deviations of the isocenter along the three axes: left-right (L-R), superior-inferior (S-I) and anterior-posterior (A-P). Superior, left and posterior displacements were defined as positive values, whereas inferior, right and anterior displacements were defined as negative.
Measurement of set-up errors was performed at least three times during the first week of treatment and on a weekly basis thereafter. When treatment isocenter changed, generally at the sixth or seventh week, due to the sequential treatment of PTVs, EPIs were acquired and assessed at least twice a week. Images were matched on-line during the first week, off-line thereafter. In case of displacement exceeding 3 mm along one direction, the linac couch was adjusted to match the treatment isocenter and new EPIs were acquired.
In this study we considered interfractional set-up errors only, while intrafractional errors and organ motion were not assessed.
Phantom studies: Evaluation of set-up error accuracy
The major drawback of this 2D-technique is the failure to incorporate out-of-plane rotations due to misalignment of the patient on the couch or of the electronic device. These out-of-plane rotations cause deformations on the images and affect registration accuracy. Limited sampling resolution of imaging systems also contributed to this phenomenon [Citation8]. For this reason, in the first period of IMRT delivery to NPC patients, phantom studies were simultaneously performed, to better characterize EPID.
Measurement reliability of the dimension of various objects and of their relative distance was first tested by a geometric Plexiglas phantom containing a set of radio-opaque markers (Iso-Align, MED-TEC). Anterior and lateral (0, 90 and 270 gantry angles) EPIs of the geometric phantom were acquired.
Subsequently, an anthropomorphic head phantom (Nuclear Associate RMI) was used to reproduce patient set-up procedure. The same immobilization mask adopted for the patient was also employed for the head phantom. CT scanning of the phantom was performed by adopting the same clinical protocol. Anterior and lateral EPIs of the phantom were acquired applying translations of 5 mm from the isocenter by moving the treatment couch in all directions.
Before phantom irradiation, the reading positions of the treatment couch were checked, thus obtaining an accuracy of 1 mm. The same anatomical structures selected for patients were also used for phantom image registration. As regards S-I direction, a one-sample t-test was used to compute the p-value for bias of the displacements obtained from anterior and lateral EPIs [Citation9].
In order to analyze observers’ behaviour during manual delineation of anatomical structures and image matching, the registration of phantom images without isocenter translation was repeated, separately, five times by the same two physicians who subsequently performed all patient image registrations. Deviations measured with the phantom were compared using Pearson product-moment correlation [Citation10].
Systematic and random set-up errors
Values of systematic and random set-up error were calculated according to the definitions reported by Bijhold and De Boer [Citation11,Citation12]. The systematic set-up error for each direction and for each patient was calculated as the mean of all displacements recorded during treatment. The population mean set-up error was the average of all patients’ means, while the population systematic error (Σ) was expressed as the standard deviation (SD) of the patient systematic errors. The random error for each direction and for each patient was the SD of the patient set-up error. The population random error (σ) was the root mean square of the average of all individual SDs [Citation12].
Time trends
Displacement distribution in A-P, S-I, and L-R directions was determined throughout the seven weeks of RT for the whole cohort of patients. The Kruskal Wallis rank test was used to define whether the differences of the displacements measured during the treatment course were statistically significant on a weekly basis.
Since weight loss may represent a source of set-up error, and its frequency and grade constantly worsen during RT [Citation13], we also sought a possible correlation between pertinent acute toxicity and spatial displacement. In order to further investigate these displacements, a cut-off threshold of 2.5 mm was established, which corresponds to a statistically representative observation group (15–20% of the whole data cohort) and is only slightly lower than 3 mm considered for PTV margin.
Patients were clinically monitored on a weekly basis and toxicity was recorded according to the Common Toxicity Criteria Adverse Events, version 3.0, scoring system: Grade 1 (G1) toxicity represents weight loss ranging from 5 to 10%, while Grade 2 (G2) weight loss greater than 10% of the initial body weight [Citation14].
A one-sample t-test was used to evaluate the p-values for bias of the mean displacements between G2 toxicity group and the entire group of observations.
Retrospective evaluation of PTV and PRV margins
The CTV-PTV margin was determined according to the equation described by Stroom et al. [Citation15], which accounts for both population systematic and random set-up errors by means of the following equation: margin=2Σ + 0.7 σ. The criterion is that more than 99% of the CTV receives at least 95% of the prescribed dose. The estimation was performed in all directions.
The OAR-PRV margins for brainstem and spinal cord were calculated according to the report by McKenzie et al. [Citation16]. As regards brainstem we used the original equation for serial OARs, which suggests a margin of 1.3 Σ + 0.5 σ, since it derives from a one-dimensional solution. By contrast, the three dimensional solution proposed by the same authors who had suggested a systematic margin of 2.5 Σ + 0.5 σ was used for spinal cord, which is surrounded by the PTVs in case of irradiation to NPC. The criterion was that the mean position of the edge of the OARs in any direction would be completely encompassed by this margin in 90% of cases [Citation16].
Results
Electronic portal imaging performance and registration accuracy
Anterior and both lateral (0, 90 and 270 gantry angles) portal images of the Iso-Align phantom were acquired using a double exposure technique: the position of the radio-opaque markers delineated the dimensions of both fields size at any angle. No image deformations were observed and relative distance errors between markers ranged within pixel size of approximately 0.5 mm.
The comparison among the anthropomorphic phantom EPIs, acquired after known shifts had been applied, with the phantom DRR, showed a mean displacement less than 1 mm for every shifts: 0.3 ± 1.2 mm in the L-R direction, −0.4 ± 1.1 mm in the S-I direction (considering mean values between anterior and lateral EPI) and −0.7 ± 0.3 mm in the A-P direction.
No significant differences were observed among S-I displacements measured from anterior and lateral EPIs (0.0 ± 1.4 mm by A-P projection and −0.7 ± 0.7 mm by L-R projection; p-value>0.05).
As regards observers’ behaviour during contouring and image registration, the comparison between the deviations reported by the two physicians showed a weak correlation coefficient for the L-R and A-P directions, which represented translations in the transverse dimension, X EPI axis (−1.5 ± 0.8 mm vs. 0.8 ± 0.4 mm; R=–0.36, p=0.06), while no correlation was observed for the S-I direction, which represented the Y EPI axis (0.2 ± 1.0 mm vs. 0.1 ± 0.6 mm; R=0.05, p=0.72). No significant evidence for bias between the two radiation oncologists was observed.
Isocenter set-up error analysis
Two and three PTVs were defined in 14 (70%) and six (30%) patients, respectively. Fourteen changes of treatment isocenter were planned for ten (50%) patients.
Six-hundred-and-eighty-two EPIs (341 anterior, 341 lateral) were obtained for all patients, 104 (15.2%) were acquired after couch adjustment and were not included in this study. Five-hundred-and-seventy-eight images were analyzed (289 anterior, 289 lateral) with a mean of 29 images for each patient (range 22–36). One-thousand one-hundred-and-fifty-six displacements were measured, 289 in each direction.
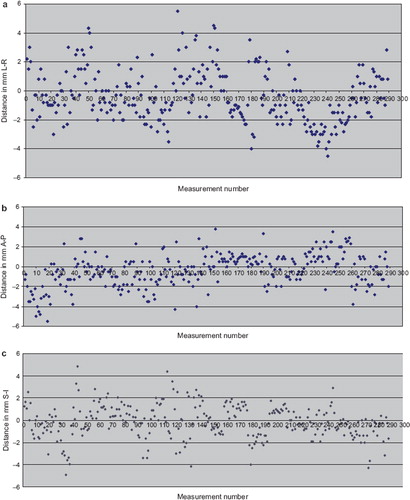
The distribution of all set-up displacements measured both in anterior and lateral EPIs are shown in . After phantom data analysis S-I displacements, for all patients, were analyzed considering the average of values obtained from anterior and lateral EPIs. Maximum displacements for the entire data set were 5.5 mm both L-R and A-P directions and 4.9 mm S-I direction.
Figure 2. Set-up error displacements distributions obtained by two orthogonal images: anterior projection (EPI 0) and lateral projection (EPI 90). a) left-right direction; b) anterior-posterior direction and c) superior-inferior direction (mean values of the displacements measured by both EPI 0 and 90).
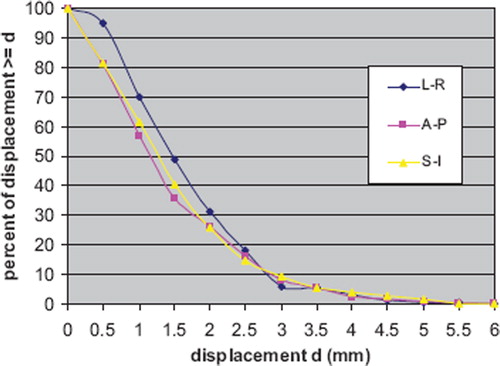
The absolute frequency distributions greater than a fixed value for the three directions are displayed in . In particular, about 15–18% of displacements were ≥ 2.5 mm and about 6–9% were ≥ 3 mm.
Figure 3. Graph depicting the absolute set-up error frequency of all patients. The diamonds represent the number of patients who showed a displacement greater than or equal to a set value.
Systematic and random errors
The L-R, S-I and A-P systematic errors for each patient are displayed in . Error bars indicate one SD. Patient systematic error was less than 1 mm in 60–70% of patients for all directions. Patient systematic errors varied from 0 to 3.1 mm (SD: 0.5–2.2 mm), from 0.2 to 3.1 mm (SD: 0.3–2 mm) and from 0 to 2.2 mm (SD: 0.6–2.6 mm) in L-R, A-P and S-I directions, respectively. Consequently, Σ were 1.3 mm in L-R, 1.0 mm in S-I and 1.1 mm in A-P directions; while σ were 1.3 mm, 1.5 mm and 1.3 mm in L-R, S-I and A-P directions, respectively.
Figure 4. Graphs showing the mean ± 1 SD (error bar) systematic error per patient in the (a) left-right, (b) anterior-posterior and (c) superior-inferior direction.
Time trends
No statistically significant displacement time-trends were reported by Kruskal Wallis analyses in all directions during treatment course (p>0.05). Considering only the observation group with discrepancies ≥ 2.5 mm for all directions, we observed that these were more numerous during the first week than later, as reported in . As regards A-P direction, frequency increased in the sixth and seventh week after four weeks in which it had gradually decreased. This trend was not found for S-I and L-R directions ().
Table I. Number and frequency of displacements superior than 2.5 mm along the three directions.
After treatment completion ten patients (50%) reported G1 and the remaining ten (50%) had G2 weight loss. Percentage of patients with G2 toxicity progressively increased during RT reaching 10% at fifth week, 35% at sixth week, and 50% at the end of seventh week. A small subgroup (4/20) experienced displacements exceeding 3 mm, with a high frequency (15–20%): three of them had bulky nodal disease at the beginning of RT, which decreased with treatment. Furthermore, three patients experienced G2 toxicity at fourth week in one case (an obese man) and at sixth and seventh week for the other two cases respectively. The remaining patient without G2 toxicity showed tension due to uneasiness towards RT. These may all be factors potentially contributing to explain the magnitude and frequency of displacements.
Considering the whole cohort of observations, we compared displacement values observed in weeks with G2 toxicity (37/289) with all the other values (252/289): a t-test between the two groups showed a significant difference only in A-P direction (p=0.03), as reported in .
Table II. Comparison between all displacements recorded during the weeks in which Grade 2 weight loss occurred and all other observations.
The comparison of all displacements observed between G1 (148 observations) and G2 weight loss groups (141 observations) showed a significant difference between mean values for both A-P (p<0.0001) and S-I (p<0.004) directions but not for L-R direction ().
Table III. Comparison between displacements recorded in patients with Grade 2 and Grade 1 toxicity.
Retrospective evaluation of PTV and PRV margins
The results obtained for population systematic and random error allowed margins estimation for our treatment protocol. Margin from CTV to PTV should be at least 3.4 mm in the L-R direction, 3.0 mm in the S-I direction and 3.2 mm in the A-P direction, respectively. PRV margins obtained for brainstem were 2 mm, 2.3 mm and 2.1 mm in S-I, L-R and A-P directions, respectively, while for spinal cord were 3.8 mm, 3.5 mm and 3.2 mm in L-R, A-P and S-I directions, respectively.
Discussion
Isocenter set-up errors
Several studies have evaluated set-up accuracy in head and neck cancer patients. Results varied substantially with regard to tumour site, treatment techniques, fixation devices, imaging and registration techniques, accessories and types of measured set-up errors [Citation17–21].
In a comprehensive review regarding set-up verification using portal imaging, Hurkmans et al. [Citation22] concluded that a SD of 2 mm or less for both random and systematic set-up errors can be considered as “the state of the art” with currently available positioning equipment.
In our study, daily set-up variations were examined in a homogeneous patient population treated with conventional thermoplastic mask immobilization, 2D-alignment techniques and EPID-based imaging. In order to evaluate our results from the proper perspective, we only reported and discussed those studies addressing non invasive immobilization devices, conventional alignment techniques, EPID system and investigating both systematic and random set-up errors in at least two spatial directions [Citation6,Citation17,Citation19–21] ().
Table IV. Selected studies of set-up errors in head and neck region
De Boer et al. [Citation6] reported the use of a transparent polyvinyl chloride (PVC) mask attached with two fixation points only to both sides of the head, while Bel [Citation17] described two different types of immobilization systems. In the former, a non-customized head and neck support was curved in one direction and the PVC cast was fixed with two lateral flaps. In the latter, the head and neck support was curved in two directions and the PVC mask was fixed with a third cranial flap.
In our study we used a customized thermoplastic mask with four fixation points without any base plate attachment to the couch of the linac. This method was quite similar to the “standard” head and neck support used by van Lin [Citation20]. In his report random and systematic errors were both reduced by replacing a standard head and neck support system with a customized one.
Fixation of the base plate to the treatment couch may reduce set-up errors, as reported by Bentel [Citation18]: this facilitates set-up reproducibility, while avoiding patient misalignment on the table, which causes out-of-plane rotations. This is probably the reason for smaller set-up errors reported by Humphreys et al. [Citation19].
Image registration accuracy
A potential bias in the interpretation of data concerning set-up errors, lies in the difficulty to discriminate between actual and observer-related set-up errors. The observer may in fact register portal images with corresponding DRRs based on a specific anatomic landmark lying at a given depth in the patient, different from that of the isocenter [Citation8]. Other drawbacks to achieve an accurate matching between DRR and portal image are due to the fact that the two images are acquired with different beam energies and due to the manual contouring of anatomical landmarks without a thresholding operation of the gray levels [Citation4].
We analyzed these problems by means of phantom studies: in the first place, no deformations were observed in a geometrical phantom; registration accuracy of EPI with respect to DRR was then analyzed with the anthropomorphic phantom reproducing the maximal translations (displacements of 5 mm in every directions) typically found in clinical treatments. In all cases, after matching, mean displacement between estimated and real isocenter was about 1 mm. Considering clinical data, displacements smaller than 1 mm were about 38–52% in all directions, while about 20% were ranged between 2 mm and 3 mm, translations were probably caused by patient's movements inside the mask and their misalignment in the linac couch.
Phantom studies were used also to analyse observers’ behaviors during contouring and matching procedures. For both radiation oncologists, the greatest differences were observed during registration of the anterior images: this was probably due to the presence of overlying bones in anterior EPI, which made contouring difficult and produced a poor alignment. The same results, probably for the same reason, were found in the clinical setting: the absolute displacement frequency distributions showed a slower decline along L-R direction (transverse direction in anterior EPI) up to 2.5 mm, as compared with the other ones.
Time trends
Investigation of set-up error displacements during fractionated RT showed no significant changes as the therapy progressed throughout the seven weeks of treatment. As reported in , displacements exceeding 2.5 mm were particularly numerous during the first week. This was probably due to two main reasons: a) slightly alignment differences among CT simulation, conventional simulation and linac wall-mounted lasers systems; b) movements of the patient within the immobilization mask, due to patient's emotional conditions during the first days of treatment.
In this patient group, too, increased deviations ≥2.5 mm were found at sixth and seventh week of RT, only in the A-P direction, probably because of treatment isocenter modifications, among subsequent PTVs. Furthermore, in those weeks, many patients experienced G2 toxicity.
The issue was further investigated considering the patient group with G2 toxicity only when this adverse event occurred, ignoring the displacement threshold of 2.5 mm (37 observations) and the remaining group (252 observations): the difference in displacement distribution was statistically significant again only for A-P direction, as reported in .
When considering the whole group of patients experiencing G2 toxicity during the entire course of RT (141 observations), as compared with respect to the remaining patient group (148 observations), the difference in displacement distribution was statistically significant also along S-I direction ().
The difference between the two populations, described in , is probably detectable only along S-I and A-P directions because, due to weight loss, patients may slide along the head-holder. As regards L-R direction, the t-test was not significant probably because anatomical landmarks may hardly be identified in anterior images, as observed above.
As reported in the literature, weight loss and nodal tumour shrinkage over time usually reduce neck thickness; these are the most important factors responsible for significant anatomical changes negatively affecting IMRT plan efficacy [Citation13,Citation23]. This phenomenon was particularly observed in the smaller group of patients who experienced displacements larger than 3 mm with high frequency.
In the light of the above, patient set-up must strictly be checked, when G2 weight loss and tumour nodal shrinkage occur.
However, errors due to anatomical changes should be distinguished from those due to inadequate set-up. Mc Dermott et al. [Citation24] found that “difference images” created by subtracting the first localization image from that of subsequent fractions were an efficient way to qualitatively detect anatomical changes during RT. The introduction of image guidance techniques (especially kV cone beam CT) will probably permit to separate patient positioning uncertainties from anatomical changes due to weight loss and tumour or nodal shrinkage [Citation13,Citation23].
Retrospective evaluation of PTV and PRV margins
As regards CTV to PTV margins, by using Stroom equation, the results indicated that they might be slightly larger than our previous choice, especially along L-R direction (3.4 mm). As regards OARs the estimated margins for spinal cord widely guarantee organ saving, while for brainstem a larger margin was obtained especially, again, along L-R direction (2.3 mm). Based on our study results, we had to decide whether to increase CTV to PTV and brainstem margins, or to increase EPIs acquisition frequency, in order to reduce set-up errors [Citation6,Citation20]. As regards brainstem, we maintained 2 mm margin to guarantee PTV coverage accepting a higher risk of organ damage, as described above. As far as the CTV to PTV margin is concerned, our experience showed that for these patients group a 3 mm margin in each direction allowed to encompass over 90% of all positioning errors (94% in the L-R direction, 94% in S-I direction and 93% in the A-P direction). For this reason we decided to maintain our previous choice, but to increase EPIs acquisitions, especially when PTV isocenter changes and important patients anatomical modifications occur, as we observed after our time trends analyses.
Conclusion
The analysis of our data allowed us to evaluate margins extension to guarantee, with sufficient accuracy, coverage of PTVs and sparing of OARs in NPCs treated with IMRT. Overall, our results were comparable with those reported in the literature. We acknowledged in our study the shortcomings of adopting a 2D alignment methodology, which prevents detection of out-of-plane rotations and anatomical changes. This might be the reason why no well defined trend was observed in set-up discrepancies as a function of time. The recent diffusion of 3D imaging techniques will probably help us distinguish these two kinds of limitations, thus improving treatment position accuracy.
However, collected data confirmed the need for a strict monitoring of patient set-up in case of isocenter change due to sequential PTVs definition and in the presence of significant weight loss and/or tumor shrinkage.
Declaration of interest: The authors report no conflicts of interest. The authors alone are responsible for the content and writing of the paper.
Related Research Data
References
- Lee AW. Nasopharyngeal cancer: Advances in radiotherapy. Int J Radiat Oncol Biol Phys 2007;69:S115–7.
- ICRU report 62, Prescribing, recording and reporting photon beam therapy (supplement to ICRU report 50). Bethesda;1999.
- van Herk M, Remeijer P, Rasch C, Lebesque JV. The probability of correct target dosage: Dose-population histograms for deriving treatment margins in radiotherapy. Int J Radiat Oncol Biol Phys 2000;47:1121–35.
- Asvestas PA, Delibasis KK, Mouravliansky NA, Matsopoulos GK. ESTERR-PRO: A set-up verification software system using electronic portal imaging. Int J Biomed Imaging 2007;2007:61523.
- Kruse JJ, Herman MG, Hagness CR, Davis BJ, Garces YI, Haddock MG, . Electronic and film portal images: A comparison of landmark visibility and review accuracy. Int J Radiat Oncol Biol Phys 2002;54:584–91.
- de Boer HC, van Sornsen de Koste JR, Creutzberg CL, Visser AG, Levendag PC, Heijmen BJ. Electronic portal image assisted reduction of systematic set-up errors in head and neck irradiation. Radiother Oncol 2001;61:299–308.
- Herman MG. Clinical use of electronic portal imaging. Semin Radiat Oncol 2005;15:157–67.
- Remeijer P, Geerlof E, Ploeger L, Gilhuijs K, van Herk M, Lebesque JV. 3-D portal image analysis in clinical practice: An evaluation of 2-D and 3-D analysis techniques as applied to 30 prostate cancer patients. Int J Radiat Oncol Biol Phys 2000;46:1281–90.
- Hong TS, Tome WA, Chappell RJ, Chinnaiyan P, Mehta MP, Harari PM. The impact of daily set-up variations on head-and-neck intensity-modulated radiation therapy. Int J Radiat Oncol Biol Phys 2005;61:779–88.
- Bissett R, Leszczynski K, Loose S, Boyko S, Dunscombe P. Quantitative vs. subjective portal verification using digital portal images. Int J Radiat Oncol Biol Phys 1996;34:489–95.
- Bijhold J, Lebesque JV, Hart AAM, Vijlbrief RE. Maximizing set-up accuracy using portal images as applied to a conformal boost technique for prostatic cancer. Radiother Oncol 1992;24:261–71.
- de Boer HC, van Sornsen de Koste JR, Senan S, Visser AG, Heijmen BJ. Analysis and reduction of 3D systematic and random set-up errors during the simulation and treatment of lung cancer patients with CT-based external beam radiotherapy dose planning. Int J Radiat Oncol Biol Phys 2001;49:857–68.
- Barker JL, Garden AS, Ang KK, O'Daniel JC, Wang H, Court LE, . Quantification of volumetric and geometric changes occurring during fractionated radiotherapy for head-and-neck cancer using an integrated CT/linear accelerator system. Int J Radiat Oncol Biol Phys 2004;59:960–70.
- Trotti A, Colevas AD, Setser A, Rusch V, Jaques D, Budach V, . CTCAE v3.0: Development of a comprehensive grading system for the adverse effects of cancer treatment. Semin Radiat Oncol 2003;13:176–81.
- Stroom JC, de Boer HCJ, Huizenga H, Visser AG. Inclusion of geometrical uncertainties in radiotherapy treatment planning by means of coverage probability. Int J Radiat Oncol Biol Phys 1999;43:905–19.
- McKenzie A, van Herk M, Mijnheer B. Margins for geometric uncertainty around organs at risk in radiotherapy. Radiother Oncol 2002;62:299–307.
- Bel A, Keus R, Vijlbrief RE, Lebesque JV. Set-up deviations in wedged pair irradiation of parotid gland and tonsillar tumors, measured with an electronic portal imaging device. Radiother Oncol 1995;37:153–9.
- Bentel GC, Marks LB, Hendren K, Brizel DM. Comparison of two head and neck immobilization systems. Int J Radiat Oncol Biol Phys 1997;38:867–73.
- Humphreys M, Guerrero Urbano MT, Mubata C, Miles E, Harrington KJ, Bidmead M, . Assessment of a customised immobilisation system for head and neck IMRT using electronic portal imaging. Radiother Oncol 2005;77:39–44.
- van Lin EN, van der Vight L, Huizenga H, Kaanders JH, Visser AG. Set-up improvement in head and neck radiotherapy using a 3D off-line EPID-based correction protocol and a customised head and neck support. Radiother Oncol 2003;68:137–48.
- Yan D, Wong J, Vicini F, Michalski J, Pan C, Frazier A, . Adaptive modification of treatment planning to minimize the deleterious effects of treatment set-up errors. Int J Radiat Oncol Biol Phys 1997;38:197–206.
- Hurkmans CW, Remeijer P, Lebesque JV, Mijnheer BJ. Set-up verification using portal imaging; review of current clinical practice. Radiother Oncol 2001;58:105–20.
- Hansen EK, Bucci MK, Quivey JM, Weinberg V, Xia. Repeat CT imaging and replanning during the course of IMRT for head-and-neck cancer. Int J Radiat Oncol Biol Phys 2006;64:355–62.
- McDermott LN, Wendling M, Sonke JJ, van Herk M, Mijnheer BJ. Anatomy changes in radiotherapy detected using portal imaging. Radiother Oncol 2006;79:211–7.