Abstract
Purpose. To investigate the potential role of incidental heart irradiation on the risk of radiation pneumonitis (RP) for patients receiving definitive radiation therapy for non-small-cell lung cancer (NSCLC). Material and methods. Two hundred and nine patient datasets were available for this study. Heart and lung dose-volume parameters were extracted for modeling, based on Monte Carlo-based heterogeneity corrected dose distributions. Clinical variables tested included age, gender, chemotherapy, pre-treatment weight-loss, performance status, and smoking history. The risk of RP was modeled using logistic regression. Results. The most significant univariate variables were heart related, such as heart heart V65 (percent volume receiving at least 65 Gy) (Spearman Rs = 0.245, p < 0.001). The best-performing logistic regression model included heart D10 (minimum dose to the hottest 10% of the heart), lung D35, and maximum lung dose (Spearman Rs = 0.268, p < 0.0001). When classified by predicted risk, the RP incidence ratio between the most and least risky 1/3 of treatments was 4.8. The improvement in risk modeling using lung and heart variables was better than using lung variables alone. Conclusions. These results suggest a previously unsuspected role of heart irradiation in many cases of RP.
Radiation pneumonitis (RP) remains an important dose-limiting toxicity in thoracic radiotherapy in spite of the recent technological advancements in radiation therapy such as conformal radiotherapy and intensity modulated radiation therapy. The onset of radiation pneumonitis usually occurs within three to six months after conventionally-fractionated radiotherapy with clinical features of dyspnea, cough, fever, or, in severe cases, hypoxia. Many reports attempt to identify potential risk factors and improve risk models [Citation1–21], but progress has been modest [Citation22]. The patient-specific or clinical factors including age [Citation1,Citation15], gender [Citation18,Citation20], weight loss [Citation20], performance status [Citation18,Citation20], tumor position [Citation3,Citation4,Citation14] lung region irradiated [Citation12], mitomycin C use [Citation6], the presence of COPD (chronic obstructive pulmonary disease) [Citation6], and pulmonary function [Citation6,Citation16–19] have been implicated. Dosimetric factors such as mean dose to the lungs (total lung minus the gross tumor volume (MLD)) [Citation1–3,Citation5,Citation7,Citation8,Citation12,Citation14]; V20 [Citation1,Citation3,Citation5]; V30 [Citation1,Citation2]; the effective volume(VEff) [Citation3]; the maximum dose [Citation4]; D35 (minimum dose to the 35% volume receiving the highest dose) [Citation4]; volume of the PTV (more than 200 cm3) [Citation9]; and V5 [Citation11] have been correlated with RP.
In our institutional dataset, we previously identified [Citation4] inferior tumor position (and therefore high dose location) as highly correlated with RP events, also previously reported by Seppenwoolde et al. [Citation7]. Subsequently, modeling was expanded to include RTOG 93-11 data [Citation14] and an overall logistic regression model that included mean dose and tumor position robustly described the data.
The Groningen group studied the effect of combined heart and lung irradiation on post-RT lung function [Citation23–26], and showed that the severity of respiratory dysfunction after partial thoracic radiation is partially governed by an interaction between pulmonary and cardiac functional deficits, where tolerance dose for early lung function damage depends not only on the irradiated lung region but also the concomitant irradiation of the heart, which severely reduces the tolerance of the lung.
We assessed heart related dose variables as well as a broad range of previously extracted lung variables and clinical variables. As shown below, heart-related variable correlations with RP were assessed and were more significant than other lung dose-volume or clinical factors.
Material and methods
Patient cohort
From 1991–2001, 385 patients with non-small cell lung cancer (NSCLC) received a minimum radiation dose of 50 Gy with or without chemotherapy at Washington University/Barnes-Jewish Hospital. We obtained institutional review board approval to review these clinical records and radiation treatment plans. Only patients with recoverable 3D treatment plan archives, treated with 3D conformal radiotherapy, and with greater than six month follow-up (unless RP was observed sooner) were included. In addition, only plans which had Monte Carlo-corrected dose distributions for heterogeneity were included. A few patients were excluded due to poor imaging of the heart. After these exclusions, 209 patients with associated archived treatment plans and corresponding Monte Carlo dose distribution were available for analysis. Clinical parameters such as pneumonitis grade, pneumonitis interval, age, last follow-up date, status at follow-up, pre-treatment weight-loss, use of chemotherapy (neoadjuvant or concurrent), gender, performance status (Karnofsky score [Citation27]), smoking history, and pulmonary function tests were retrieved from our previous study [Citation4] and included in this analysis. summarizes the available clinical variables and patient characteristics.
Table I. Patient characteristics.
Treatment characteristics
All patients were treated based on institutional guidelines or various research protocols from 1991 to 2001. Most patients were treated once per day to a total prescribed dose from 50 to 84 Gy. Fraction size ranged between 1.5 Gy and 2.5 Gy [Citation4]. Treatment plans typically included a course of parallel opposed (anterior-posterior/posterior-anterior) beams followed by a course of off-cord oblique fields. Some patients received neoadjuvant chemotherapy only (n = 39), concurrent chemotherapy only (n = 55), or both (n = 21). Chemotherapy agents and dose prescription varied greatly during the study period, limiting the usefulness of this variable. All treatments were delivered with megavoltage photon beams (6–18 MV) with shaped custom blocks or a multileaf collimator.
Pneumonitis events
Available patient data was reviewed retrospectively for documented RP. All RP events were graded according to a retrospective grading scheme shown in . In this analysis, patients were considered to have clinically significant RP if they required steroid administration or supportive care due to symptoms (Grade ≥ 2) which corresponds to RTOG Grade ≥ 3 (). Patients who were followed for at least six months and who did not meet these criteria were classified as non-RP cases. Median follow-up time was much longer than six months (17.5 months), so this cutoff was not expected to be a significant source of bias. However, our classification may not encompass all potential RTOG grade 3 events such as any cases of severe cough not responsive to narcotics. The patient follow-up period ranged from 1.7 to 113.6 months, with mean and median values of 23 and 17.5 months, respectively. Forty-eight (48) of 209 patients (23%) developed clinically significant pneumonitis requiring medical attention or care. The pneumonitis grade distribution over the whole population is given in . The majority of RP events (39 of 48 patients) occurred in Grade 2 or 3; among the remaining 10 RP events, five were Grade 4 and four were Grade 5. summarizes the basic clinical and treatment variables in patients with and without RP events. Differences in patients with and without RP for each variable were analyzed using the unpaired t-test for continuous variables, or the χ2 test for categorical variables. Among these variables, five were statistically significant: performance status, maximum Monte Carlo dose in lung, mean Monte Carlo dose in lung, maximum Monte Carlo dose in heart, and mean Monte Carlo dose in heart.
Table II. Pneumonitis grading scale.
Table III. Pneumonitis grade.
Table IV. Clinical and treatment parameters in patients with and without RP events (Grade 2 or greater); p-values are computed by the unpaired t-test (continuous variables) or the chi-square test (categorical variables).
Plan data recovery
Treatment plans were recovered from tape archives and imported into our in-house developed treatment plan analysis system, the computational environment for radiotherapy research (CERR) [Citation28].
Structure definitions
Contours corresponding to total lung minus the gross target volume (GTV) were created using CERR scripts. Heart contouring was performed within CERR by a single physician. The center of mass of the GTV was computed using CERR/Matlab scripts such that the linear variable COMSI (center-of-mass-superior-inferior) would theoretically have a value of 1 for a tumor at the most superior edge of the total lung volume, or a value of 0 at the most inferior edge.
Dose calculation
Planned dose distributions were recovered from the archived treatment planning system data and confirmed to be the dose clinically delivered by chart review. Because of the lack of tissue heterogeneity correction in the archived treatment plans, a method was developed for retrospectively correcting dose calculations using Monte Carlo, as described in detail elsewhere [Citation29].
Dose-volume parameters
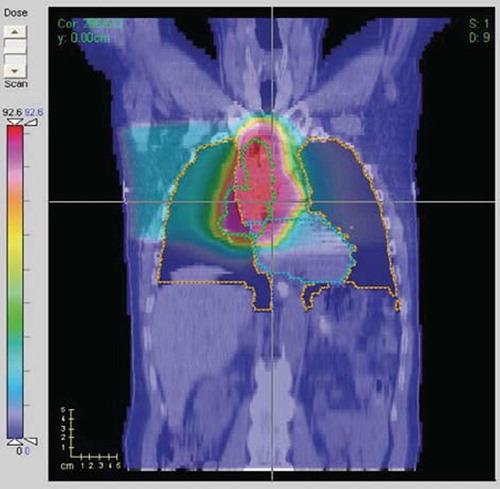
A wide range of dose-volume parameters for heart and total lung (minus the GTV) were extracted for modeling. A plan with significant high-dose overlap of the heart is shown in . Maximum dose was calculated per the International Commission on Radiation Units and Measurements (ICRU) maximum dose definitions, being equal to the minimum dose to the hottest volume of at least 1.5 cm × 1.5 cm × 1.5 cm (i.e. 3.375 cm3). Dx (Gy) was defined as the minimum dose to the x% volume receiving the highest dose; Vx is the percent volume receiving at least x dose; MOHx is defined as the mean of dose values of the hottest x% of the structure; MOCx is defined as the mean of dose values of the coldest x% of the structure. MOHx and MOCx were included as they could potentially be more robust predictors of endpoints than Dx and Vx due to their averaging property.
Figure 1. Coronal view of a treatment plan with a significant high dose overlap with the heart (yellow contour line: whole lung; green contour line: PTV; blue contour line: heart).
Statistical modeling
More than hundred parameters were initially included in the analysis. Dosimetric parameters of whole lung and heart included: D5-100; V5-100; MOH5-100; MOC5-100; all in 5% increments; mean dose, ICRU maximum dose, ICRU minimum dose, and the generalized equivalent uniform dose (with parameter ‘n’ = 0.1, 0.2, 0.5, 1.0, 2.0) [Citation30]. Tumor position parameters derived by the previous study [Citation4] included continuous variables ranged from 0 and 1 along the superior-inferior, right-left, medial-lateral, and anterior-posterior dimensions. Patient parameters included age, gender, race, performance status (Karnofsky score), weight loss (>5%), primary site histology, use of pre-treatment chemotherapy or concurrent chemotherapy, previous pulmonary resection, treatment time, and fraction size. Spearman's rank correlation coefficient (Rs) was employed to assess univariate logistic regression analysis with RP.
After removing redundant variables (i.e., those which have a high correlation to another variable of greater than 0.85 and keeping the variable with the highest correlation to RP) we were left with 26 variables. Models were then constructed on leave-one-out patient cohorts and prediction accuracy was tested on the removed patient. Model order was then selected to maximize the leave-one-out prediction accuracy, as described elsewhere [Citation31,Citation32]. To test the robustness of the final variable sets, forward step variable selection up to the model order was performed on bootstrap data replicates. Model predictive power was quantified using Spearman's rank correlation coefficient and the area under the receiver operating characteristic (ROC) curve. Model calibration was checked by graphically comparing data vs. model risk predictions.
Results
Univariate logistic regression analysis
Univariate logistic regression analysis of the clinical and dosimetric parameters with RP grades were evaluated using Spearman's coefficient. Clinical parameters considered, including Karnofsky performance status, age, and smoking history, were not significantly correlated with RP risk. Mean, median, and range values for representative Dx and Vx variables, for the heart, are listed in . Spearman correlations of RP grades with Dx for lung and heart are shown in ; Spearman correlations with Vx are shown in ; Spearman coefficients with MOHx are shown in . The results in clearly show that dose volume metrics (Dx, Vx and MOHx) associated with heart are more highly correlated with RP grades in comparison with those from lung. The parameters most highly correlated with the incidence of RP are listed in . The corresponding median values of those variables which highly correlated with RP, RP incidence vs. patient population above median value and below median value are also listed in for this population. The results show that patients who received heart radiation dose above the median value developed RP complications at a higher rate than patients below the median value.
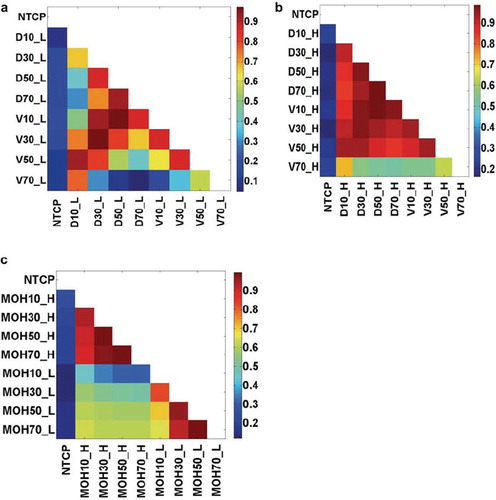
Figure 2. (a) Univariate Spearman's rank correlation of RP events with Dx's of the normal lungs or heart volumes; (b) Univariate Spearman's rank correlation of RP events with Vx's of the normal lung or heart volumes; (c) Univariate Spearman's rank correlation of RP events with ‘MOHx’ of normal lung or the heart. Dx is the minimum dose to the x% volume receiving the highest dose (the peak in the heart curve near a Dx of 5%); Vx is the percent volume receiving at least x dose (in Gy) (the peak in heart Vx near 65–70 Gy); MOHx is mean dose of the hottest x% of a structure.
Table V. Summary of dosimetric statistics of heart DVHs.
Table VI. Highest correlated variables with RP incidence based on univariate logistic regression.
Variable correlations. Strong correlations exist between dosimetric parameters in this dataset, as is commonly reported [Citation13]. Intra-organ dosimetric parameters are strongly correlated, as displayed in (lung) and (heart). However, shows that heart and lung dosimetric variables are less strongly correlated and are therefore not surrogates for each other.
Figure 3. The cross-correlations of intra-organ or inter-organs dosimetric parameters: (a) Dx_Lung vs. Vx_Lung; (b) Dx_Heart vs. Vx_Heart; (c) MOHx_H vs. MOHx_L. Note: NTCP: normal tissue complication probability.
Multivariate risk modeling. A three-variable model was suggested as the optimal order by cross-validation evaluation. Logistic models were constructed using bootstrap datasets. The most frequently selected models within the bootstrapped subpopulations are shown in . The most frequently selected model also had the highest spearman rank coefficient with RP events (1 = RP event, 0 = no event) when applied to the original dataset (Rs = 0.268, p < 0.0001), and included three variables, in order of selection: D10_H (heart D10), D35_L (lung D35) and MaxD_L (maximum lung dose). The best-fitted model parameters, together with the resulting individual 95% confidence intervals (Wald intervals), are given in .
Figure 4. Multivariate model selection bootstrap frequency (MaxD_L: Maximum Lung Dose; ConChemo: Con-current chemotherapy). The variable selection process was done using bootstrap sampling technique. The frequency of model selection is shown for the five most frequently selected models.
Table VII. Model coefficient values and individual 95% confidence intervals (Wald intervals).
The risk of RP is then given by:
where NTCP denotes normal tissue complication probability (all doses are in Gy) and
The spearman's rank correlation coefficient for the model is 0.268 (p < 0.0001).
The comparison of the predicted incidence of RP by this model and the actuarial incidence in the population is shown in . The ratio of RP rates between the 1/3 of patients at highest risk (according to the model) and the 1/3 of patients at lowest risk is 4.8; also majority of patients who developed Grade 4 or 5 RP are in the highest risk group (shown in ). As suggested by Jackson et al. [Citation33], we also report the area under the receiver operating characteristic curve (AUC) (shown in ), which is equal to 0.72. Because mean lung dose (MLD) has often been correlated with RP, we also fitted a model in which it was substituted for the lung variables, D35 and maximum lung dose. The resulting fit was statistically significant but had a slight smaller Rs value than the ‘best’ model (0.247, p < 0.0001). The model parameters are:
Figure 5. Mean predicted rates of RP vs. observed rates for patients binned by predicted risk. The patients are binned according to predicted risk of RP by the three-variable model (heart D10, lung D35, and maximum dose of the lung) with equal patient numbers in each bin. The mean predicted and observed event rates in each bin are (risk; events/pts.): (0.0581; 5/35), (0.1087; 1/35), (0.1671; 6/35), (0.2481; 7/35), (0.3494; 11/35), (0.4568; 18/35).
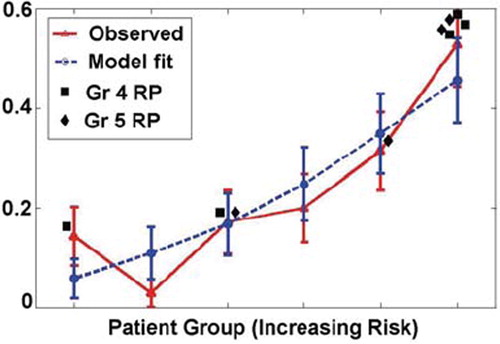
Figure 6. ROC curve based on the best three-variable logistic regression model: heart D10, lung D35, and maximum dose of the lung, with area under the curve (AUC) of 0.72.
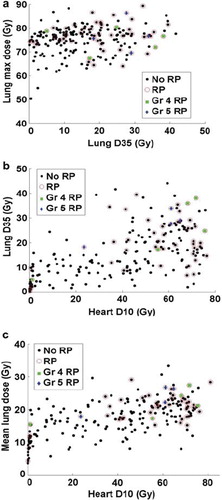
displays scatter plots of the most common parameters (D10_H, D35_L, MaxD_L and MLD) in the most frequently occurring models; the patients who developed Grade 4 or 5 RP have been identified in . For these life-threatening complications, 7/9 occurred at heart D10 levels of greater than 50 Gy.
Figure 7. Scattering plots: a. D35_L vs. and MaxD_L; b. D10_H vs. D35_L; c. D10_H vs. MLD.
Discussion
Heart variables are dominant statistical factors in this dataset
The accurate assessment of RP risk after thoracic radiation therapy is an important, yet difficult step in treatment planning. Understanding RP risk is critical for safe dose-escalation studies in NSCLC. Currently, there is no clear image of the biologic mechanism leading to RP [Citation34]. Chemotherapy, whether given before or during therapy, was not found to be a predictive factor. However, we do not have detailed records of chemotherapy agents and doses, which varied significantly. Most previous studies have been concentrated on one or more clinical, dosimetric parameters of whole lung, or position-dependent factors. Inspired by reported rat study results [Citation23–26] showing that heart damage due to irradiation enhancing early radiation-induced lung function loss, we incorporated both heart and lung irradiation factors in the current study. The results shown in , and indicate that heart variables are more predictive of pneumonitis in this dataset compared to all other variables tested.
Lung dose volume factors only make small improvements to risk modeling when added to heart factors
The best multivariate model using only heterogeneity-corrected lung dose volume metrics and clinical factors resulted in a two-variable model including D35_L, and MaxD_L (maximum lung dose) (Rs =0.201 p < 0.001). By adding heart dose volume variables into the modeling, the best multivariate model was: D10_H, D35_L, and MaxD_L with spearman coefficient improved from 0.201 to 0.268. It shows that heart variable (D10_H) is a significant factor to predict the RP risk in addition to lung variables (D35_L and MaxD_L).
Three scatter plots, (D35_L vs. MaxD_L), 7b (D10_H vs. D35_L) and 7c (D10_H vs. MLD), are shown to clarify the relationship between heart variables as predictors and other risk factors in the best logistic model. The plots demonstrate that newly identified heart dose volume variables D10_H is superior to previously identified lung dose volume variables (D35_L, V20_L, MLD, and MaxD_L) and seems to assign patients to high or low risk more effectively than these lung dose variables. Note that in and , some RP events have low values along both x- and y-axes, but these events are apparently related to relatively high maximum lung doses (see ).
The improvement over previous models is given in . The current model improves the Spearman coefficient from Rs = 0.17 (using only mean lung dose), to Rs = 0.173 (using only V20_L), to Rs = 0.201 (D35_L plus maximum lung dose), to Rs = 0.268 (current model) on leave-one out analysis.
Table VIII. Model performance comparison on institutional dataset (all variables had positive coefficients).
Heart variables are not simply surrogates for lung variables
The intersection of lung contours and heart contours was computed for all patients and shown to be negligible. Thus, heart volumes did not overlap with normal lung volumes. The variable correlation plots shown in indicate that, although dose volume variables among each structure (lung or heart) show strong correlations (e.g., Rs between D10_heart and mean heart dose is 0.93), correlations between lung and heart variables are weaker (e.g., Rs between the mean lung dose and D10_heart is 0.60), supporting the contention that heart dose-volume variables are not simply surrogates for previously reported lung or positional variables. This is further supported by and showing that heart variables actually stratify the results more clearly than the result from (with lung dose volume variables only).
This paper establishes the statistical importance of heart irradiation in the framework of univariate correlations and multivariate logistic modeling. More sophisticated machine learning approaches provide the potential for more predictive modeling (for example, AUC values > 0.8 [Citation35]. However, these ‘black box’ models generally have many input variables interacting nonlinearly, and are therefore difficult to understand [Citation35–37]. The emphasis in this work has been on establishing the potential importance of heart irradiation, rather than attempting to optimize a complicated predictive model.
Are these results generalizable to other patient populations?
The study has been conducted on our institutional patient population. As pointed out in previous studies [Citation4,Citation14], the results might be dependent on our institutional methods of treating NSCLC including beam arrangements, prescriptions, patient setup, tumor staging, as well as other technical factors whose effects might be hard to capture. Fraction size details are also not included, as the typical treatment combined two courses of differing beam arrangements (AP-PA followed by oblique beams), and the dose distributions for the individual courses are not available.
The primary value of this model building investigation is hypothesis generation, by observing how different factors still appear statistically important in a multivariate setting after the inclusion of heart variables. Clearly, the ‘best’ variables (heart D10, lung D35, and maximum dose of lung) are surprising given previous reports using mean lung dose or various Vx values as predictors [Citation22]. The appearance of maximum dose in the model may potentially be related to bronchial stenosis, reported to occur in high dose volumes [Citation38,Citation39]. Some cases of RP seem better related to maximum lung dose than other heart or lung variables (see ). Our previous experience modeling RP based only on lung variables also identified D35 and maximum lung dose as predictive factors [Citation4]. However, the effect was not generalizable to another patient population, as demonstrated when we performed combined modeling with RTOG 93-11 data [Citation14]. Based on this experience, and the resulting usefulness of mean dose in modeling that combined dataset, we also fitted a lung mean dose model (Equation 3), which may generalize better to a wider patient population. Future work should also include further anatomical segmentation of the heart into sub-structures.
Conclusion
This study is the first to show an important correlation between heart dosimetric variables and the incidence of pneumonitis. The potential biological mechanism of this effect remains unclear. The clinical meaning of heart irradiation as a risk factor remains obscure, and further work, including tests with other patient populations, will be necessary to further clarify this effect. Although heart irradiation appears to be an important risk factor, it is very likely that the ‘best’ model for predicting RP from dosimetric variables is yet to be developed.
Acknowledgments
This research was supported by NIH grant R01 CA85181. These results were originally reported at the 50th ASTRO meeting, September 21–25, 2008. The authors declare that there are no potential conflicts of interest associated with this work.
Declaration of interest: The authors report no conflicts of interest. The authors alone are responsible for the content and writing of the paper.
Related Research Data
References
- Claude L, Perol D, Ginestet C, Falchero L, Arpin D, Vincent M, . A prospective study on radiation pneumonitis following conformal radiation therapy in non-small-cell lung cancer: Clinical and dosimetric factors analysis. Radiother Oncol 2004;71:175–81.
- Fay M, Tan A, Fisher R, Mac Manus M, Wirth A, Ball D. Dose-volume histogram analysis as predictor of radiation pneumonitis in primary lung cancer patients treated with radiotherapy. Int J Radiat Oncol Biol Phys 2005;61:1355–63.
- Graham MV, Purdy JA, Emami B, Harms W, Bosch W, Lockett MA, . Clinical dose-volume histogram analysis for pneumonitis after 3D treatment for non-small cell lung cancer (NSCLC). Int J Radiat Oncol Biol Phys 1999;45:323–9.
- Hope AJ, Lindsay PE, El Naqa I, Alaly JR, Vicic M, Bradley JD, . Modeling radiation pneumonitis risk with clinical, dosimetric, and spatial parameters. Int J Radiat Oncol Biol Phys 2006;65:112–24.
- Jenkins P, D'Amico K, Benstead K, Elyan S. Radiation pneumonitis following treatment of non-small-cell lung cancer with continuous hyperfractionated accelerated radiotherapy (CHART). Int J Radiat Oncol Biol Phys 2003;56:360–6.
- Rancati T, Ceresoli GL, Gagliardi G, Schipani S, Cattaneo GM. Factors predicting radiation pneumonitis in lung cancer patients: A retrospective study. Radiother Oncol 2003;67:275–83.
- Seppenwoolde Y, De Jaeger K, Boersma LJ, Belderbos JS, Lebesque JV. Regional differences in lung radiosensitivity after radiotherapy for non-small-cell lung cancer. Int J Radiat Oncol Biol Phys 2004;60:748–58.
- Seppenwoolde Y, Lebesque JV, de Jaeger K, Belderbos JS, Boersma LJ, Schilstra C, . Comparing different NTCP models that predict the incidence of radiation pneumonitis. Normal tissue complication probability. Int J Radiat Oncol Biol Phys 2003;55:724–35.
- Sunyach MP, Falchero L, Pommier P, Perol M, Arpin D, Vincent M, . Prospective evaluation of early lung toxicity following three-dimensional conformal radiation therapy in non-small-cell lung cancer: Preliminary results. Int J Radiat Oncol Biol Phys 2000;48:459–63.
- Tsougos I, Nilsson P, Theodorou K, Kjellen E, Ewers SB, Jarlman O, . NTCP modelling and pulmonary function tests evaluation for the prediction of radiation induced pneumonitis in non-small-cell lung cancer radiotherapy. Phys Med Biol 2007;52:1055–73.
- Wang S, Liao Z, Wei X, Liu HH, Tucker SL, Hu CS, . Analysis of clinical and dosimetric factors associated with treatment-related pneumonitis (TRP) in patients with non-small-cell lung cancer (NSCLC) treated with concurrent chemotherapy and three-dimensional conformal radiotherapy (3D-CRT). Int J Radiat Oncol Biol Phys 2006;66:1399–407.
- Yorke ED, Jackson A, Rosenzweig KE, Merrick SA, Gabrys D, Venkatraman ES, . Dose-volume factors contributing to the incidence of radiation pneumonitis in non-small-cell lung cancer patients treated with three-dimensional conformal radiation therapy. Int J Radiat Oncol Biol Phys 2002;54: 329–39.
- Yorke ED, Jackson A, Rosenzweig KE, Braban L, Leibel SA, Ling CC. Correlation of dosimetric factors and radiation pneumonitis for non-small-cell lung cancer patients in a recently completed dose escalation study. Int J Radiat Oncol Biol Phys 2005;63:672–82.
- Bradley JD, Hope A, El Naqa I, Apte A, Lindsay PE, Bosch W, . A nomogram to predict radiation pneumonitis, derived from a combined analysis of RTOG 9311 and institutional data. Int J Radiat Oncol Biol Phys 2007;69:985–92.
- Schild SE, Stella PJ, Geyer SM, Bonner JA, McGinnis WL, Mailliard JA, . The outcome of combined-modality therapy for stage III non-small-cell lung cancer in the elderly. J Clin Oncol 2003;21:3201–6.
- Abratt RP, Willcox PA. The effect of irradiation on lung function and perfusion in patients with lung cancer. Int J Radiat Oncol Biol Phys 1995;31:915–9.
- Marks LB, Munley MT, Spencer DP, Sherouse GW, Bentel GC, Hoppenworth J, . Quantification of radiation-induced regional lung injury with perfusion imaging. Int J Radiat Oncol Biol Phys 1997;38:399–409.
- Robnett TJ, Machtay M, Vines EF, McKenna MG, Algazy KM, McKenna WG. Factors predicting severe radiation pneumonitis in patients receiving definitive chemoradiation for lung cancer. Int J Radiat Oncol Biol Phys 2000;48:89–94.
- Brooks BJ, Jr, Seifter EJ, Walsh TE, Lichter AS, Bunn PA, Zabell A, . Pulmonary toxicity with combined modality therapy for limited stage small-cell lung cancer. J Clin Oncol 1986;4:200–9.
- Hernando ML, Marks LB, Bentel GC, Zhou SM, Hollis D, Das SK, . Radiation-induced pulmonary toxicity: A dose-volume histogram analysis in 201 patients with lung cancer. Int J Radiat Oncol Biol Phys 2001;51:650–9.
- Monson JM, Stark P, Reilly JJ, Sugarbaker DJ, Strauss GM, Swanson SJ, . Clinical radiation pneumonitis and radiographic changes after thoracic radiation therapy for lung carcinoma. Cancer 1998;82:842–50.
- Marks LB, Bentzen SM, Deasy JO, Kong FM, Bradley JD, Vogelius IS, . Radiation dose volume effects in the lung. Int J Radiat Oncol Biol Phys (accepted for publication).
- Novakova-Jiresova A, van Luijk P, van Goor H, Kampinga HH, Coppes RP. Pulmonary radiation injury: Identification of risk factors associated with regional hypersensitivity. Cancer Res 2005;65:3568–76.
- Van Luijk P, Faber H, Meertens H, Schippers JM, Langendijk JA, Brandenburg S, . The impact of heart irradiation on dose-volume effects in the rat lung. Int J Radiat Oncol Biol Phys 2007;69:552–9.
- Van Luijk P, Novakova-Jiresova A, Faber H, Schippers JM, Kampinga HH, Meertens H, . Radiation damage to the heart enhances early radiation-induced lung function loss. Cancer Res 2005;65:6509–11.
- Van Luijk P, Novakova-Jiresova A, Faber H, Steneker MN, Kampinga HH, Meertens H, . Relation between radiation-induced whole lung functional loss and regional structural changes in partial irradiated rat lung. Int J Radiat Oncol Biol Phys 2006;64:1495–502.
- Karnofsky DA, Battista JJ. The clinical evaluation of chemotherapeutic agents in cancer. Evaluation of chemotherapeutic agents, CM MacLeod. New York: Columbia University Press; 1949.
- Deasy JO, Blanco AI, Clark VH. CERR: A computational environment for radiotherapy research. Med Phys 2003; 30:979–85.
- Lindsay PE, El Naqa I, Hope AJ, Vicic M, Cui J, Bradley JD, . Retrospective Monte Carlo dose calculations with limited beam weight information. Med Phys 2007;34:334–46.
- Niemierko A. Reporting and analyzing dose distributions: A concept of equivalent uniform dose. Med Phys 1997;24: 103–10.
- El Naqa I, Bradley J, Blanco AI, Lindsay PE, Vicic M, Hope A, . Multivariable modeling of radiotherapy outcomes including dose-volume and clinical factors. Int J Radiat Oncol Biol Phys 2006;64:1275–86.
- El Naqa I, Suneja G, Lindsay PE, Hope AJ, Alaly JR, Vicic M, . Dose response explorer: An integrated open-source tool for exploring and modelling radiotherapy dose-volume outcome relationships. Phys Med Biol 2006;51:5719–35.
- Jackson A, Marks L, Eisbruch A, Yorke E, Ten Haken R, Bentzen S, . The Lessons of QUANTEC: Recommendations for reporting and gathering data on dose-volume dependencies of treatment outcome. Int J Radiat Oncol Biol Phys (accepted for publication).
- Rubin P, Johnston CJ, Williams JP, McDonald S, Finkelstein JN. A perpetual cascade of cytokines postirradiation leads to pulmonary fibrosis. Int J Radiat Oncol Biol Phys 1995;33:99–109.
- Schiller TW, Chen Y, El Naqa I, Deasy JO. Modeling radiation-induced lung injury risk with an ensemble of support vector machines. Neurocomputing 2010;73:7.
- El Naqa I, Bradley J, Lindsay P, Hope A, Deasy JO. Predicting radiotherapy outcomes using statistical learning techniques. Phys Med Biol 2009;54:S9–S30.
- Das S, Chen S, Deasy JO, Zhou S, Yin FF, Marks L. Combining multiple models to generate consensus: Application to radiation-induced pneumonitis prediction. Med Phys 2008;32:5098–109.
- Miller KL, Shafman TD, Anscher MS, Zhou SM, Clough RW, Garst JL, . Bronchial stenosis: An underreported complication of high-dose external beam radiotherapy for lung cancer? Int J Radiat Oncol Biol Phys 2005;61:64–9.
- Kelsey CR, Kahn D, Hollis DR, Miller KL, Zhou SM, Clough RW, . Radiation-induced narrowing of the tracheobronchial tree: An in-depth analysis. Lung Cancer 2006;52:111–6.