Abstract
Background. Clinical treatment with radionuclides is usually preceded by biokinetic and dosimetry studies in small animals. Evaluation of the therapeutic efficacy is essential and must rely on accurate dosimetry, which in turn must be based on a realistic geometrical model that properly describes the transport of radiation. It is also important to include the source distribution in the dosimetry calculations. Tumours are often implanted subcutaneously in animals, constituting an important additional source of radiation that often is not considered in the dosimetry models. The aims of this study were to calculate S values of the mouse, and determine the absorbed dose contribution to and from subcutaneous tumours inoculated at four different locations. Methods. The Moby computer program generates a three dimensional (3D) voxel-based phantom. Tumours were modelled as half-spheres on the body surface, and the radius was varied to study different tumour masses. The phantoms were used as input for Monte Carlo simulations of absorbed fractions and S factors with the radiation transport code MCNPX 2.6f. Calculations were performed for monoenergetic photons and electrons, and the radionuclides 125I, 131I, 111In, 177Lu and 90Y. Results. Electron energy and tumour size are important for both self- and cross-doses. If the activity is non-uniformly distributed within the body, the position of the tumour must be considered in order to calculate the tumour absorbed dose accurately. If the uptake in the tumour is high compared with that in adjacent organs the absorbed dose contribution to organs from the tumour cannot be neglected. Conclusions. In order to perform accurate tumour dosimetry in mouse models it is necessary to take the additional contribution from the activity distribution within the body of the mouse into account. This may be of significance in the interpretation of radiobiological tumour response in pre-clinical studies.
Clinical radionuclide therapy studies are commonly preceded by experimental studies on small animals, in order to establish the radiation-related side effects. As in human studies, reliable evaluation of the therapeutic efficacy is essential, and must therefore be based on accurate dosimetry. The MIRD formalism [Citation1,Citation2] for dosimetry calculations provides a general description of the energy emitted from a source volume s and its absorption in different target volumes t. The practical use of this formalism often involves pre-calculated S values that describe the absorbed dose to a target per disintegration in the source volume. The average absorbed dose to a target t from a source s could then be expressed as ![]() , where Ãs is the total number of disintegrations in the source. The total absorbed dose is thus a sum from all sources. When the source equals the target (s=t), this is referred to as the “self-dose”, and the opposite (s≉t) is referred to as “cross-dose”. The MIRD formalism can also be applied to pre-clinical studies in animals if animal-specific S values are calculated using a relevant geometrical model of the animal, together with an accurate radiation transport code. For human voxel-based models, the kinetic energy released by electrons is often regarded as being locally absorbed in a single voxel, because of the short path lengths of electrons/beta particles. However, for smaller geometries, such as in the mouse or rat, the range of the electrons will be comparable to the size of the organs, resulting in self-absorption fractions below unity. Thus, the electron cross-doses must be considered. This implies that an accurate absorbed dose calculation based on a realistic geometrical model is necessary for small animal geometries.
, where Ãs is the total number of disintegrations in the source. The total absorbed dose is thus a sum from all sources. When the source equals the target (s=t), this is referred to as the “self-dose”, and the opposite (s≉t) is referred to as “cross-dose”. The MIRD formalism can also be applied to pre-clinical studies in animals if animal-specific S values are calculated using a relevant geometrical model of the animal, together with an accurate radiation transport code. For human voxel-based models, the kinetic energy released by electrons is often regarded as being locally absorbed in a single voxel, because of the short path lengths of electrons/beta particles. However, for smaller geometries, such as in the mouse or rat, the range of the electrons will be comparable to the size of the organs, resulting in self-absorption fractions below unity. Thus, the electron cross-doses must be considered. This implies that an accurate absorbed dose calculation based on a realistic geometrical model is necessary for small animal geometries.
Several mathematical phantom models for mouse dosimetry have been presented. In 1994, Hui et al. [Citation3] presented a geometrical mouse model, based mainly on ellipsoids, developed from 10 athymic mice with body weights of about 25 g, while Yoriyaz et al. [Citation4] described a geometrical model for a 30 g mouse. Muthuswamy et al. [Citation5] extended the model developed by Hui [Citation3] by including bone marrow compartments. The model presented by Flynn et al. [Citation6] in 2001 was based on ellipsoids and cylinders, and included a more realistic model of the kidneys separated into the cortex and medulla and a spherical tumour separated into a vascular rim and a necrotic core. Hindorf et al. [Citation7] also developed a voxel-based mouse phantom (24 g) based on combinations of cylinders and ellipsoids, and investigated the influence of organ anatomy and location on the calculation of the absorbed dose. Kolbert et al. [Citation8] developed a more anatomically realistic voxel-based model derived from MR images in which the left and right kidneys, liver and spleen were segmented. In 2006, Stabin et al. [Citation9] presented a realistic voxel-based model of a 27 g mouse in which 10 organs were segmented from micro-CT images.
Several of the mouse models described above were developed from CT or MR studies of the animals, where the geometry is represented by voxels in three dimensional (3D). Often, each voxel value is coded to represent a particular organ or structure. Although these models can be very accurate, they still represent an individual specimen, and the possibility of modifying the internal structures in terms of organ size and location is very limited. The development of hybrid phantoms based on deformable surfaces [Citation10] allows organ sizes and positions to be altered and organ masses to be changed, while maintaining a realistic geometry. This kind of mouse phantom can thus be used to generate versions that represent a population of mice, and could therefore be of much use in the field of dosimetry. The Moby phantom, developed by Segars et al. [Citation11], is an example of such a hybrid phantom which was originally developed for the evaluation and optimisation of small-animal imaging, but is also useful for pre-clinical dosimetry studies. This realistic phantom is based on non-uniform, rational B-spline surfaces, and the geometry was developed from a segmented C57BL/6 mouse weighing 33 g. These surfaces allow for flexibility in the shapes of the organs, allowing heart motion and respiratory motion to be modelled. Thirty-six regions (including eight heart regions, seven brain regions and three skeletal regions) are segmented. The phantom is software-controlled by a user-modified parameter file, and generates two sets of 3D voxel-based images with the specified matrix size of the activity and the attenuation in the mouse, which then serves as input for electron/photon Monte Carlo dosimetry calculations. In a previously published study by Larsson et al. [Citation12] Monte Carlo methods were used to calculate organ S factors using the Moby mouse phantom. Keenan et al. [Citation13] have also presented S factors based the Moby phantom, but for mice weighing 25 g, 30 g and 35 g.
In many pre-clinical radionuclide therapy studies, tumours are inoculated subcutaneously. Bitar et al. [Citation14,Citation15] presented a detailed model based on a female athymic nude mouse weighing approximately 30 g, in which a 100 mg tumour was induced on the right flank. If there is a significant amount of the radiopharmaceutical in the tumour, the energy emitted from the tumour can then add to the absorbed dose in adjacent organs, due to the short distances.
The objectives of this work were to calculate S values for the mouse and investigate the magnitude of changes in the absorbed dose to and from subcutaneous tumours. Calculations were performed for different radionuclides, and thus different emission characteristics, for various tumour-to-background activity ratios.
Material and methods
The Moby phantom [Citation11] consists of a software package that creates two sets of 3D voxel matrices of the mouse, based on the information in a parameter file, one describing the activity distribution and the other the attenuation map. To obtain the necessary data in the present investigation, the parameter file was written in such a way that each organ was given a unique number in the field of the parameter file that otherwise normally specifies organ activity. The Moby program was used to generate a voxel phantom of 128 × 128 × 432 elements, with cubic voxels of 250 μm. Several phantoms were created by modifying the parameters controlling the skeleton thickness. By comparing these phantoms with each other, different bone marrow regions could be automatically segmented. The voxel phantoms were also modified by segmenting some of the organs in left and right compartments (lungs, kidneys, femur, thyroid, testis and skeleton and bone marrow compartments).
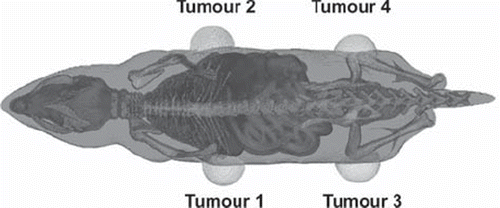
The images of the mice were then expanded with voxels of zero value to a matrix format of 160 × 160 × 432, in order to allow for the addition of subcutaneous tumours. Four tumour locations were selected: two on the left and right thigh, and two on the left and right flank corresponding to the most caudal rib, as illustrated in . The tumours were added to the phantom images using in-house-developed software, written in IDL (ITT Visual Information Solutions, Boulder, Colorado, USA), in such a way that the tumours were separately centred on the surface of the skin and modelled as spheres with radii of 1, 2, 4, 6, 8, 12, 16, 20 and 24 voxels. The tumours did not invade the tissue beneath the skin, resulting in a half sphere like geometry. The tumour weights ranged between 1.5 μg and 0.5 g. All voxels outside the phantom were equivalent to attenuation in air to prevent particles from being terminated in the void before re-entering the phantom. In order to study the impact of different body weight, three mouse phantoms with body weights of 22 g, 28 g and 34 g were simulated by re-defining the voxel size to 216 μm, 234 μm and 250 μm in the Monte Carlo calculations.
Figure 1. Dorsal view of the generated Moby phantom, showing the four different tumour locations on the left and right flanks and thighs.
The phantom thus consists of four tumours and 50 segments, each of which serves as both a source volume for radiation emission and a target volume for the deposition of energy. Because of the complex geometry, an IDL program was developed to generate input files for the MCNPX 2.6f Monte Carlo code [Citation16]. The compositions of soft tissue, lung, bone and air were taken from ICRP 23 [Citation17], and the densities used were extracted from the log file created by the Moby software. In this study, the activity was supposed to be homogeneously distributed.
The MCNPX 2.6f Monte Carlo code was used to calculate the energy distribution and related absorbed dose distributions. The ITS energy indexing algorithm, used to assign energy loss parameters in the MCNP condensed history sampling technique for electron transport, was used and the number of sub-steps was increased to 10 for lung tissue, as the voxel size is small compared of the energy step of the electron straggling for tissue of low density. The transport of the particles was treated as analogue, without any variance reduction methods included. The cut-off energy for the electrons was set to 10 keV in order to reduce the time required for the simulations. The MCNP tally used was *F8:e, which scores energy deposition in the 54 target volumes. Simulations were made with monoenergetic photons (30, 50, 70, 100, 200, 400, 700 and 1000 keV), monoenergetic electrons (50,100, 200, 400, 700, 1000, 1500 and 2000 keV), and for the photon/electron energies emitted by the radionuclides 125I, 131I, 111In, 177Lu and 90Y (). The energies and yields were extracted from the software RadDecay v3 (Charles Hacker, Griffith University, Gold Coast, Australia), which is based on the data from the Radiation Shielding Information Center at Oak Ridge National Laboratories (USA). The β-spectra used were obtained from the RADAR website [Citation18].
Table I. Predominant emissions from isotopes in this study.
Each source organ was simulated individually. To maintain the statistical error below 3%, 10–50 million source particles were simulated. However, a higher statistical uncertainty was accepted when the absorbed energy in an organ was due only to bremsstrahlung as the absolute error was negligible. All simulations were run on a Linux cluster using a 64-bit compiled version of the MCNPX 2.6c code. After the simulations the ‘mctal files’ containing the tally results from the MCNPX simulation were evaluated with an IDL program developed in-house. All data were finally stored in 4D matrices, where the first dimension represents the source organ, the second dimension represents the target organ, the third dimension the tumour size and the fourth dimension the photon energy, electron energy or radionuclide.
In order to visualise the effect of the cross-dose in relation to the self-dose, the fraction of self-dose relative to the total dose was calculated. This parameter varies between 0 and 1, where a value of 1 indicates no cross-dose. To study the cross-dose to the tumour sites, the ratio between the cumulated activity concentrations in the tumour and other organs was used, i.e. the ratio tumour:liver:kidney:remainder.
Results
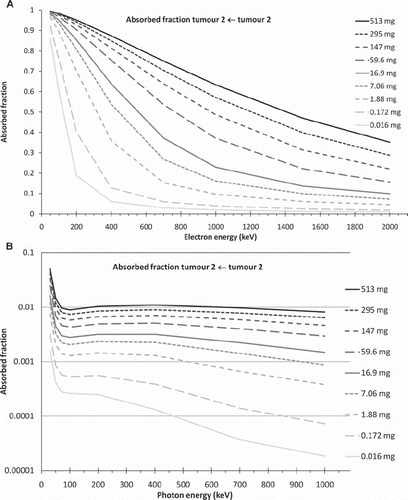
shows the absorbed fractions as a function of monoenergetic electron energies for nine different tumour masses positioned at tumour location 2, i.e. on the right flank. As expected, the absorbed fraction (AF) decreases with increasing electron energy, and the rate of the decrease is highest for the smallest tumour. For the largest tumour the decrease in AF for electrons is almost linear with increasing energy, decreasing to an AF of 0.5 at 1.5 MeV. For the smallest tumour mass, the decrease in the AF is very steep, and reaches 0.5 at an energy level of only 200 keV. The AF then levels out and is approximately inversely proportional to the energy above 800 keV. This is the case when the electron range is larger than the tumour radius, as the energy deposited in the tumour is a function of the stopping power of electrons multiplied by the average path length in the tumour. shows the corresponding results for photons. Here it can be seen that the shapes of the curves are different from those in , starting with a steep descent at low photon energies which then rapidly levels out at about 150 keV. Above this energy the magnitude of the AF is very small, with a value of 0.01 or less. Thus, most of the emitted energy is absorbed in tissues outside the tumour because of the long path length of photons.
Figure 2. Self–absorbed fraction for tumour location 2 (right flank) as a function of energy for different tumour masses, for electrons (A) and photons (B).
The results for the radionuclides studied are presented in , which show the fraction of the absorbed dose to the tumour due to self-dose for different tumour-background activity concentrations. The remaining contribution to the absorbed dose corresponds to energy deposited by the cross-fire of particles. Some situations were modelled to evaluate the effect of cross-dose from the body on the tumour-absorbed dose. shows the results for a tumour located on the left flank () and on the left thigh () for a cumulated activity concentration ratio between tumour:liver:kidney:remainder equal to 10:10:10:1. shows the corresponding results for the cumulated activity concentrations 10:10:10:0, i.e. no there is no activity in the remainder.
Figure 3. The ratio of tumour self–dose to tumour total dose from the radionuclides studied for tumour location 1 (left flank) (A) and tumour location 3 (left thigh) (B), for a cumulated activity concentration ratio tumour:liver:kidney:remainder of 10:10:10:1 in the 34 g mouse phantom.
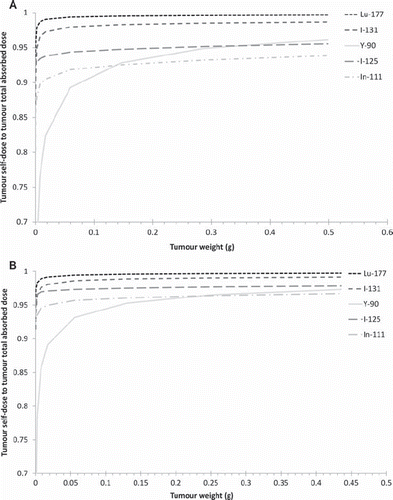
Figure 4. The ratio of the tumour self–dose to the tumour total dose from the studied radionuclides for tumour location 1 (left flank) (A) and tumour location 3 (left thigh) (B), for a cumulated activity concentration ratio tumour:liver:kidney:remainder of 10:10:10:0 in the 34 g mouse phantom.
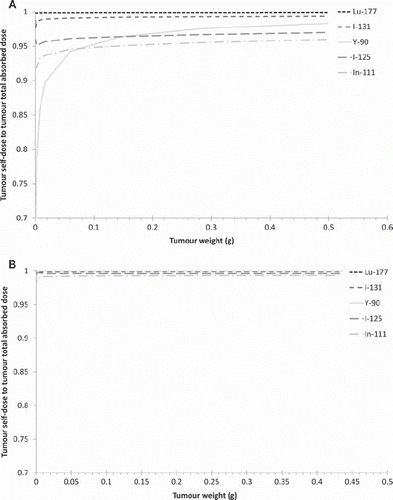
Figure 5. The self-dose: total dose ratio from the studied radionuclides for tumour location 1 (left flank) for the three body weights: A = 22 g, B = 28 g and C = 34 g. The cumulated activity concentration ratio tumour:liver:kidney:remainder in A (left) is 10:10:10:1.
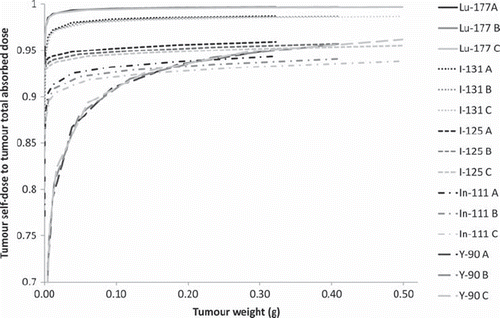
The self tumour absorbed dose to total tumour absorbed dose ratios were evaluated for three phantom sizes of 22 g, 28 g and 34 g and is presented in . These calculations were performed for a tumour on the left flank (location 1) and activity ratios between tumour/liver/kidney/remainder of 10:10:10:1.
To investigate how the activity accumulation in the tumour affects the absorbed dose to adjacent organs, the case where the ratio of the cumulated activity concentration between tumour and liver was 100:1 was studied (). As the tumour mass increases, the total cumulated activity also increases, and thus the cross-dose to the liver increases.
Discussion
As can be seen from , the tumour self-dose is highly dependent on the size of the tumour and the energy of the particles. It is thus of great importance for the accuracy of the dosimetry to use the correct tumour size, even when considering the specific absorbed fraction. This implies that scaling the electron AF with the mass and the photon AF with mass2/3, as described in the MIRD pamphlet [Citation1,Citation2] is not adequate, because of the energy loss of the electrons. When comparing the tumour AF with the AF of a sphere with the same mass, it was found that for a 0.5 g tumour the AF increased by less than 1% below 200 keV, and increased to 7–9% between 1000 keV and 2000 keV. For photon-emitting radionuclides or radionuclides emitting β-particles with high energies the contribution to the absorbed dose from the cross-fire may thus be important.
and show the self-dose to total-dose ratio in the tumours for the selected radionuclides. The difference between and is due to the fact that a cross-dose from the kidney and liver to the flank is much more likely than a cross-dose to the thigh. These results clearly demonstrate that the location of the tumour could influence the absorbed dose, and that it may be necessary to consider adjacent organs when performing absorbed dose calculations.
When studying , comparing the results for the three different mouse weights (22 g, 28 g and 34 g), it can be seen that there is a variation between the cross-dose and body weight for photon-emitting radionuclides, although this effect is small. When the activity is located in major organs the cross-dose to tumours increases for a smaller phantom, due to the shorter organ–tumour distances. The difference in cross-dose between the phantom sizes in the studied case are as high as 15% for 111In, but in comparison with the total tumour-absorbed dose, the difference is only 1.5 %. For β-emitting radionuclides the contribution from cross-dose is almost independent of the body size as the dominating contribution is from adjacent tissue.
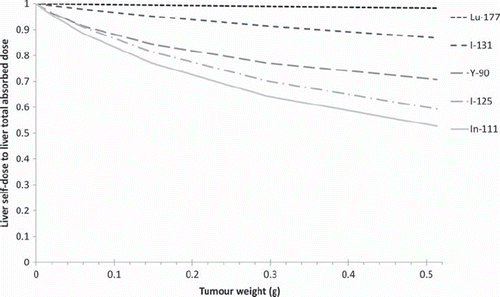
shows the liver self-dose:total liver absorbed dose ratio from a tumour at location 1 (left flank), for a cumulated activity concentration ratio tumour: liver of 100:1. In this example, the cross-dose to the liver from the tumour would be up to 45% of the total absorbed dose for 111In, and up to 40% for 125I and 30% for 90Y. This demonstrates that a tumour can add a significant cross dose to an organ if the cumulated activity concentration is much higher in the tumour.
In this study no consideration to any heterogeneous uptake was taken. Several studies [Citation6,Citation19] have shown that in tumours, the rim of the tumour is often well vascularised, whereas the tumour core can be non-vascularised or even necrotic. As the tumours grew, the non-vascularised to tumour volume ratio tends to increase. This heterogeneity will of course affect the absorbed fraction to the viable tumour cells, especially for high energy electrons. The cross-doses will however be affected in a minor way. To include the heterogeneity into a tumour dosimetry model is a non trivial task and requires knowledge of the 3D activity distribution in the tumour. It is possible that in the future this model could include a tumour model based on spherical layers or a possibility to integrate 3D distribution of the radiopharmaceutical acquired by imaging techniques such as μ-PET, μ-SPECT or digital autoradiography. The scope of this study was to investigate how tumour localisation could affect the dosimetry to the tumour and other tissues.
In conclusion, the dosimetry model developed in this study, based on the Moby mouse phantom, accounts for different tumour sizes and locations. The tumour size was shown to be the most important parameter in the estimation of accurate tumour S factors. In addition, the tumour geometry is of importance for radionuclides emitting high-energy electrons. Cross-doses to and from the tumour can be significant for radionuclides emitting photons and/or electrons with high kinetic energy, e.g. from 90Y, which is often used in radionuclide therapy studies. The total absorbed dose to tumours varied when located on the abdomen or thigh depending on the uptake of the radiopharmaceutical, while the side of the body on which the tumours were located had little effect in the studied activity distributions.
Accurate dosimetry is of great importance in the interpretation of radiobiological tumour response, as well as in the estimation of absorbed doses to adjacent risk organs when developing new radionuclide therapies. With the novel anatomic mouse model presented in this paper, specific S values have been calculated for the radionuclides 125I, 131I, 111In, 177Lu and 90Y and are available by the authors. These together with biodistribution data of the radiopharmaceutical and knowledge of the tumour size can then be used for a good determination of the mean absorbed doses to tumour and organs at risk.
Acknowledgements
This study was supported by grants from the Swedish Cancer Foundation, the Swedish Radiation Safety Authority, Berta Kamprad's Foundation and Gunnar Nilsson's Foundation.
Declaration of interest: The authors report no conflicts of interest. The authors alone are responsible for the content and writing of the paper.
References
- Snyder WS, Ford MR, Warner GG, Watson SB. “S,” absorbed dose per unit cumulated activity for selected radionuclides and organs. New York: Society of Nuclear Medicine; 1975.
- Loevinger RF, Budinger T, Watson EE. MIRD primer for absorbed dose calculations. New York: Society of Nuclear Medicine; 1988.
- Hui TE, Fisher DR, Kuhn JA, . A mouse model for calculating cross-organ beta doses from yttrium-90-labeled immunoconjugates. Cancer 1994;73:951–7.
- Yoriyaz H, Stabin MG. Electron and photon transport in a model of a 30 g mouse. J Nucl Med 1997;38:228.
- Muthuswamy MS, Roberson PL, Buchsbaum DJ. A mouse bone marrow dosimetry model. J Nucl Med 1998; 39:1243–7.
- Flynn AA, Green AJ, Pedley RB, Boxer GM, Boden R, Begent RH. A mouse model for calculating the absorbed beta-particle dose from (131)I- and (90)Y-labeled immunoconjugates, including a method for dealing with heterogeneity in kidney and tumor. Radiat Res 2001;156:28–35.
- Hindorf C, Ljungberg M, Strand SE. Evaluation of parameters influencing S values in mouse dosimetry. J Nucl Med 2004;45:1960–5.
- Kolbert KS, Watson T, Matei C, Xu S, Koutcher JA, Sgouros G. Murine S factors for liver, spleen, and kidney. J Nucl Med 2003;44:784–91.
- Stabin MG, Peterson TE, Holburn GE, Emmons MA. Voxel-based mouse and rat models for internal dose calculations. J Nucl Med 2006;47:655–9.
- Xu XG, Eckerman KF. Handbook of anatomical models for radiation dosimetry. Boca Raton: Taylor & Francis; 2009.
- Segars WP, Tsui BM, Frey EC, Johnson GA, Berr SS. Development of a 4-D digital mouse phantom for molecular imaging research. Mol Imaging Biol 2004;6:149–59.
- Larsson E, Strand SE, Ljungberg M, Jonsson BA. Mouse S-factors based on Monte Carlo simulations in the anatomical realistic Moby phantom for internal dosimetry. Cancer Biother Radiopharm 2007;22:438–42.
- Keenan MA, Stabin MG, Segars WP, Fernald MJ. RADAR realistic animal model series for dose assessment. J Nucl Med 2010;51:471–6.
- Bitar A, Lisbona A, Bardies M. S-factor calculations for mouse models using Monte-Carlo simulations. Q J Nucl Med Mol Imaging 2007;51:343–51.
- Bitar A, Lisbona A, Thedrez P, . A voxel-based mouse for internal dose calculations using Monte Carlo simulations (MCNP). Phys Med Biol 2007;52:1013–25.
- Hendricks JS. MCNPX, Version 2.6.ALA-UR-05-8225. Los Alamos, NE: Los Alamos National Laboratory; 2005.
- ICRP. Report of the task group on Reference Man. ICRP Publication 23. Oxford: Pergamon Press; 1975.
- Stabin MG, da Luz LC. Decay data for internal and external dose assessment. Health Phys 2002;83:471–5.
- Nielsen T, Murata R, Maxwell RJ, . Non-invasive imaging of combretastatin activity in two tumor models: Association with invasive estimates. Acta Oncol 2010;49: 906–13.
