Abstract
Background. Currently available tests are insufficient to distinguish patients with epithelial ovarian cancer (EOC) from normal individuals. Metabolomics, a study of metabolic processes in biologic systems, has emerged as a key technology in the measurements of small molecular metabolites in tissues or biofluids. Material and methods. To investigate the application of metabolomics on selecting EOC-associated biomarkers, 173 plasma specimens (80 newly diagnosed EOC patients and 93 normal individuals) were analyzed using ultra-performance liquid chromatography-quadrupole time-of-flight mass spectrometry (UPLC/QTOF/MS). A two-step strategy was performed to select EOC-associated biomarkers. The first step was to select potential biomarkers in distinguishing 42 cancer patients from 58 normal controls through partial least-squares discriminant analysis (PLS-DA) and database searching, and the second step was to validate the discrimination performance of these biomarkers in a dataset contained 38 EOCs and 35 controls. Results. Eight candidate biomarkers were selected. The combination of these biomarkers resulted in the area of receiver operating characteristic curve (AUC) of 0.941, a sensitivity of 0.921, and a specificity of 0.886 at the best cut-off point for detecting EOC. Discussion. Our findings suggested that sharp differences in metabolic profiles exist between EOC patients and normal controls. The identified eight metabolites associated with EOC may be served as novel biomarkers for diagnosis.
Epithelial ovarian cancer (EOC) is the leading cause of death among gynecologic malignancies due to a lack of highly accurate diagnostic tests [Citation1–3]. In the clinic, a common approach to detecting ovarian cancer is to identify cancer-specific biomarkers in the blood, such as cancer antigen 125 (CA125), carcinoembryonic antigen (CEA), and human epididymis protein 4 (HE4) [Citation4]. However, the identification of ovarian cancer by these biomarkers has been suggested to be high false-positive and false-negative [Citation3]. Thus, it is important to find additional screening and diagnostic biomarkers for detecting EOC accurately.
Metabolomics has offered great promise in many types of cancer as an effective and non-invasive diagnostic method [Citation5,Citation6]. Detecting the metabolites in biofluids is a promising approach for cancer diagnosis [Citation7,Citation8]. For this purpose, a comprehensive analysis by chromatography coupled with mass spectrometry (MS) has been used to study primary metabolic patterns and to discover metabolic biomarkers [Citation9,Citation10]. Some metabolites have been validated as useful biomarkers in many kinds of cancers, and several of them are now being used in cancer diagnosis [Citation9,Citation11,Citation12]. In recent years, metabolomics coupled with multivariate analysis methods have been performed in ovarian cancer diagnosis [Citation13–15]. Odunsi et al. revealed different metabolic patterns between EOC women and healthy women using serum samples analyzed by microflow NMR spectroscopy probe [Citation13]. Garcia et al. showed that NMR spectroscopy based metabolomics of serum analysis could be used to discriminate women with ovarian cancer at early stage I/II from healthy controls [Citation14]. Chen et al. analyzed the serum samples from healthy women, patients with benign ovarian tumors, and patients with EOC using liquid chromatography-mass spectrometry (LC-MS), and found several diagnostic metabolites [Citation15]. However, all these studies employed serum samples and their results were diverse, and further research revealing metabolic difference in plasma samples between EOC patients and normal women are needed.
To discover potential biomarkers in distinguishing newly diagnosed EOC from normal individuals, we conducted a prospective study with plasma specimens analyzed by ultra-performance liquid chromatography-quadrupole time-of-flight mass spectrometry (UPLC/QTOF/MS). And we validated the discrimination performance of the selected biomarkers in an additional independent cohort.
Material and methods
Clinical specimens
The plasma samples for this study were collected from the Third Affiliated Hospital, Harbin Medical University. The institutional review board (IRB) at Harbin Medical University approved this research and all participants signed informed consent forms. According to appropriate protocols, patients of various ages with initially diagnosed pelvic masses were enrolled between August 2009 and November 2010. The patients who were diagnosed as EOC were included in the current study; some subjects were excluded based on the following criteria: 1) those who were unable to undergo an operation or ovarian biopsy; 2) those who also had diabetes mellitus and hepatitis; 3) those who had taken antineoplastic drugs before being hospitalized. The EOC status of a study subject was confirmed by either biopsy or post-operative pathology. Meanwhile, the control samples with no ovarian diseases and no evidence of serious diseases (such as other cancers, diabetes mellitus and hepatitis) were collected from the department of gynecology in the same hospital. This type of controls was defined as normal controls. All participants were not taking any treatment before sample collection. The training set included 42 EOC patients and 58 normal controls, which were enrolled between August 2009 and March 2010.The validation set consisted of 38 EOC patients and 35 normal controls were sequentially enrolled between April 2010 and November 2010.
The age at study enrollment, menopausal status, clinical diagnosis, and pathological report of all participants were obtained when they entered the study. The EOC subjects were categorized based on FIGO (International Federation of Gynecology and Obstetrics) stage classification. Clinical information on the participants is provided in .
Table I. Clinical characteristics of human subjects.
Plasma specimens
After fasting and avoiding alcohol and medicine for 12 hours, each participant was collected 5 ml of whole blood before cytoreductive surgery and any radiotherapy or chemotherapy by venipuncture. Then the blood was injected into the evacuated blood collection EDTA-K3 (sodium dihydrogen phosphate) tubes. After centrifuged within one hour, the plasma were separated into five 400-μl portions and stored at -80°C until assayed. After the cytoreductive surgeries and histopathological examinations, all samples were taken into the UPLC/QTOF/MS analysis.
Sample preparation and pretreatment
After being thawed and re-cooling in a 4°C water bath, a 300-μl aliquot of the plasma sample was injected into a vial and vortexed for 30 seconds. The solution was extracted with 1200 μl of methanol and vortexed for two minutes. After incubation for 10 minutes at 20°C, the samples were centrifuged at 14000 g for 10 minutes. An aliquot of the supernatant was transferred to a sampling vial to nitrogen-dry at 37°C. The residue was derivatized using a two-step procedure. Three hundred microliters of a mixture of acetonitrile/water (3:1) were added to the vial, which was then kept at 30°C for 10 minutes, followed by vortexing for 60 seconds. The supernatant was then placed into the sampling vial pending UPLC/QTOF/MS analysis.
Chromatography
A 2 μl aliquot of the pretreated sample was injected into a 100 mm × 2.1 mm, 1.7 μm BEH C18 column (Waters, Milford, USA) held at 35°C using an Acquity ultraperformance liquid chromatography system (Waters). The samples were run alternately between five controls and five EOC samples.
Mass spectrometry
Mass spectrometry was performed on a Waters Micromass Q-TOF (Manchester, UK) equipped with an electrospray ionization source (ESI) operating. The source temperature was set at 100°C with a cone gas flow rate of 25 l/h. Meanwhile, the desolvation gas temperature was 300°C with a desolvation gas flow rate of 650 l/h. The capillary voltage and the cone voltage were set at 2.8 kV and 35 V, respectively. Centroid data were collected from 50 to 1000 M/Z with a scan time of 0.4 seconds and an interscan delay of 0.1 seconds and a lockspray frequency of 10 seconds.
Data process
MassLynx software (Waters) was used for system controlling and data acquisition. The UPLC/QTOF/MS raw data were processed by the MarkerLynx Applications Manager Version 4.1 using the following parameters: initial retention time: 0 minutes; final retention time: 10.5 minutes; mass range: 50–1000; an intensity threshold: 10; noise level: 6.00.
The signals in nine quality control samples (mixtures of the plasma samples) were used to describe the analytical characteristics of metabolic profiling of the UPLC/QTOF/MS system. The relative standard deviation (RSD) value of mean, median and 95% peak areas was 9%, 7% and 1.7–24%, respectively.
Statistical analyses
The statistical analysis was divided into preliminary “training” step and subsequent validation step. In the “training” step, partial least-squares discriminant analysis (PLS-DA) was performed to select the specific metabolites associated with EOC using the variable importance in the projection (VIP) values. The top 50 metabolites among all metabolites ranked in descending order by VIP values were kept for further analysis. Based on the VIP value and the ascertainment of metabolite information in online databases, eight metabolites were selected as potential candidates. Subsequently, a random forest (RF) model which is a powerful classifier composed with trees was constructed from the eight candidates in the training set [Citation16,Citation17]. The logistic regression model adjusted for age and menopause was used to estimate the effects of metabolic biomarkers on classifying EOC patients and normal controls. In the validation step, the RF model was used to evaluate the classification performance of the biomarkers for the external validation set. The receiver operating characteristic (ROC) curve, the area of receiver operating characteristic curve (AUC) values, and the analyses of sensitivity and specificity were performed to describe the differences between EOC patients and normal controls.
PLS-DA procedures were performed using SIMCA-P (version 11.5; Umetrics, Sweden), while the ROC analysis and random forest analysis were conducted using R platform (version 2.12.1). The logistic regression was performed by SAS (version 9.1; SAS Institute, Inc., Cary, NC, USA).
Results
Metabolic profiling and biomarkers
The plasma samples from EOC patients and normal individuals were investigated by UPLC/QTOF/MS ( and B), and 11 473 peaks were obtained. The PLS-DA model score plots showed a clear separation trend between the EOC patients and the normal controls, with satisfactory modeling and predictive abilities (R2Ycum 0.995, Q2cum 0.872) (). All EOC patients were distinguished from the controls in the predictive component, including seven patients in their FIGO stage I or II. For the purpose of indentifying potential biomarkers, HMDB (http://www.hmdb.ca/), METLIN (http://metlin.scripps.edu/) and KEGG (http://www.genome.jp/kegg/ligand.html) databases were searched using the exact mass of the 50 kept metabolites. The distinction between the measured M/Z values and the exact mass of the components of interest was within 0.01 Da. According to the databases, eight metabolites with only one matched M/Z individually were selected as candidate biomarkers. These biomarkers were loaded far from the origin in the loading plot (). The eight metabolites () were significantly associated with EOC. They were up- and down-regulated in the EOC patients compared with the normal controls (). The selected biomarkers were statistically significant after adjusted for age and menopause ().
Figure 1. Plots from UPLC/QTOF/MS and SIMCA-P. A and B showed the typical total ion current (TIC) chromatograms of plasma samples obtained from an EOC patient and a normal control, respectively, using UPLC/QTOF/MS; C shows the PLS-DA score plot for the first two components (t[Citation1], t[Citation2]), which reveals that a considerable separation was achieved between EOC plasma samples (the red triangle) and normal controls (the black box). D depicts the PLS-DA scatter-plots results. The candidate biomarkers are marked with red square.
![Figure 1. Plots from UPLC/QTOF/MS and SIMCA-P. A and B showed the typical total ion current (TIC) chromatograms of plasma samples obtained from an EOC patient and a normal control, respectively, using UPLC/QTOF/MS; C shows the PLS-DA score plot for the first two components (t[Citation1], t[Citation2]), which reveals that a considerable separation was achieved between EOC plasma samples (the red triangle) and normal controls (the black box). D depicts the PLS-DA scatter-plots results. The candidate biomarkers are marked with red square.](/cms/asset/f3d77893-9684-484f-b7d1-a7ab263d7c9c/ionc_a_648338_f0001_b.jpg)
Table II. Differential metabolites derived from PLS-DA analysis.
Figure 2. Box plots of eight typical differential metabolites from newly diagnosed EOC patients (the right box) and normal controls (the left box).
Table III. Adjusted p-value of the metabolic biomarkers in logistic regression models.
Validation set
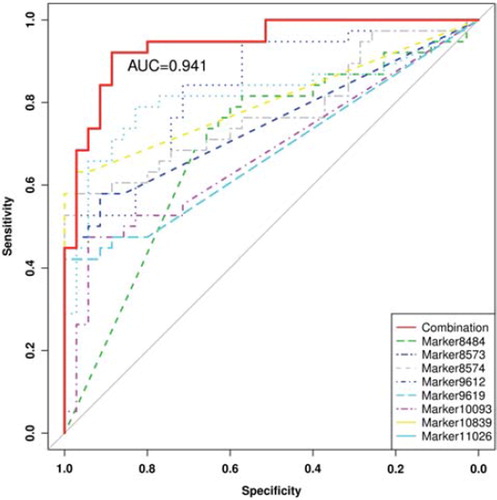
The ROC analyses results from RF were a sensitivity of 92.1%, a specificity of 88.6%, and an AUC of 0.941 at the best cut-off points (). And the six EOC patients who were in their early stages I or II were correctly identified.
Figure 3. The area under empirical ROC curve of the combination of the eight candidate biomarkers, Marker8484, Marker8573, Marker8574, Marker9612, Marker9619, Marker10093, Marker10839 and Marker11026 alone in the external validation cohort.
Discussion
In this study, we found that the plasma metabolic profiling by UPLC/QTOF/MS achieved a good diagnostic accuracy in distinguishing EOC patients from normal controls, and the combination of the eight selected biomarkers showed an excellent classification performance for the independent validation set. Our results were relatively reliable since: 1) the homogeneity was achieved because all participants were from the department of gynecology in the same hospital; and 2) the classification performance of the candidate biomarkers was evaluated in an external validation set.
In recent years, much attention has been paid to the application of metabolic profiling in diagnosing different cancers [Citation12]. However, no metabolite individually provided high sensitivity and specificity. As shown in our study, a single biomarker had good diagnostic accuracy in distinguishing EOC from controls, and moreover, a combination of several metabolites was able to achieve a better diagnostic accuracy. The eight selected metabolites in this study were different from those of previous studies on this topic [Citation13–15]. Although some metabolites with same M/Zs reported by them (e.g. M/Z 468.39, 496.30, 466.33 and 520.43) were found in our top 50 ones, these metabolites were not selected as biomarkers temporarily in our study since we could not identify them due to many isomerides for them. In addition, the metabolite CPG (M/Z 403.35) was suggested as the main biomarker by Chen et al. [Citation15], but it was not statistically significant in our study (Wilcoxon rank sum test: p = 0.44).
Age and menopausal status were imbalance between EOC patients and normal controls in this study, while neither of them influenced on the classification performance of the eight biomarkers analyzed in logistics regression model. The main limitation of our study is that the number of EOC patients with early stage (I/II) was small and only normal women were employed as controls but no women with other benign gynecological disease, such as benign ovarian tumors. Much larger cohorts consisting of relatively large number of EOC women with early stages and other than normal controls are needed in the investigation of metabolomics on this topic.
The most commonly used biomarkers, such as CA125, do not have satisfactory diagnostic accuracy in distinguishing EOC patients from normal women. The AUC value of CA125 was about 0.889 in Tcherkassova's study [Citation18], similar with this result, the AUC value of CA125 in discriminating EOCs from controls was 0.89 for our validation set (data not shown). Both of them were lower than the AUC of 0.941 acquired from our eight metabolic biomarkers. Meanwhile, we tried to indentify chemical compounds associated with the eight biomarkers individually, and to explain why these biomarkers were useful in discriminating EOC from normal subjects. Based on MS spectra, retention behavior, database queries, and literatures, three candidate metabolic biomarkers (M/Z 568.5645, 596.5956, and 596.5944) were highly suspected to be ceramides (N-acylsphingosine). Ceramides can be synthesized from serine and palmitate in a de-novo pathway and are regarded as important cellular signals for inducing apoptosis [Citation19]. A high intracellular concentration of ceramides will induce apoptosis in some cancer cells, such as prostate cancer [Citation20], and breast cancer [Citation21] cells. The candidate metabolic biomarker with M/Z 682.3666 was highly suspected to be a lysophospholipid (LyP). LyPs are bioactive lipids that elicit a wide range of cellular responses, such as cell survival, differentiation, and migration [Citation22]. LyP has been shown to react by stimulating cell migration in prostate cancer [Citation23]. Several studies have also shown that LyP is a potential biomarker for many kinds of cancers including EOC [Citation24,Citation25], which were consistent with our findings. The metabolite with M/Z 668.3502 was most likely to be ganglioside, which is composed of a glycosphingolipid (ceramide and oligosaccharide) together with one or more sialic acids. Ganglioside is a type of glycosphingolipid. The roles of ganglioside in neuroectodermal tumor have been reported [Citation26,Citation27], but no information is related to ovarian cancer. The metabolite with M/Z 308.297 was highly suspected as phytosphingosine, and its high regulated in EOC requires further investigation. The metabolites with M/Z 536.1654 and 519.3967 were highly suspected to be N′-Formylkynurenineand and demethylphylloquinone, respectively, both of them were not reported connecting with EOC. The roles of these two metabolites in EOC cancer require further investigation.
In conclusion, the metabolic profiling could be used to separate EOCs from normal individuals. The combination of the eight candidate biomarkers provided excellent classification performance for the external cohort, and these biomarkers could be served as novel biomarkers in distinguishing between EOC patients and normal individuals in clinic.
Acknowledgements
The study was supported by a grant from the National Natural Science Foundation of China (NSFC 81172767). The authors report no conflicts of interest. The authors alone are responsible for the content and writing of the paper.
Declaration of interest: The authors report no conflicts of interest. The authors alone are responsible for the content and writing of the paper.
References
- Teneriello MG, Park RC. Early detection of ovarian cancer. CA Cancer J Clin 1995;45:71–87.
- American Cancer Society. Cancer facts & figures 2010. Atlanta: American Cancer Society; 2010.
- Jacobs IJ, Menon U. Progress and challenges in screening for early detection of ovarian cancer. Mol Cell Proteomics 2004;3:355–66.
- Williams TI, Toups KL, Saggese DA, Kalli KR, Cliby WA, Muddiman DC. Epithelial ovarian cancer: Disease etiology, treatment, detection, and investigational gene, metabolite, and protein biomarkers. J Proteome Res 2007;6:2936–62.
- Li M, Wang B, Zhang M, Rantalainen M, Wang S, Zhou H, . Symbiotic gut microbes modulate human metabolic phenotypes. Proc Natl Acad Sci USA 2008;105:2117–22.
- Cao H, Huang H, Xu W, Chen D, Yu J, Li J, . Fecal metabolome profiling of liver cirrhosis and hepatocellular carcinoma patients by ultra performance liquid chromatography-mass spectrometry. Anal Chim Acta 2011;691:68–75.
- Gold J. Metabolic profiles in human solid tumors. I. A new technic for the utilization of human solid tumors in cancer research and its application to the anerobic glycolysis of isologous benign and malignant colon tissues. Cancer Res 1966;26:695–705.
- Griffin JL, Shockcor JP. Metabolic profiles of cancer cells. Nat Rev Cancer 2004;4:551–61.
- Sreekumar A, Poisson LM, Rajendiran TM, Khan AP, Cao Q, Yu J, . Metabolomic profiles delineate potential role for sarcosine in prostate cancer progression. Nature 2009;457:910–4.
- Gowda GA, Zhang S, Gu H, Asiago V, Shanaiah N, Raftery D. Metabolomics-based methods for early disease diagnostics. Expert Rev Mol Diagn 2008;8:617–33.
- Bartella L, Thakur SB, Morris EA, Dershaw DD, Huang W, Chough E, . Enhancing nonmass lesions in the breast: Evaluation with proton (1H) MR spectroscopy. Radiology 2007;245:80–7.
- Spratlin JL, Serkova NJ, Eckhardt SG. Clinical applications of metabolomics in oncology: A review. Clin Cancer Res 2009;15:431–40.
- Odunsi K, Wollman RM, Ambrosone CB, Hutson A, McCann SE, Tammela J, . Detection of epithelial ovarian cancer using 1H-NMR-based metabonomics. Int J Cancer 2005; 113:782–8.
- Garcia E, Andrews C, Hua J, Kim HL, Sukumaran DK, Szyperski T, . Diagnosis of early stage ovarian cancer by 1H NMR metabonomics of serum explored by use of a microflow NMR probe. J Proteome Res 2011;10:1765–71.
- Chen J, Zhang X, Cao R, Lu X, Zhao S, Fekete A, . Serum 27-nor-5beta-cholestane-3,7,12,24,25 pentol glucuronide discovered by metabolomics as potential diagnostic biomarker for epithelium ovarian cancer. J Proteome Res 2011;10:2625–32.
- Breiman L. Random forests. Machine Learning 2001;45:5–32.
- Diaz-Uriarte R, de Andres SA. Gene selection and classification of microarray data using random forest. BMC Bioinformatics 2006;7:3.
- Tcherkassova J, Abramovich C, Moro R, Chen C, Schmit R, Gerber A, . Combination of CA125 and RECAF biomarkers for early detection of ovarian cancer. Tumour Biol 2011;32:831–8.
- Hannun YA, Luberto C, Argraves KM. Enzymes of sphingolipid metabolism: From modular to integrative signaling. Biochemistry 2001;40:4893–903.
- Saad AF, Meacham WD, Bai A, Anelli V, Elojeimy S, Mahdy AE, . The functional effects of acid ceramidase overexpression in prostate cancer progression and resistance to chemotherapy. Cancer Biol Ther 2007;6:1455–60.
- Dziecedil GP, Owczarek T, Plazuk E, Gomulkiewicz A, Majchrzak M, Podhorska-Okolow M, . Ceramide galactosyltransferase (UGT8) is a molecular marker of breast cancer malignancy and lung metastases. Br J Cancer 2010;103:524–31.
- Sutphen R, Xu Y, Wilbanks GD, Fiorica J, Grendys EC Jr, LaPolla JP, . Lysophospholipids are potential biomarkers of ovarian cancer. Cancer Epidemiol Biomarkers Prev 2004;13:1185–91.
- Monet M, Gkika D, Lehen'kyi V, Pourtier A, Vanden Abeele F, Bidaux G, . Lysophospholipids stimulate prostate cancer cell migration via TRPV2 channel activation. Biochim Biophys Acta 2009;1793:528–39.
- Sengupta S, Kim KS, Berk MP, Oates R, Escobar P, Belinson J, . Lysophosphatidic acid downregulates tissue inhibitor of metalloproteinases, which are negatively involved in lysophosphatidic acid-induced cell invasion. Oncogene 2007;26:2894–901.
- Springett GM, Bonham L, Hummer A, Linkov I, Misra D, Ma C, . Lysophosphatidic acid acyltransferase-beta is a prognostic marker and therapeutic target in gynecologic malignancies. Cancer Res 2005;65:9415–25.
- Mocchetti I. Exogenous gangliosides, neuronal plasticity and repair, and the neurotrophins. Cell Mol Life Sci 2005;62: 2283–94.
- Birkle S, Zeng G, Gao L, Yu RK, Aubry J. Role of tumor-associated gangliosides in cancer progression. Biochimie 2003;85:455–63.