Abstract
Background. The interactions between cancer-associated fibroblasts (CAFs) and cancer cells or tumor-infiltrating lymphocytes (TILs) and cancer cells play important roles in cancer progression and metastasis. However, studies related to the crosstalk between CAFs and TILs in tumor microenvironment (TME) are still lacking. In this study, we mainly investigated the interactions between CAFs and TILs. Material and methods. The distribution of TILs rich in regulatory T cells (Tregs) in breast cancer tissues was evaluated using hematoxylin-eosin staining and immunohistochemistry with anti-CD3, anti-Foxp3, and anti-α-smooth muscle actin antibodies. Homologous CAFs/normal fibroblasts (NFs) and TILs cultured in vitro were identified and detected using immunocytochemistry and flow cytometry (FCM). The direct interaction among these cell types was studied via a factorial design in a co-cultured system. Their indirect interaction was assayed using Transwell plates. The cell cycle and apoptosis of CAFs/NFs co-cultured with TILs was analyzed using propidium iodide staining. Results. Histochemistry demonstrated most of the TILs including Tregs, were distributed in the cancer stroma, adjoining to CAFs. This finding implies that both cell types interact closely in the TME. Identification of the cultured cells showed that CAFs maintained their activated phenotype within limited passages in vitro, and that the TILs population contained a high percentage of Tregs. Data analysis of the factorial design suggests significant interactions among CAFs, NFs, and TILs in both direct and indirect contact ways. The CAFs and NFs were suppressed signally by TILs, which are probably induced by the secretory cytokines derived from TILs or Tregs. Although apoptosis was not detected in CAFs/NFs, the cell cycle assay suggested that the CAFs/NFs were arrested in the G2/M phase by the TILs and their secretory cytokines. Conclusion. CAFs and NFs were dramatically suppressed by Tregs-rich TILs. This suggests the interaction between TILs and CAFs might modify the TME in an unknown manner.
In 1982, while advocating that tumors consist of multiple cell types, Bissell et al. [Citation1] originally outlined a more comprehensive concept of the tumor microenvironment (TME). Within cancer tissues, the dynamic paracrine signals from various types of cells and direct cell-cell contact (the same or different type) continuously remodel the TME and influence all the cells in a co-evolution model [Citation2]. In 2011, Hanahan [Citation3] emphasized that carcinomas are complex tissues composed of multiple cell types that interact heterotypically with one another. These distinct cell types include cancer cells, immune cells, cancer-associated fibroblasts (CAFs), pericytes, endothelial cells, and so on. Recently, Hanahan et al. [Citation4] focused on the collaborative interactions between neoplastic cells and their supporting stroma. Their review summarizes the contribution of the different stromal cell types to the hallmarks of cancer, which include the signaling of promoting tumor cells growth, avoiding growth suppressors, resisting cell death, immortality, angiogenesis, invasion and metastasis, and avoiding immune destruction. All the evidence establishes the key role of stromal cells and the TME in tumor genesis and progression.
Erez [Citation5] and Giannoni et al. [Citation6] proved that fibroblasts were first activated by the tumor signals and then transformed into CAFs, which are major stromal cell types in tumor tissues. Once the fibroblasts have completely transformed into CAFs, they express activation markers such as alpha-smooth muscle actin (α-SMA), which analogous to the activation and functional changes in fibroblasts during wound healing [Citation7]. On the other hand, increasing researches have confirmed that, as the most abundant cells in tumor stroma, activated CAFs have a powerful role in promoting tumor cells growth, invasion and metastasis, increased angiogenesis and stromal structure, and TME remodeling [Citation8–12].
Along with CAFs, tumor-related immune cells are also abundant in the TME. The immune cells in the tumor tissues are composed of lymphocytes, neutrophils, macrophages, and so on, of which the tumor infiltrating lymphocytes (TILs) are abundant [Citation13]. Initially, large amounts of immune cells in the tumor tissues are associated with better cancer prognosis. In the recent years, accumulative research indicated that the immune cells in tumor tissues fail to exert anti-tumor functions, as well as contributed to tumorigenesis and progression [Citation14]. Previous studies demonstrated that the TGF-β and IL-10 secreted by cancer cells and immunosuppressive cells such as regulator T lymphocytes (Tregs) suppresses the immune system particularly at the tumor site [Citation14]. The infiltration of TILs, including Tregs, is induced by chemokines secreted by cancer cells.
TILs are mainly distributed within the tumor stroma. This phenomenon implies that immunocytes and stromal fibroblasts occur in close proximity with one another, which may theoretically render them in a crosstalk model. However, until recently, most studies focused on the interactions between cancer cells and CAFs or cancer cells and tumor-associated immune cells. Therefore, the interaction between immune cells and CAFs requires further study. Studies have indicated that immune cells, fibroblasts, and their interaction are important factors in cancer progression and in chronic inflammation [Citation15–17]. This kind of crosstalk may potentially influence the TME because of the functional changes in both the immune cells and the CAFs in the TME. This study aims to provide better insight into the relationship between CAFs and TILs in the TME.
Material and methods
Immunohistochemistry
A total of 120 invasive breast cancer specimens, 80 normal breast tissues, and 10 breast fibroadenomas (fixed in 4% paraformaldehyde, paraffin-embedded) were obtained from the tissue bank of the Cancer Institute. The tissue sections were stained with hematoxylin and eosin (HE) after they were cut into 5 μm thick sections. Then, the sections were stained immunohistochemically using rabbit anti-human CD3 monoclonal antibody (CD3: T lymphocytes marker) to show the distribution of T lymphocytes. PBS was substituted for the primary antibody in the negative control. The protocol was performed as previously described [Citation18]. The tissue sections were observed under a light microscope (Olympus FV500). Fibroblast activation in the tissues were verified using mouse anti-human α-SMA and rabbit anti-human vimentin antibodies, with secondary antibodies labeled with fluorescence or biotin, and images were taken under a light microscope or a confocal laser scanning microscope.
Immunohistofluorescence staining using rabbit anti-human Foxp3 (Epitomics), mouse anti-human α-SMA monoclonal antibodies was carried out to show the distribution of Foxp3-positive Tregs and α-SMA-positive fibroblasts in cancer tissues. The primary antibodies were labeled with FITC-conjugated goat anti-rabbit IgG [H + L] (green, ZSGB-BIO) and TRITC-conjugated goat anti-mouse IgG [H + L] (red, Boster), Dylight™594 goat anti-Rabbit IgG [H + L], and Dylight™488 goat anti-Mouse IgG [H + L] (Muletiscience). The protocols were performed as in previous articles [Citation18–20].
Primary cultures of homologous fibroblasts and tumor-infiltrating lymphocytes
Fresh specimens of invasive breast cancer and normal breast tissues (distance > 3–5 cm; mass ≥ 0.3 cm × 0.3 cm × 0.2 cm) were collected under sterile conditions from primary breast carcinoma patients who underwent surgery at the Second Affiliated Hospital of Zhejiang University. All patients provided signed informed consent forms. The study was approved by the ethics committee of the Second Affiliated Hospital of Zhejiang University. The TILs, CAFs, and NFs were obtained from the surgically resected breast of invasive breast carcinoma patients using a previously reported method [Citation21]. Briefly, the carcinoma and normal tissue specimens were cut into approximately 1 mm3 to 2 mm3 pieces and placed in Dulbecco's modified Eagle's medium/F12 (Gibco) mixed culture medium (DMCM) with 10% heat-inactivated fetal bovine serum (Gibco), antibiotics (Sigma, penicillin 100 U/ml and streptomycin 100 μg/ml), amphotericin B (2.5 μg/ml, Sigma), fibroblast growth factor (FGF)-basic (10 ng/mL, Epitomics), and IL-2 (200 IU/ml, Epitomics) in a humidified incubator under a 5% CO2 atmosphere at 37°C. After four days, the TILs were isolated via tissue debris filtrating and washing. The suspended TILs were cultured in lymphocyte culture medium (DMCM plus anti-CD3mAb (OKT3, 1 μg/ml, eBioscience) and 2- mercaptoethanol (3.5 μl/100 ml, Sigma) without FGF-basic. The remaining TILs were frozen and stored in liquid nitrogen for future use. The tissue debris and anchorage-dependent cell were cultured together in IL-2-free DMCM until numerous adherent cells appeared at the bottom. The debris was then removed. Upon reaching 80% confluence, the cells were harvested with 0.25% trypsin and then cultivated in bottles. The fibroblasts were separated spontaneously from contaminating epithelial cells and macrophages in the culture medium over three passages.
Detection of TILs/Tregs by flow cytometry (FCM)
The TILs were detected via flow cytometry (FCM) using fluorescence-labeled antibodies (all eBioscience) to confirm the cultured suspension cells as lymphocytes and to identify the various cell types. We specifically used CD3-PerCP to detect T lymphocytes, CD3-PerCP/CD4-FITC to detect CD4 + T lymphocytes, CD3-PerCP/CD8-PE to detect CD8 + T lymphocytes, and CD4-FITC/CD25-PE/CD127-PerCP to detect Tregs. The FCM was performed according to a previously published protocol [Citation22].
Immunocytochemistry for identifying CAFs/NFs
The CAFs and NFs were seeded onto round pieces of glass in a 24-well plate. When the cells reached 70–90% confluence, the culture medium was removed and the cells were fixed for 20 minutes with SafeFix solution. The cells were then permeabilized with 0.2% Triton X-100 for 15 minutes, followed by incubation in normal non-immunogenic goat serum for 30 minutes. Primary rabbit anti-vimentin, mouse anti-α-SMA, and anti-pan-cytokeratin (CK-pan) antibodies were subsequently used for overnight incubation at 4°C. After washing with deionized water, the sections were incubated for 5 minutes in freshly prepared 3, 3-diaminobenzidin (DAB) solution. Finally, the slides were counterstained with hematoxylin. PBS was substituted for the primary antibody as the negative control. Cell images were taken under a light microscope.
Western blot analysis
We performed a Western blot analysis to validate the α-SMA expression in CAFs and NFs. Briefly, the CAFs and NFs on the dishes were washed three times with PBS. Then, the collected cells were lysed by sonication in buffer consisting of 7 M urea, 2 M thiourea, 4% CHAPS, 65 mM DTT, and 0.2% Biolyte on an ice bath. The lysates were then centrifuged (10 000 × g, 0.5 hours, 4°C) and the supernatants were collected and stored at −80°C. The protein concentrations were measured using a standard Bradford protein assay. Equal amounts of protein samples from the CAFs and NFs were separated using 10% sodium dodecyl sulfate polyacrylamide gel, transferred onto PVDF membranes (0.2 μm), and then probed overnight with mouse anti-α-SMA primary antibodies (diluted 1:2000 in 2% non-fat milk) at 4°C. The membranes were incubated with horseradish peroxidase-conjugated goat anti-mouse antibody, developed using an ECL substrate, and exposed to Kodak Biomax MR Film.
Factorial design
A factorial design experiment (3 factor × 2 level) was conducted in 96-well plates to investigate the interactions among fibroblasts, including CAFs and NFs, and TILs. Two cases of homologous cells (TILs and CAFs/NFs) were used in the experiment. All experimental groups are shown in (Factors: TILs/CAFs/NFs, abbreviation: T/C/N, level number X = 0 or 1 meant the level of cells). Each group of TxCxNx was repeated in six wells. All cell types were co-cultured in 200 μl/well of lymphocyte culture medium for 5 days at 37°C under a saturated 5% CO2 atmosphere. Half of the medium was gently replaced on the third day. After five days, 20 μl of WST-8 solution was added into each well and incubated for four hours. The OD was assayed at 450 nm using an ELISA reader. The cell nuclei were stained with DAPI to exclude the possibility of the apoptosis or death of fibroblasts induced by homologous TILs in the co-culture system after OD detection. The interaction of the heterologous TILs and fibroblasts was set as the control group within 24 hours. A part of the TILs was labeled with CFDA-SE for highlighting before the experiment.
Table I. Groups of factorial design (the direct and indirect interaction/contact of TILs and CAFs/NFs): 3 factor × 2 level. Factors: TILs/CAFs/NFs (further abbreviation: T/C/N); levels: 0 and 1. Level number 0, 1 meant the given number level of cells, N0/C0/T0 meant 0 cell/well; N1/C1 meant 1500 cells/well; T1 meant 15 000 cells/well. The design of 3 factor × 2 level is composed of eight groups (n = 6: samples in one group). The indirect interaction experiment was designed according to the same protocol. Factor M is the acronym of medium, which meant TILs in the up chamber of the Transwell. M0 meant 0 cell/well in the upper chamber of the Transwell. M1 meant 15 000 cells/well. Two cases of homologous cells (TILs and CAFs/NFs) were used in the experiment (repeated three times).
The indirect cell-cell interaction/contact was done using Transwell plates (0.4 μm Corning, with TILs in the upper chambers), as well as cell-cell co-culture system. The indirect interaction experiment was designed according to the same protocol. Factor M represents the medium, which refers to the TILs in the upper chamber of the Transwell plates.
Cell cycle and apoptosis assay
FCM was adopted for the cell cycle and apoptosis analysis by propidium iodide (PI, BD) staining to show the fate of CAFs/NFs, which are co-cultured with TILs. The protocol was based on the specification.
Statistical analysis
Statistical analysis was conducted with SPSS software (version 19.0). The differences and interactions among the groups in the factorial design experiment were analyzed using a multi-way analysis of variance. The statistical threshold was set at 0.05 (two-sided).
Results
TILs/Tregs distributed in the stroma mixed with CAFs
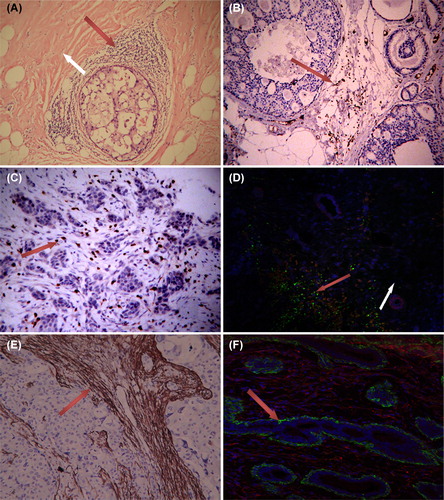
The TILs comprise T and B lymphocytes and previous studies confirmed that the majority of TILs are T lymphocytes. Considering all T lymphocytes express the TCR complex and CD3 is an essential component of the complex, CD3 is regarded as a T lymphocyte marker. In our study, HE staining and the tissue assessment with a CD3 marker showed that TILs are mainly distributed in the stroma of non-special types of breast cancer and were scarcely present in cancer cell colonies (as shown in ). On the other hand, assessment of the T lymphocytes showed that T lymphocytes are rare in the normal breast stroma. Interestingly, the Foxp3-positive Tregs mixed together with α-SMA positive CAFs rarely appeared in the stroma of the adjacent normal tissue (). á-SMA is a marker for activated fibroblasts. Studies have demonstrated that the CAFs in more than 80% of breast cancers express α-SMA [Citation23]. Consistent with previous studies, our study confirmed the wide presence of α-SMA-positive CAFs in breast cancer stroma and the lack of α-SMA expression in normal breast tissues (). This finding implies that the TILs/Tregs in cancer stroma were mixed with the CAFs. This phenomenon suggests that the location of TILs/Tregs and CAFs, which occur in close proximity to one another, allows them to interact, at least theoretically.
Figure 1. TILs and α-SMA+ CAFs in tissues. 1) A, HE staining showing the extensive presence of lymphocytes around ductal breast carcinoma in situ (red arrow), which was rarely found in normal tissue (white arrow area). B, C: CD3+ TIL mainly distributed in the stroma of ductal breast carcinoma and invasive breast cancer. 2) D showing Foxp3+Tregs (green) mixed with α-SMA+ CAFs (red) in cancer stroma (red arrow area). Tregs was scarce in normal stroma (white arrow area). 3) α-SMA+ fibroblasts (CAFs) only appeared in the stroma of breast cancer (E). All fibroblasts showed α-SMA negative and vimentin positive (red) in the stroma around breast ducts and acini (F). The green α-SMA+ cells around breast ducts and acini represent myoepithelium (vimentin negative). A, B, 65-fold; C, D, E, F 100-fold.
TILs population was rich in Tregs
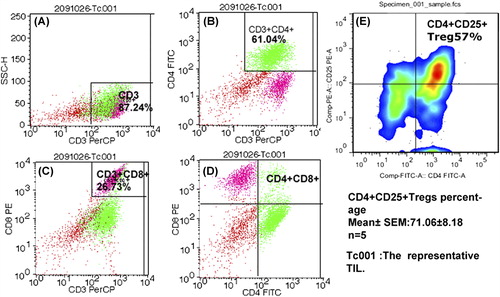
FCM and some fluorescence labeled antibodies (anti-CD3/CD4/CD8/CD25/CD127) were used to detect the traits and constitution of cultured TILs from invasive breast cancer. The representative FCM result of the TILs are shown in , wherein 87.24% of sorted cells were CD3+ T lymphocytes, 61.04% were CD3+ CD4+ T cells, and 26.73% were CD3+ CD8+ T cells. The CD4+/CD8+ ratio was approximately equal to 2.297, which is abnormal compared with that in blood (normal is from 0.9 to 1.9). The Tregs of one sample with the lowest percentage was as high as 57% (). The average result of the five TILs samples showed 71.06% ± 8.18%. Liyanage [Citation24] demonstrated an average Tregs/TILs ratio of 20% in breast cancer. Unlike the 20% in the study by Liyanage, our results show a very high percentage of Tregs among the T lymphocytes, which constitute the majority of the cultured TILs. The data in our study demonstrate that the TILs cultured in lymphocyte culture medium were mainly composed of T lymphocytes, with a very high ratio of Tregs.
Figure 2. Flow cytometry for TILs. Figure A–D showed the representative results of TILs by FCM. A total of 87.24% cells were CD3+ T lymphocytes. Among the TILs, CD3+ CD4+ T lymphocytes reached 61.04% and CD3+ CD8+ T lymphocytes accounted for 26.73%. (F) The minimum percentage of CD4+ CD25+ Tregs from one sample (accompanied by CD127low, not shown) reached 57%, and the five samples reached as high as 71.06% ± 8.18%. All TILs were obtained from patients suffering from invasive breast cancer.
CAFs remained activated in vitro
CAFs and NFs were obtained through the culture of tissue samples obtained from patients with invasive breast cancer. Anti-α-SMA, anti-CK (pan), and anti-vimentin antibodies were used to identify the origin of the cultured fibroblasts and to evaluate their biological characteristics during ex-vivo culture [vimentin is a marker of mesenchymal cells, CK (pan) is a marker of epithelium, and α-SMA is a marker of activated fibroblasts]. Immunocytochemistry showed that the CAFs expressed vimentin and α-SMA, but not CK (pan). The NFs expressed vimentin, but not α-SMA and CK (pan) (). The difference in α-SMA expression between CAFs and NFs was verified using Western blot.
Figure 3. Immunocytochemistry and Western blot analysis of the identification of CAFs/NF. CAFs positive forα-SMA positive (A, brown), and all the NFs were negative for α-SMA (B). Both the CAFs and the NFs expressed, vimentin (C, D: brown), but lacked CK (pan) expression (E, F). Few CK (pan) positive epithelial cells were mixed with NF in Figure F. Figure G shows the result of Western blot analysis for validation of α-SMA expression. Western blot analysis confirmed the α-SMA expression in CAFs and but not in NFs. A, B, E, F 50-fold; C, D 200-fold.
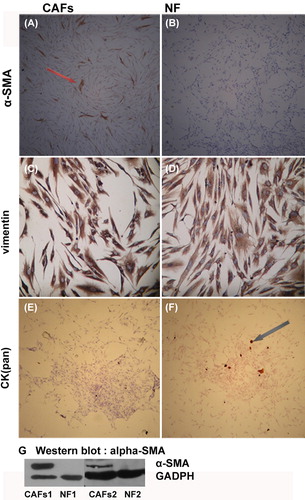
The results demonstrate that after multiple passages, the CAFs in the primary culture remained activated as the CAFs in the cancer stroma (), whereas the NFs remained unactivated because of the negative α-SMA expression.
Cell interactions among TILs, CAFs, and NFs
A study on the direct cell-cell interactions among homologous TILs and CAFs was carried out. ANOVA demonstrated that CAFs were significantly suppressed by TILs (p = 0.000; figure not shown). We conducted studies on the direct interactions among homologous TILs, CAFs, and NFs to further analyze the potential influence of TILs on CAFs. The data from the 3 × 2 factorial design was processed via a multi-way ANOVA. Remarkable interactions were observed among CAFs, NFs, and TILs (, ). The statistical significance reflected the notable interaction between TILs and NFs (p = 0.001) and TILs and CAFs (p = 0.000). According to the statistical analysis, the suppressive effect of the TILs seemed to affect the CAFs more than the NFs (F = 91.42 vs. F = 51.655). The interaction was also remarkable among the co-cultured TILs/CAFs/NFs (p = 0.000). The statistical analysis further proved a significant interaction (p = 0.006) between CAFs and NFs, both of which were fibroblasts.
Figure 4. Box diagram of the factorial design. A): The direct interaction of homologous TILs/CAFs/NFs (3 factor × 2 level, 8 groups, n = 6). The factors comprised T: TILs. C: CAFs and N: NFs. Level 0, 1 indicate the given number of cells. N0/C0/T0 meant 0 cell/well; N1/C1 meant 1500 cells/well; T1: 15 000 cells/well. Multi-way ANOVA showed significant differences existing between the two groups of T0C1N0/T1C1N0, T0C1N1/T1C1N1, and T0C0N1/T1C0N1. B): The indirect interaction of homologous TILs/CAFs/NFs. Factor M represents the medium. M indicates TILs in the upper chamber of the Transwell plates (0.4 μm), influenced CAFs/NFs indirectly. C/N meant 1500 cells/well, and M0/M1 meant 0 and 15 000 cells/well in an up chamber. Multi-way ANOVA also showed significant differences in the group-group comparison (p = 0.00).
Table II. The statistical results of Factorial design (3 factor × 2 level, statistical method: multi-way ANOVA). The direct and indirect cell-cell interactions between pair-combinatorial homologous cells are TILs vs. CAFs, TILs vs. NFs, and TILs vs. CAFs-NFs. The interaction between CAFs and NFs are always direct interaction. Medium meant TILs in the upper chamber of the Transwell. The medium containing secretory materials of TILs/Tregs, which the TILs lived in, penetrated down, and imposed an effect on CAFs/NFs in the bottom well of the Transwell.
The suppressive effect of the TILs may be attributed to cell-cell contact or/and be induced by the secreted factors derived from the TILs. Interestingly, the results from the experiment on indirect cell-cell interactions are similar to that from the experiment on direct interactions (shown as ). This implies that the suppressive effect of the TILs may be mediated by the cytokines from the TILs via indirect cell-cell contact.
Fate of CAFs/NFs in the co-culture system
Theoretically, if the TILs/CAFs/NFs were obtained from the same individual, immunologic rejection would not occur. Considering the homologous interaction between TILs and CAFs/NFs, the TILs did not induce the apoptosis or cell death of CAFs/NFs in our experiments (). show the homologous TILs/CAFs and TILs/NFs after 120 hours of co-culture: the morphology and nuclei of the fibroblasts were normal, with no karyorrhexis. On the other hand, the heterologous co-culture system of the TILs and CAFs/NFs revealed fibroblast apoptosis (cell shrinkage, chromatin condensation, and nuclear fragmentation) ().
Figure 5. Fate of CAFs/NFs in the co-culture system. 1): A/B showed the co-culture of homologous TILs/CAFs (A) and TILs/NFs (B) for 120 hours. The results show no signs of apoptosis or death in the CAFs/NFs (purple triangle). C/D showed the co-culture of heterologous TILs and CAFs (C)/NFs (D) for 24 hours. The results show some fibroblasts with nuclear condensation and fragmentation (purple triangle). White triangles indicate the TILs. The nuclei were stained by DAPI (blue) and TILs (C/D) were labeled with CFDA-SE (green). A, B, C, D 200-fold. 2): The representative figures (E/F/G) of cell cycle and apoptosis illustrate the fate of CAFs/NFs co-cultured with TILs (120 hours) and PBMC (24 hours). E demonstrates that almost all of the CAFs and NFs were arrested in the G2/M phase when co-cultured with homologous TILs. F is the positive control, displaying CAFs/NFs apoptosis when co-cultured with heterologous PBMC. G, as a normal control, is the cell cycle of mono-cultured fibroblasts.
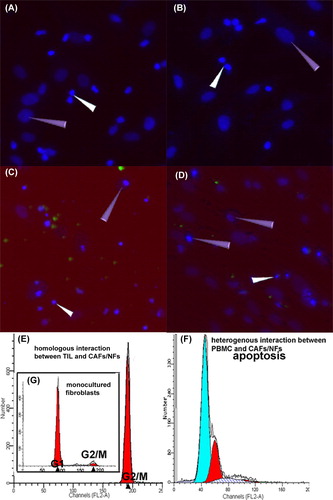
We analyzed the cell cycle progression and apoptosis using FCM via PI staining to further study the cell fate of CAFs/NFs in a co-culture system. We found that almost all of the CAFs and NFs co-cultured with homologous TILs were arrested in the G0/G1 phase (), and apoptosis was not observed in the assay. Apoptosis was only observed in the CAFs/NFs co-cultured with heterologous peripheral blood mononuclear cells (PBMC; shown in ).
These results demonstrate that the suppressive effect of the TILs in the homologous co-culture system was not caused by the reduction in the number of CAFs/NFs (via apoptosis or death) but by the biological activity and proliferation of CAFs/NFs, which were also regulated by the TILs and their secretions.
Discussion
Balkwill [Citation25] concluded that many kinds of cancer possess their own complex chemokine networks that regulate the infiltration of immune cells into tumor tissues. The presence of numerous infiltrating lymphocytes in breast cancer tissues was induced by the chemokines from the cancer cells [Citation25]. However, the dynamic lymphocyte tracer experiments conducted by Egeblad et al. [Citation26] demonstrated that the lymphocytes travel through the vasculature and invade the stroma but rarely intrude into tumor cell clusters. Consistent with the study by Egeblad, our in situ assessment using CD3 showed that TILs abnormally accumulate in tumor tissues and mainly in tumor stroma (except medullary breast cancer; ). This feature was found both in ductal carcinoma and in invasive breast cancer. Another noteworthy finding is the presence of large amounts of Tregs mixed with CAFs in the cancer stroma (, green). Therefore, the actual distribution of immune cells in tumor tissues revealed a new problem. If the chemokines from the cancer cells were responsible for TILs infiltration, TILs theoretically should infiltrate into cancer cell colonies. However, our data and those of Egeblad demonstrate it was not the case. This suggests a closer relationship between the TILs/Tregs and the tumor stromal fibroblasts.
CAFs are the most abundant cells in solid carcinoma stroma [Citation22]. NFs are gradually activated by the TME, and obtain cancer-promoting functions [Citation27,Citation28]. These cells are called CAFs. Previous researches demonstrated that CAFs promote the proliferation and survival of tumor cells by producing growth factors and extracellular matrix proteins [Citation16,Citation29,Citation30]. Liao [Citation15] and Erez [Citation5] both demonstrated that CAFs promote cancer progression by inducing tumor- promoting inflammation. Interestingly, one research conducted by Beacham et al. [Citation31] showed that the activation of CAFs is an irreversible transformation. Though there was no enough evidence in our study to verify the irreversibility of the transformation, our data showed that after experiencing less than eight passages, primary cultured CAFs were still able to maintain the expression of activation markers like α-SMA (). This indicates that after several passages in vitro, the CAFs were still capable of maintaining the similar biological traits as their counterparts in vivo, which facilitated our further study.
In the recent decades, the immunosuppressive state in tumors tissue has been confirmed by many studies [Citation14], and it has been proven that the immunosuppressive state in tumors promotes cancer progression [Citation32]. Many mechanisms were involved in the induction of immunosuppression in TME, including the immunosuppressive effect of Foxp3+ Tregs in carcinoma tissue. Given that Tregs are mainly distributed in cancer stroma and mixed with CAFs and Tregs played important roles in TME, a question was raised regarding the relationship between the Tregs-rich TILs and CAFs. At present, the question still exists because there is so little evidence on illustrating the interaction.
Aside from detecting a large number of Foxp3+ Tregs mixed with CAFs in tumor stroma via immunohistochemistry, we also conducted evaluations on primary cultured TILs through FCM and found that 71.06% ± 8.18% of the TILs were CD4+ CD25+ Tregs. Previously, an average Tregs/TILs ratio of 20% in breast cancer was detected in the study by Liyanage [Citation24]. In our study, the results show a much higher percentage of Tregs in the TILs. Considering Tregs are immunosuppressive cells, the higher percentage they possess in the TILs, the stronger suppressive effect they exert in immune response. Therefore, excessive Tregs have a significant impact on both the TME and the cells in the TME.
Based on the above results and question, the factorial design experiment was carried out to study the possible interactions among homologous TILs, CAFs, and NFs in vitro. The evaluation of TILs/CAFs or TILs/CAFs/NFs in a co-culture system and the statistical analysis () depicted an astonishing result: CAFs and NFs were remarkably inhibited by Tregs-rich TILs. The data from the statistical analysis simultaneously proved the interaction between CAFs and NFs (: p = 0.006 and p = 0.000). On the other hand, the data of indirect interaction experiment suggest that the suppressive effect of the TILs may be mediated by the cytokines from the Tregs-rich TILs. TILs/CAFs/NFs were homologous cells obtained from the same patient. Therefore, there was theoretically no immune rejection among them. The observation on apoptosis or death in the co-culture system confirmed this conclusion (). Cell cycle and apoptosis analyses by FCM further disclosed that CAFs/NFs co- cultured with homologous TILs were made to arrest in G2/M (). These results imply that the reduction of OD in interactive experiments was not caused by the decreased CAFs/NFs number, but by the decreased cell activity and proliferation elicited by the interaction among different types of cells in the co-culture system.
Given these findings, the regional Tregs-rich TILs also exerted a significant inhibitory effect on their adjacent CAFs and NFs via paracrine and cell-cell contact, which is similar to the influence that cancer cells impose on CAFs and NFs. In addition, the interaction between CAFs and NFs implied that CAFs also influenced their normal neighboring fibroblasts. These results suggest that the changing of TME and the remodeling of tumor structure are greatly affected by the mutual interactions among cancer cells, CAFs, and immune cells in the TME.
We may also speculate that in the TME, cancer cells induce the infiltration of TILs by secreting chemokines and trained fibroblasts into CAFs at the same time. In turn, CAFs and TILs jointly promoted the progression and transformation of tumor cells via paracrine and cell-cell contact. On the other hand, the stromal structure of tumor is affected by CAFs, which are suppressed by TILs. This implies that the suppressing effect of TILs was one of the causes of tumor stromal remodeling. In turn, the stromal remodeling modified tumor environment. Considering the interaction between TILs and NFs or CAFs and NFs, TILs and CAFs might jointly affect the NFs in the adjacent tissues of cancer. This provides the appropriate external conditions for regional tumor invasion and boosts tumor progression.
Medullary breast carcinoma is marked by abundant lymphocytes in and around the tumor and the absence of cancer stroma [Citation33,Citation34]. The suppressing effect of TILs on the CAFs might potentially cause the absence of stroma in medullary breast carcinoma. Undoubtedly, the interactions among the various cell types are a very sophisticated process and further study is needed to elucidate the underlying mechanisms.
Acknowledgments
We thank Jiaping Peng, Jin Chunna, ShanWei Wang for their technical support in pathology. We thank Dan Long for his assistance in data statistics. We also thank Qi Dong, Jiawei Zhang and Weiting Ge for their help in Laser Confocal technology and flow cytometry. This work was supported by grant from the National Natural Science Foundation of China (No. 30973382, No. 81101477), and grant from Zhejiang Provincial Nature Science Foundation of China (No. R2090353, No. Y2110018).
Declaration of interest: The authors report no conflicts of interest. The authors alone are responsible for the content and writing of the paper.
References
- Bissell MJ, Hall HG, Parry G. How does the extracellular matrix direct gene expression. J Theor Biol 1982;99: 31–68.
- Greiff AH, Fischer WM, Sehgal I. Paracrine communication between malignant and non-malignant prostate epithelial cells in culture alters growth rate, matrix protease secretion and in vitro invasion. Clin Exp Metastasis 2002;19: 727–33.
- Hanahan D, Weinberg RA. Hallmarks of cancer: The next generation. Cell 2011;144:646–74.
- Hanahan D, Coussens LM. Accessories to the crime: Functions of cells recruited to the tumor microenvironment. Cancer Cell 2012;21:309–22.
- Erez N, Truitt M, Olson P, Arron ST, Hanahan D. Cancer-associated fibroblasts are activated in incipient neoplasia to orchestrate tumor-promoting inflammation in an NF-kappaB-dependent manner. Cancer Cell 2010;17: 135–47.
- Giannoni E, Bianchini F, Masieri L, Serni S, Torre E, Calorini L, et al. Reciprocal activation of prostate cancer cells and cancer-associated fibroblasts stimulates epithelial- mesenchymal transition and cancer stemness. Cancer Res 2010;70:6945–56.
- Dvorak HF. Tumors: Wounds that do not heal. Similarities between tumor stroma generation and wound healing. N Engl J Med 1986;315:1650–9.
- Hwang RF, Moore T, Arumugam T, Ramachandran V, Amos KD, Rivera A, et al. Cancer-associated stromal fibroblasts promote pancreatic tumor progression. Cancer Res 2008; 68:918–26.
- Hinz B, Phan SH, Thannickal VJ, Prunotto M, Desmoulière A, Varga J, et al. Recent developments in myofibroblast biology: Paradigms for connective tissue remodeling. Am J Pathol 2012;180:1340–55.
- Spano D, Zollo M. Tumor microenvironment: A main actor in the metastasis process. Clin Exp Metastasis 2012;29: 381–95.
- Payne SJ, Jones L. Influence of the tumor microenvironment on angiogenesis. Future Oncol 2011;7:395–408.
- Tyan SW, Kuo WH, Huang CK, Pan CC, Shew JY, Chang KJ, et al. Breast cancer cells induce cancer-associated fibroblasts to secrete hepatocyte growth factor to enhance breast tumorigenesis. PLOS One 2011;6:e15313.
- Whitford P, Mallon EA, George WD, Campbell AM. Flow cytometric analysis of tumour infiltrating lymphocytes in breast cancer. Br J Cancer 1990;62:971–5.
- Kim R, Emi M, Tanabe K. Cancer immunosuppression and autoimmune disease: Beyond immunosuppressive networks for tumour immunity. Immunology 2006;119:254–64.
- Liao D, Luo Y, Markowitz D, Xiang R, Reisfeld RA. Cancer associated fibroblasts promote tumor growth and metastasis by modulating the tumor immune microenvironment in a 4T1 murine breast cancer model. PLOS One 2009; 4:e7965.
- Shimoda M, Mellody KT, Orimo A. Carcinoma-associated fibroblasts are a rate-limiting determinant for tumour progression. Semin Cell Dev Biol 2010;21:19–25.
- Polyak K, Haviv I, Campbell IG. Co-evolution of tumor cells and their microenvironment. Trends Genet 2009;25:30–8.
- Ward JM, Erexson CR, Faucette LJ, Foley JF, Dijkstra C, Cattoretti G. Immunohistochemical markers for the rodent immune system. Toxicol Pathol 2006;34:616–30.
- de Boer OJ, der Loos CM, Teeling P, der Wal AC, Teunissen MB. Immunohistochemical analysis of regulatory T cell markers FOXP3 and GITR onCD4 + CD25+ T cells in normal skin and inflammatory dermatoses. J Histochem Cytochem 2007;55:891–8.
- Zhou L, Lopes JE, Chong MM, Ivanov II, Min R, Victora GD, et al. TGF-beta-induced Foxp3 inhibits T(H)17 cell differentiation by antagonizing ROR gammat function. Nature 2008;453:236–40.
- Mercier I, Casimiro MC, Wang C, Rosenberg AL, Quong J, Minkeu A, et al. Human breast cancer-associated fibroblasts (CAFs) show caveolin-1 downregulation and RB tumor suppressor functional inactivation: Implications for the response to hormonal therapy. Cancer Biol Ther 2008;7:1212–25.
- Yokokawa J, Cereda V, Remondo C, Gulley JL, Arlen PM, Schlom J, et al. Enhanced functionality of CD4 + CD25(high)FoxP3 + regulatory T cells in the peripheral blood of patients with prostate cancer. Clin Cancer Res 2008;14:1032–40.
- Kalluri R, Zeisberg M. Fibroblasts in cancer. Nat Rev Cancer 2006;6:392–401.
- Liyanage UK, Moore TT, Joo HG, Tanaka Y, Herrmann V, Doherty G, et al. Prevalence of regulatory T cells is increased in peripheral blood and tumor microenvironment of patients with pancreas or breast adenocarcinoma. J Immunol 2002; 169:2756–61.
- Balkwill F. Cancer and the chemokine network. Nat Rev Cancer 2004;4:540–50.
- Egeblad M, Ewald AJ, Askautrud HA, Truitt ML, Welm BE, Bainbridge E, et al. Visualizing stromal cell dynamics in different tumor microenvironments by spinning disk confocal microscopy. Dis Model Mech 2008;1:155–67; discussion 165.
- Aboussekhra A. Role of cancer-associated fibroblasts in breast cancer development and prognosis. Int J Dev Biol 2011;55:841–9.
- Liao D, Luo Y, Markowitz D, Xiang R, Reisfeld RA. Cancer associated fibroblasts promote tumor growth and metastasis by modulating the tumor immune microenvironment in a 4T1 murine breast cancer model. PLOS One 2009;4:e7965.
- Zhi K, Shen X, Zhang H, Bi J. Cancer-associated fibroblasts are positively correlated with metastatic potential of human gastric cancers. J Exp Clin Cancer Res 2010;29:66.
- Jedeszko C, Victor BC, Podgorski I, Sloane BF. Fibroblast hepatocyte growth factor promotes invasion of human mammary ductal carcinoma in situ. Cancer Res 2009;69:9148–55.
- Beacham DA, Cukierman E. Stromagenesis: The changing face of fibroblastic microenvironments during tumor progression. Semin Cancer Biol 2005;15:329–41.
- Zamarron BF, Chen W. Dual roles of immune cells and their factors in cancer development and progression. Int J Biol Sci 2011;7:651–8.
- Anz D, Eiber S, Scholz C, Endres S, Kirchner T, Bourquin C, et al. In breast cancer, a high ratio of tumour-infiltrating intraepithelial CD8 + to FoxP3 + cells is characteristic for the medullary subtype. Histopathology 2011; 59:965–74.
- Marginean F, Rakha EA, Ho BC, Ellis IO, Lee AH. Histological features of medullary carcinoma and prognosis in triple-negative basal-like carcinomas of the breast. Mod Pathol 2010;23:1357–63.