
Abstract
Background. A high fraction of stroma in malignant tissues is associated with tumor progression, metastasis, and poor prognosis. Possible correlations between the stromal and physiologic microenvironments of tumors and the potential of dynamic contrast-enhanced (DCE) and diffusion-weighted (DW) magnetic resonance imaging (MRI) in quantification of the stromal microenvironment were investigated in this study. Material and methods. CK-160 cervical carcinoma xenografts were used as preclinical tumor model. A total of 43 tumors were included in the study, and of these tumors, 17 were used to search for correlations between the stromal and physiologic microenvironments, 11 were subjected to DCE-MRI, and 15 were subjected to DW-MRI. DCE-MRI and DW-MRI were carried out at 1.5 T with a clinical MR scanner and a slotted tube resonator transceiver coil constructed for mice. Fraction of connective tissue (CTFCol) and fraction of hypoxic tissue (HFPim) were determined by immunohistochemistry. A Millar SPC 320 catheter was used to measure tumor interstitial fluid pressure (IFP). Results. CTFCol showed a positive correlation to IFP and an inverse correlation to HFPim. The apparent diffusion coefficient assessed by DW-MRI was inversely correlated to CTFCol, whereas no correlation was found between DCE-MRI-derived parameters and CTFCol. Conclusion. DW-MRI is a potentially useful method for characterizing the stromal microenvironment of tumors.
Tumor tissues consist of a compartment of malignant parenchymal cells and a compartment of supporting connective tissue, or stroma. The stroma exhibits blood vessels, immune cells, and activated connective tissue cells, primarily cancer-associated fibroblasts [Citation1]. Together with the parenchymal cells, the stromal cells produce a fibrotic extracellular matrix that provides a scaffold for tumor growth. In addition to its supportive structural role, the extracellular matrix acts as a reservoir for growth factors, influences cell signaling, directs angiogenesis, and guides cell migration [Citation2]. A high level of collagen and other extracellular matrix proteins has been documented to be a barrier to the transport of chemotherapeutic agents in tumor tissues [Citation3,Citation4] and has been shown to be associated with progession, metastasis, and poor prognosis in several histologic types of cancer [Citation5–7].
Interactions between the parenchymal tumor cells and their stromal microenvironment lead to uncontrolled neovascularization and the development of an abnormal microvasculature and a metabolic and physiologic microenvironment characterized by nutrient deprivation, hypoxia, acidosis, and interstitial hypertension [Citation8]. These microenvironmental abnormalities may cause genomic instability and promote malignant progression in tumor tissues [Citation9–11]. Preclinical studies have revealed that metastatic dissemination and resistance to radiation treatment may be a consequence of tumor hypoxia [Citation12,Citation13] and interstitial hypertension [Citation14–17]. Clinical investigations have shown that low oxygen tension in the primary tumor is associated with locoregional treatment failure, development of metastatic disease, and poor disease-free and overall survival rates in several malignant diseases [Citation18,Citation19]. Studies of patients with advanced cervical cancer have revealed that high interstitial fluid pressure (IFP) in the primary tumor is linked to high incidence of distant metastases and pelvic recurrence after radiation treatment with curative intent [Citation20,Citation21].
Cancer patients having developed tumors with significant microenvironmental abnormalities may benefit from particularly aggressive treatment. Imaging methods for non-invasive characterization of the microenvironment of tumors are therefore urgently needed. Preclinical studies have revealed that dynamic contrast-enhanced (DCE) and diffusion-weighted (DW) magnetic resonance imaging (MRI) may provide valuable information on the physiologic microenvironment of tumors [Citation22–27]. Significant correlations have been found between DCE-MRI-derived parametric images and extent of hypoxia and interstitial hypertension [Citation22–24] and between DW-MRI-derived parametric images and cell density and extent of necrosis [Citation25–27]. Clinical investigations of patients with cervical carcinoma and other malignant diseases have given results consistent with these preclinical observations [Citation28–33].
However, studies of parameters of the stromal microenvironment of tumors and their relationship to parameters of the physiologic microenvironment are sparse [Citation34,Citation35]. The aim of the present study was to investigate whether the fraction of connective tissue in tumors may be associated with the fraction of hypoxic tissue and/or the IFP and, furthermore, whether the fraction of connective tissue can be assessed by gadolinium diethylene-triamine penta-acetic acid (Gd-DTPA)-based DCE-MRI and/or DW-MRI.
Material and methods
Tumor model
CK-160 human cervical carcinoma xenografts growing in adult female BALB/c nu/nu mice were used as tumor model. The CK-160 line was established from a pelvic lymph node metastasis of 65-year-old woman with FIGO stage IIB squamous cell carcinoma of the uterine cervix [Citation36]. Tumors were initiated from cells cultured in RPMI-1640 (25 mmol/l HEPES and L-glutamine) medium supplemented with 13% bovine calf serum, 250 mg/l penicillin, and 50 mg/l streptomycin. Approximately 5.0 × 10⁵ cells in 10 μl of Hanks’ balanced salt solution were inoculated in the gastrocnemius muscle. Tumors with volumes of 100 800 mm3 were included in the study. MRI and IFP measurements were carried out with mice anesthetized with fentanyl citrate (0.63 mg/kg), fluanisone (20 mg/kg), and midazolam (10 mg/kg). Animal care and experimental procedures were in accordance with the Interdisciplinary Principles and Guidelines for the Use of Animals in Research, Marketing, and Education (New York Academy of Sciences, New York, NY, USA).
MRI
MRI was performed by using a 1.5-T whole-body clinical scanner (Signa; General Electric, Milwaukee, WI, USA) and a slotted tube resonator transceiver coil constructed for mice. The coil was insulated with styrofoam to prevent excessive heat loss from the animals. The body core temperature of the mice was kept at 37–38°C during imaging by using a thermostatically regulated heating pad. The tumors were positioned in the isocenter of the magnet and were imaged axially in a single section through the tumor center.
DCE-MRI was carried out as described earlier [Citation37]. Gd-DTPA (Schering, Berlin, Germany) was diluted in 0.9% saline to a concentration of 0.06 M and administered in the tail vein in a bolus dose of 5.0 ml/kg (0.3 mmol/kg), corresponding to an injection volume of 0.12 0.15 ml. The administration was performed manually during a period of 5 s after the mice had been placed in the MR scanner by using a 24 G-neoflon connected to a syringe by a polyethylene tubing. T1-weighted images (TR = 200 ms, TE = 3.2 ms, and αT1 = 80°) were recorded at a spatial resolution of 0.23 × 0.23 × 2.0 mm3 and a time resolution of 14 s by using a spoiled gradient recalled sequence. Two calibration tubes, one with 0.5 mmol/l Gd-DTPA in 0.9% saline and the other with 0.9% saline only, were placed adjacent to the mice in the coil. The DCE-MRI was carried out by using an image matrix of 256 × 128, a field of view of 6 × 3 cm2, and one excitation. Two proton density images (TR = 900 ms, TE = 3.2 ms, and αPD = 20°) and three T1-weighted images were acquired before Gd-DTPA was administered, and T1-weighted images were recorded for 15 min after the administration of Gd-DTPA. Gd-DTPA concentrations were calculated from signal intensities by using the method of Hittmair et al. [Citation38]. The DCE-MRI series were analyzed on a voxel-by-voxel basis by using the arterial input function of Benjaminsen et al. [Citation37] and the Tofts pharmacokinetic model [Citation39] to produce parametric images of Ktrans (the volume transfer constant of the contrast agent between the blood plasma and the extravascular extracellular space) and ve (the distribution volume of the contrast agent per unit volume of tissue). Images of IAUGC (initial area under Gd-DTPA curve) and kep (the rate constant of the contrast agent between the extravascular extracellular space and the blood plasma) were produced by using a procedure similar to that described by Zahra et al. [Citation40]. It was verified that the Tofts pharmacokinetic model gave good curve fits to the experimental data, consistent with our previous studies of CK-160 tumors [Citation41]. Attempts were also made to analyze the DCE-MRI data by using the extended Tofts pharmacokinetic model, which includes the blood volume fraction (Vb) as a parameter in addition to Ktrans and ve [Citation39]. However, in agreement with previous observations [Citation42], the temporal resolution of our DCE-MRI series was found to be too low to allow reliable assessment of Vb. The strengths and limitations of our DCE-MRI method have been discussed elsewhere [Citation37,Citation43].
DW-MRI was carried out by applying a diffusion-weighted single-shot fast spin echo sequence with ETL = 84 and TR = 5002 ms. The diffusion-weighted images were recorded at a spatial resolution of 0.39 × 0.39 × 2.0 mm3 by using an image matrix of 256 × 256, a field of view of 10 × 10 cm2, and 10 excitations. Diffusion sensitization gradients were applied in six non-collinear directions with the following x, y, and z physical gradient combinations: [1 0 1], [− 1 0 1], [0 1 1], [0 1 1], [1 1 0], [− 1 1 0]. Five different diffusion-weightings with diffusion encoding constants of b = 200, 400, 600, 800, and 1000 s/mm2 and corresponding echo times of TE = 85, 95.5, 103, 108.9, and 113.9 ms were used to determine ADC. An image without diffusion weighting (b = 0) was recorded for each TE value to compensate for the different TEs associated with the different b values. The b = 0 images were not included in the calculation of ADC. The total scan time of our DW-MRI method was ˜27 min.
Maps of the apparent diffusion coefficient (ADC) were produced with in-house-made software developed in Matlab. Briefly, the directional diffusion images were averaged on a voxel-by-voxel basis to non-directional diffusion images. ADC values were calculated for each voxel by fitting signal intensities (S) to the mono-exponential model equation:
by using a linear least square fit algorithm. A mono-exponential model and b values from 200 to 1000 s/mm2 were chosen to avoid confounding effects of perfusion, as recommended by Padhani et al. [Citation44]. The signal decay of a large number of voxels was investigated to verify that the mono-exponential model gave good fits to the data. The fits generally had a correlation coefficient of 0.98 0.99.
Preparation of histologic sections from imaged tumors
To search for spatial correlations between parametric MR images and tumor histology, histologic sections were prepared from the scanned cross-sections of imaged tumors. We marked off the central axial scan on the tumors with a felt-tip pen and euthanized the mice immediately after imaging. The tumors were then cut into two halves along the scan, resected, and fixed in liquid N2. Histologic sections, separated by ˜ 400 μm, were cut from the central axial tumor plane, corresponding to the 2-mm-thick MR scan.
Histologic analyses
Histologic sections were immunostained for connective tissue or hypoxia by using a peroxidase-based indirect staining method [Citation45]. An anti-collagen rabbit polyclonal antibody (Dako, Glostrup, Denmark) or an anti-pimonidazole rabbit polyclonal antibody (gift from Professor Raleigh, University of North Carolina) was used as primary antibody. Diaminobenzidine was used as chromogen, and hematoxylin was used for counterstaining. Three whole cross-sections were examined at high magnification for each tumor. The area fractions of the tumor tissue staining positive for collagen or pimonidazole were determined by image analysis and used as parameters for connective tissue fraction (CTFCol) and hypoxic fraction (HFPim), respectively [Citation45].
Interstitial fluid pressure
IFP was measured in the center of the tumors with a Millar SPC 320 catheter equipped with a 2F Mikro-Tip transducer (Millar Instruments, Houston, TX, USA) [Citation46]. Marks on the catheter assured correct positioning of the sensor, and a single measurement was carried out in each tumor. The catheter was connected to a computer via a Millar TC-510 control unit and a preamplifier. Data acquisition was carried out by using the LabVIEW software (National Instruments, Austin, TX, USA). By measuring the IFP in the same tumors twice, we have shown that this method produces highly reproducible IFP values [Citation24].
Statistical analysis
Curves were fitted to data by regression analysis. The Pearson product moment correlation test was used to search for correlations between parameters. Probability values (p) and correlation coefficients (R2) were calculated by using the SigmaStat statistical software (SPSS Science, Chicago, IL, USA). A significance criterion of p < 0.05 was used.
Results
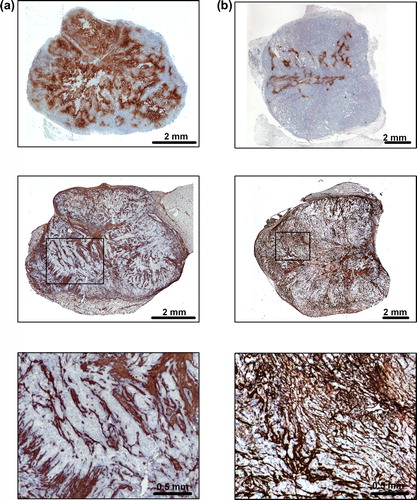
Individual CK-160 tumors differed substantially in HFPim and CTFCol and, generally, tumors with high HFPim showed low CTFCol and vice versa. This is illustrated in , which shows immunohistochemical preparations of a tumor with high HFPim and low CTFCol () and a tumor with low HFPim and high CTFCol ().
Figure 1. Immunohistochemical preparations of (a) a CK-160 tumor with high HFPim and low CTFCol and (b) a CK-160 tumor with low HFPim and high CTFCol. Upper panels: pimonidazole staining of tumor hypoxia. Middle panels: collagen staining of tumor connective tissue. Lower panels: high magnification images referring to the boxes shown in the middle panels.
Associations between CTFCol and the physiologic microenvironment of CK-160 tumors were searched for by measuring IFP in 17 tumors before the tumors were resected and prepared for immunohistochemical assessment of CTFCol and HFPim. A significant positive correlation was found between CTFCol and IFP (p = 0.00047; R2 = 0.57; ), and a significant inverse correlation was found between CTFCol and HFPim (p = 0.0016; R2 = 0.50; ).
Figure 2. Plots of (a) CTFCol versus IFP and (b) CTFCol versus HFPim for CK-160 tumors. Points represent single tumors. Curves were fitted to the data by linear regression analysis.
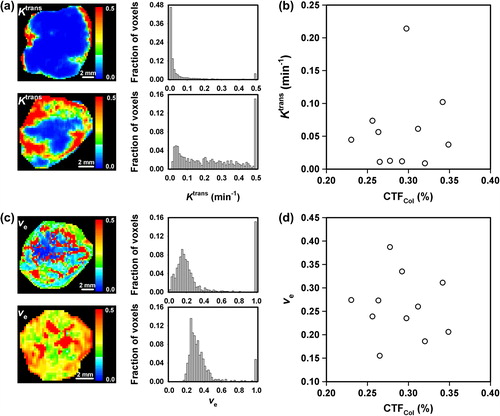
To investigate whether the fraction of connective tissue in CK-160 tumors can be determined by DCE-MRI, 11 tumors were subjected to DCE-MRI before the CTFCol of the tumors was assessed by analysis of immunohistochemical preparations. Ktrans and ve differed substantially among individual tumors. This is illustrated in , which shows the Ktrans images and frequency distributions of a tumor with low Ktrans values and a tumor with high Ktrans values, and in , which shows the ve images and frequency distributions of a tumor with low ve values and a tumor with high ve values. There was no correlation between Ktrans and CTFCol or between ve and CTFCol. This is illustrated in , which shows a plot of median Ktrans versus CTFCol (p > 0.05), and in , which shows a plot of median ve versus CTFCol (p > 0.05). Furthermore, neither IAUGC nor kep showed a significant correlation to CTFCol (data not shown).
Figure 3. Examples of (a) Ktrans images and frequency distributions of CK-160 tumors with low (top) and high (bottom) Ktrans values and (b) ve images and frequency distributions of CK-160 tumors with low (top) and high (bottom) ve values, and plots of (c) median Ktrans versus CTFCol and (d) median ve versus CTFCol for CK-160 tumors. Points represent single tumors.
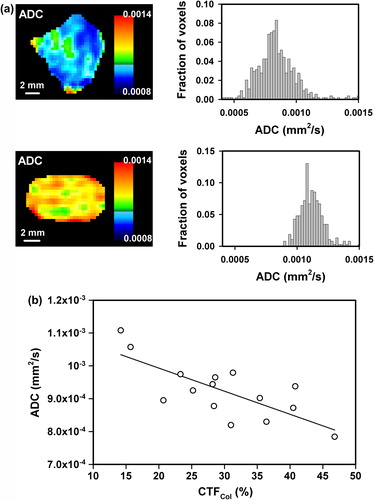
To investigate whether DW-MRI can provide information on the fraction of connective tissue in CK-160 tumors, 15 tumors were subjected to DW-MRI and subsequent immunohistochemical assessment of CTFCol. Individual tumors differed substantially in ADC, as illustrated in , which shows the ADC maps and frequency distributions of two tumors, one with low ADC values and the other with high ADC values. There was a significant inverse correlation between ADC and CTFCol, as illustrated in , which shows a plot of median ADC versus CTFCol (p = 0.0013; R2 = 0.56). However, spatial correlation between ADC and CTFCol could not be detected, most likely because of significant heterogeneity in CTFCol within voxels.
Figure 4. Examples of ADC images and frequency distributions of CK-160 tumors with low (top) and high (bottom) ADC values (a), and a plot of median ADC versus CTFCol for CK-160 tumors (b). Points represent single tumors. The curve was fitted to the data by linear regression analysis.
The CK-160 tumors included in the experiments described above differed in volume from ˜100 mm3 to ˜800 mm3. There was no significant correlation between tumor volume and CTFCol, HFPim, IFP, Ktrans, ve, IAUGC, kep, or ADC (data not shown), implying that the intertumor heterogeneity in these parameters cannot be explained by differences in tumor size.
Discussion
A tumor line showing significant intertumor heterogeneity in fraction of connective tissue, fraction of hypoxic tissue, and interstitial hypertension is required to answer the questions addressed in the present communication. These requirements were fulfilled by the CK-160 cervical carcinoma xenograft line. Furthermore, it has been shown that CK-160 xenografts retain several biologic properties of the donor patient's tumor, including radioresponsiveness and metastatic pattern and propensity [Citation36]. Consequently, CK-160 tumors should be excellent preclinical models for studying relationships between the stromal and physiologic microenvironments of tumors as well as for investigating the potential of DCE-MRI and DW-MRI as non-invasive methods for quantifying the fraction of stromal tissue.
However, it should be noticed that only the parenchyma of xenografted tumors is of human origin whereas the stroma is recruited from the host animal and thus is of murine origin. Moreover, immune-deficient animals like BALB/c nu/nu mice do not show a normal inflammatory response, and the stromal conditions in tumors in such hosts may not necessarily be representative for spontaneous animal tumors or tumors in man. Thus, studies of pancreatic carcinoma have shown that the stroma of xenografted tumors may differ from that of human tumors and tumors in genetically engineered mouse models of this disease [Citation47,Citation48].
Interstitial hypertension in tumors is a result of high resistance to blood flow, low resistance to transcapillary fluid flow, decreased interstitial hydraulic conductivity, increased extracellular matrix contraction, and impaired lymphatic drainage [Citation49,Citation50]. The positive correlation between CTFCol and IFP observed here could be due to inhibition of fluid flow in the interstitium caused by a dense extracellular matrix and/or contraction of the extracellular matrix caused by connective tissue cells. There is significant evidence that tumor-associated fibroblasts may apply tensile forces on extracellular matrix fibers, an ability that is mediated by matrix-bound integrins in response to specific cytokines [Citation50]. Correlations between collagen density and IFP have also been observed in previous studies of experimental tumors [Citation35,Citation51].
Tumor hypoxia is a result of an imbalance between the rate of oxygen supply and the rate of oxygen consumption [Citation52]. The inverse correlation between CTFCol and HFPim observed here was probably a consequence of an association between tumor microvessels and stroma. We have shown previously that the majority of the microvessels in CK-160 tumors are embedded in bands of connective tissue and that there is a positive correlation between the fraction of connective tissue and microvascular density [Citation53]. Most likely, HFPim increased with decreasing CTFCol because of an association beween CTFCol and microvascular density, implying that hypoxia in CK-160 tumors was primarily a result of inadequate microvascular density and, hence, inadequate blood and oxygen supply.
Few studies have searched for associations between DCE-MRI-derived parameters and the extent of connective tissue in tumors. Farace et al. [Citation54] used two contrast agents, Gd-DTPA and MS-325 (an albumin-binding contrast agent), and studied contrast-enhancement in two experimental tumor lines differing significantly in stromal content. They showed that high-molecular-weight contrast agents may be superior to low-molecular-weight contrast agents like Gd-DTPA in discriminating between tumors with sparse and extensive stroma.
Associations between CTFCol and Ktrans or ve were not found in the present study of CK-160 tumors. In a previous study of CK-160 tumors, we showed that the Ktrans of individual voxels consisting almost exclusively of connective tissue was significantly higher than the Ktrans of voxels consisting primarily of parenchymal tissue or necrotic tissue [Citation41]. In that study, it was concluded that the potential of parametric images of Ktrans or ve in providing information on the histomorphology of cervical carcinomas may be limited, mainly because the tumor tissue showed significant morphological heterogeneity at the subvoxel level. The study reported here is consistent with this conclusion and suggests that DCE-MRI may not be an adequate imaging method for quantitative assessment of the fraction of connective tissue in tumors unless imaging at a high signal-to-noise ratio can be carried out at a significantly increased spatial resolution.
However, a significant inverse correlation was found between ADC and CTFCol in CK-160 tumors, an observation suggesting that the movement of water molecules in the extracellular space was inhibited significantly by the connective tissue. This suggestion is consistent with studies of pancreatic carcinoma, which have revealed that tumors with dense fibrosis have lower ADC values than tumors with loose fibrosis [Citation55,Citation56]. Furthermore, similar to the present observation, Aoyagi et al. [Citation57] found an inverse correlation between ADC and the density of stromal collagen in esophageal squamous cell carcinoma and concluded that ADC may be an important prognostic factor in esophageal cancer. It should be noticed that only two b values of 0 and 500 s/mm2 or 0 and 1000 s/mm2 were used in these clinical studies [Citation55–57]. Our study is consistent with the study of Aoyagi et al. [Citation57] and opens for the possibility that ADC values assessed by DW-MRI may have prognostic value also in cervical cancer. Interestingly, DW-MRI may not be the only MR method by which the fraction of connective tissue in tumors can be quantified. Significant correlations have been detected between parameters determined by magnetization transfer MRI and the fractional area of fibrotic tissue in pancreatic carcinoma xenografts [Citation34]. Furthermore, evidence has been provided that the quantity of connective tissue in breast carcinoma xenografts may be assessed by the use of fibrin-specific contrast agents [Citation58]. However, DW-MRI is already an established clinical method for characterizing malignant diseases and may thus be preferable to other non-invasive imaging methods.
There is significant evidence from preclinical and clinical studies involving tumors in several sites that ADC decreases with increasing cell density [Citation25,Citation32]. Moreover, it has been shown that treatment-induced tumor cell death results in increased ADC values, independent of treatment modality [Citation33,Citation59]. The observed associations between ADC and pre- and post-treatment tumor cellularity have led to the suggestion that ADC may be a useful biomarker for the outcome of cancer treatment [Citation59]. The observations reported here for CK-160 tumors are by no means inconsistent with this suggestion. Individual CK-160 tumors do not differ significantly in cell density, most likely because they are established from the same cell line [Citation41]. The fact that CK-160 tumors differ significantly in fraction of connective tissue but not in cell density makes them particularly suitable for studying associations between ADC and stromal content without severe confounding effects from other histomorphologic parameters. However, it should be noticed that necroses may influence the intertumor heterogeneity in median ADC in CK-160 tumors. It has been shown that individual CK-160 tumors may differ significantly in the density of small necrotic foci, as reflected by the intertumor heterogeneity in median ve [Citation41].
Cancer patients having developed tumors with a stromal microenvironment characterized by a high density of extracellular matrix fibers and a physiologic microenvironment characterized by extensive hypoxia and highly elevated IFP have poor prognosis and may benefit from particularly aggressive treatment [Citation5–7,Citation18–21]. Previous preclinical studies in our laboratory have revealed that DCE-MRI with Gd-DTPA as contrast agent may provide clinically useful information on the physiologic microenvironment of tumors. Those studies demonstrated that tumors with low values of Ktrans and ve are likely to be severely hypoxic [Citation22,Citation43] and to exhibit significant interstitial hypertension [Citation24]. The study reported here showed an inverse correlation between ADC and CTFcol, suggesting that DW-MRI may have the potential to provide valuable information on the stromal microenvironment of tumors. Furthermore, CTFCol was found to be positively correlated to IFP and inversely correlated to HFPim. It is thus possible that DCE-MRI and DW-MRI are imaging methods that may complement each other in characterizations of the microenvironment of tumors and jointly provide novel biomarkers of tumor aggressiveness.
This suggestion is consistent with initial clinical studies of locally advanced cervical cancer. Significant correlations have been found between DCE-MRI-derived parameters and hypoxia-associated parameters of the tumor tissue, including microvascular density and oxygen tension [Citation28,Citation60] and between tumor signal enhancement and outcome parameters, including rate of local control after radiation therapy and probability of disease-specific survival [Citation31,Citation40,Citation61,Citation62]. However, the correlations are generally weak, perhaps because the DCE-MRI was carried out under suboptimal conditions or because of inadequate analysis of the DCE-MRI series. Furthermore, there is significant evidence that DW-MRI may be useful in differentiating between malignant and benign cervical tissues, in detecting pelvic lymph node metastases, and in early detection of response to treatment [Citation33,Citation44,Citation59]. In patients treated with chemoradiotherapy, significant correlations have been found between treatment-induced changes in ADC and response to treatment as well as between ADC and rate of disease-free and overall survival [Citation63–65].
In summary, the present preclinical study provides significant evidence that DWI-MRI is superior to DCE-MRI as a non-invasive method for characterizing the stromal microenvironment of tumors. However, it should be noticed that our study has significant limitations. The main limitation is that the experiments were carried out on three different cohorts of tumor-bearing mice. Sequential DCE-MRI, DW-MRI, IFP measurement, and histologic examinations of the same tumors would have allowed a more comprehensive data analysis. However, our experimental strategy was chosen to avoid excessive experimental strain on the host animals.
Declaration of interest: The authors report no conflicts of interest. The authors alone are responsible for the content and writing of the paper.
Financial support was received from the Norwegian Cancer Society and the South-Eastern Norway Regional Health Authority.
References
- Liotta LA, Rao CN. Role of the extracellular matrix in cancer. Ann N Y Acad Sci 1985;460:333–44.
- Kim SH, Turnbull J, Guimond S. Extracellular matrix and cell signalling: The dynamic cooperation of integrin, proteoglycan and growth factor receptor. J Endocrinol 2011; 209:139–51.
- Netti PA, Berk DA, Swartz MA, Grodzinsky AJ, Jain RK. Role of extracellular matrix assembly in interstitial transport in solid tumors. Cancer Res 2000;60:2497–503.
- Chauhan VP, Stylianopoulos T, Boucher Y, Jain RK. Delivery of molecular and nanoscale medicine to tumors: Transport barriers and strategies. Annu Rev Chem Biomol Eng 2011;2:281–98.
- Ramaswamy S, Ross KN, Lander ES, Golub TR. A molecular signature of metastasis in primary solid tumors. Nat Genet 2003;33:49–54.
- Barkan D, Green JE, Chambers AF. Extracellular matrix: A gatekeeper in the transition from dormancy to metastatic growth. Eur J Cancer 2010;46:1181–8.
- Neesse A, Michl P, Frese KK, Feig C, Cook N, Jacobetz MA, et al. Stromal biology and therapy in pancreatic cancer. Gut 2011;60:861–8.
- Vaupel P, Kallinowski F, Okunieff P. Blood flow, oxygen and nutrient supply, and metabolic microenvironment of human tumors: A review. Cancer Res 1989;49:6449–65.
- Yuan J, Glazer PM. Mutagenesis induced by the tumor microenvironment. Mutat Res 1998;400:439–46.
- Höckel M, Vaupel P. Tumor hypoxia: Definitions and current clinical, biologic, and molecular aspects. J Natl Cancer Inst 2001;93:266–76.
- Subarsky P, Hill RP. The hypoxic tumour microenvironment and metastatic progression. Clin Exp Metastasis 2003;20: 237–50.
- Young SD, Marshall RS, Hill RP. Hypoxia induces DNA overreplication and enhances metastatic potential of murine tumor cells. Proc Natl Acad Sci USA 1988;85:9533–7.
- Powers WE, Tolmach LJ. A multicomponent X-ray survival curve for mouse lymphosarcoma cells irradiated in vivo. Nature 1963;197:710–1.
- Rofstad EK, Tunheim SH, Mathiesen B, Graff BA, Halsør EF, Nilsen K, et al. Pulmonary and lymph node metastasis is associated with primary tumor interstitial fluid pressure in human melanoma xenografts. Cancer Res 2002;62:661–4.
- Hompland T, Ellingsen C, Øvrebø KM, Rofstad EK. Interstitial fluid pressure and associated lymph node metastasis revealed in tumors by dynamic contrast-enhanced MRI. Cancer Res 2012;72:4899–908.
- Rofstad EK, Gaustad JV, Brurberg KG, Mathiesen B, Galappathi K, Simonsen TG. Radiocurability is associated with interstitial fluid pressure in human tumor xenografts. Neoplasia 2009;11:1243–51.
- Rofstad EK, Ruud EBM, Mathiesen B, Galappathi K. Associations between radiocurability and interstitial fluid pressure in human tumor xenografts without hypoxic tissue. Clin Cancer Res 2010;16:936–45.
- Nordsmark M, Bentzen SM, Rudat V, Brizel D, Lartigau E, Stadler P, et al. Prognostic value of tumor oxygenation in 397 head and neck tumors after primary radiation therapy. An international multi-center study. Radiother Oncol 2005;77: 18–24.
- Vaupel P, Mayer A. Hypoxia in cancer: Significance and impact on clinical outcome. Cancer Metastasis Rev 2007;26:225–39.
- Fyles A, Milosevic M, Pintilie M, Syed A, Levin W, Manchul L, et al. Long-term performance of interstitial fluid pressure and hypoxia as prognostic factors in cervix cancer. Radiother Oncol 2006;80:132–7.
- Yeo SG, Kim JS, Cho MJ, Kim KH, Kim JS. Interstitial fluid pressure as a prognostic factor in cervical cancer following radiation therapy. Clin Cancer Res 2009;15:6201–7.
- Gulliksrud K, Øvrebø KM, Mathiesen B, Rofstad EK. Differentiation between hypoxic and non-hypoxic experimental tumors by dynamic contrast-enhanced magnetic resonance imaging. Radiother Oncol 2011;98:360–4.
- Stoyanova R, Huang K, Sandler K, Cho HJ, Carlin S, Zanzonico PB, et al. Mapping tumor hypoxia in vivo using pattern recognition of dynamic contrast-enhanced MRI data. Transl Oncol 2012;5:437–47.
- Gulliksrud K, Brurberg KG, Rofstad EK. Dynamic contrast-enhanced magnetic resonance imaging of tumor interstitial fluid pressure. Radiother Oncol 2009;91:107–13.
- Lyng H, Haraldseth O, Rofstad EK. Measurement of cell density and necrotic fraction in human melanoma xenografts by diffusion weighted magnetic resonance imaging. Magn Reson Med 2000;43:828–36.
- Herneth AM, Guccione S, Bednarski M. Apparent diffusion coefficient: A quantitative parameter for in vivo tumor characterization. Eur J Radiol 2003;45:208–13.
- Huang MQ, Pickup S, Nelson DS, Qiao H, Xu HN, Li LZ, et al. Monitoring response to chemotherapy of non-Hodgkin's lymphoma xenografts by T2-weighted and diffusion-weighted MRI. NMR Biomed 2008;21:1021–9.
- Cooper RA, Carrington BM, Loncaster JA, Todd SM, Davidson SE, Logue JP, et al. Tumour oxygenation levels correlate with dynamic contrast-enhanced magnetic resonance imaging parameters in carcinoma of the cervix. Radiother Oncol 2000;57:53–9.
- Donaldson SB, Betts G, Bonington SC, Homer JJ, Slevin NJ, Kershaw LE, et al. Perfusion estimated with rapid dynamic contrast-enhanced magnetic resonance imaging correlates inversely with vascular endothelial growth factor expression and pimonidazole staining in head-and-neck cancer: A pilot study. Int J Radiat Oncol Biol Phys 2011;81:1176–83.
- Haider MA, Sitartchouk I, Roberts TPL, Fyles A, Hashmi AT, Milosevic M. Cor-relations between dynamic contrast-enhanced magnetic resonance imaging-derived measures of tumor microvasculature and interstitial fluid pressure in patients with cervical cancer. J Magn Reson Imaging 2007;25:153–9.
- Zahra MA, Hollingsworth KG, Sala E, Lomas DJ, Tan LT. Dynamic contrast-enhanced MRI as a predictor of tumour response to radiotherapy. Lancet Oncol 2007;8:63–74.
- Liu Y, Bai R, Sun H, Liu H, Wang D. Diffusion-weighted magnetic resonance imaging of uterine cervical cancer. J Comput Assist Tomogr 2009;33:858–62.
- Harry VN. Novel imaging techniques as response biomarkers in cervical cancer. Gynecol Oncol 2010;116:253–61.
- Li W, Zhang Z, Nicolai J, Yang GY, Omary RA, Larson AC. Magnetization transfer MRI in pancreatic cancer xenograft models. Magn Reson Med 2012;68:1291–7.
- Torosean S, Flynn B, Axelsson J, Gunn J, Samkoe KS, Hasan T, et al. Nanoparticle uptake in tumors is mediated by the interplay of vascular and collagen density with interstitial pressure. Nanomedicine Epub2012 Jul 25.
- Ellingsen C, Natvig I, Gaustad JV, Gulliksrud K, Egeland TAM, Rofstad EK. Human cervical carcinoma xenograft models for studies of the physiological microenvironment of tumors. J Cancer Res Clin Oncol 2009;135:1177–84.
- Benjaminsen IC, Graff BA, Brurberg KG, Rofstad EK. Assessment of tumor blood perfusion by high-resolution dynamic contrast-enhanced MRI: A preclinical study of human melanoma xenografts. Magn Reson Med 2004;52: 269–76.
- Hittmair K, Gomiscek G, Langenberger K, Recht M, Imhof H, Kramer J. Method for the quantitative assessment of contrast agent uptake in dynamic contrast-enhanced MRI. Magn Reson Med 1994;31:567–71.
- Tofts PS, Brix G, Buckley DL, Evelhoch JL, Henderson E, Larsson HB, et al. Estimating kinetic parameters from dynamic contrast-enhanced T1-weighted MRI of a diffusable tracer: Standardized quantities and symbols. J Magn Reson Imaging 1999;10:223–32.
- Zahra MA, Tan LT, Priest AN, Graves MJ, Arends M, Crawford RAF, et al. Semiquantitative and quantitative dynamic contrast-enhanced magnetic resonance imaging measurements predict radiation response in cervix cancer. Int J Radiat Oncol Biol Phys 2009;74:766–73.
- Ellingsen C, Egeland TAM, Galappathi K, Rofstad EK. Dynamic contrast-enhanced magnetic resonance imaging of human cervical carcinoma xenografts: Pharmacokinetic analysis and correlation to tumor histomorphology. Radiother Oncol 2010;97:217–24.
- Hompland T, Ellingsen C, Rofstad EK. Preclinical evaluation of Gd-DTPA and gadomelitol as contrast agents in DCE-MRI of cervical carcinoma interstitial fluid pressure. BMC Cancer 2012;12:544.
- Egeland TAM, Gulliksrud K, Gaustad JV, Mathiesen B, Rofstad EK. Dynamic contrast-enhanced MRI of tumor hypoxia. Magn Reson Med 2012;67:519–30.
- Padhani AR, Liu G, Mu-Koh D, Chenevert TL, Thoeny HC, Takahara T, et al. Diffusion-weighted magnetic resonance imaging as a cancer biomarker: Consensus and recommendations. Neoplasia 2009;2:102–25.
- Rofstad EK, Måseide K. Radiobiological and immunohistochemical assessment of hypoxia in human melanoma xenografts: Acute and chronic hypoxia in individual tumors. Int J Radiat Biol 1999;75:1377–93.
- Ozerdem U, Hargens AR. A simple method for measuring interstitial fluid pressure in cancer tissues. Microvasc Res 2005;70:116–20.
- Olive KP, Jacobetz MA, Davidson CJ, Gopinathan A, McIntyre D, Honess D, et al. Inhibition of hedgehog signaling enhances delivery of chemotherapy in a mouse model of pancreatic cancer. Science 2009;324:1457–61.
- Provenzano PP, Hingorani SR. Hyaluronan, fluid pressure, and stromal resistance in pancreas cancer. Br J Cancer 2013; 108:1–8.
- Lunt SJ, Fyles A, Hill RP, Milosevic M. Interstitial fluid pressure in tumors: Therapeutic barrier and biomarker of angiogenesis. Future Oncol 2008;4:793–802.
- Heldin CH, Rubin K, Pietras K, Östman A. High interstitial fluid pressure―an obstacle in cancer therapy. Nat Rev Cancer 2004;4:806–13.
- Kato M, Hattori Y, Kubo M, Maitani Y. Collagenase-1 injection improved tumor distribution and gene expression of cationic lipoplex. Int J Pharm 2012;423:428–34.
- Gulledge CJ, Dewhirst MW. Tumor oxygenation: A matter of supply and demand. Anticancer Res 1996;16:741–50.
- Ellingsen C, Øvrebø KM, Galappathi K, Mathiesen B, Rofstad EK. The pO2 fluctuation pattern and cycling hypoxia in human cervical carcinoma and melanoma xenografts. Int J Radiat Oncol Biol Phys 2012;83:1317–23.
- Farace P, Merigo F, Fiorini S, Nicolato E, Tambalo S, Daducci A, et al. DEC-MRI using small-molecular and albumin-binding contrast agents in experimental carcinomas with different stromal content. Eur J Radiol 2011;78:52–9.
- Muraoka N, Uematsu H, Kimura H, Imamura Y, Fujiwara Y, Murakami M, et al. Apparent diffusion coefficient in pancreatic cancer: Characterization and histopathological correlations. J Magn Reson Imaging 2008;27:1302–8.
- Wang Y, Chen ZE, Nikolaidis P, McCarthy RJ, Merrick L, Sternick LA, et al. Diffusion-weighted magnetic resonance imaging of pancreatic adenocarcinomas: Association with histopathology and tumor grade. J Magn Reson Imaging 2011;33:136–42.
- Aoyagi T, Shuto K, Okazumi S, Hayano K, Satoh A, Saitoh H, et al. Apparent diffusion coefficient correlation with oesophageal tumour stroma and angiogenesis. Eur Radiol 2012;22:1172–7.
- Uppal R, Medarova Z, Farrar CT, Dai G, Moore A, Caravan P. Molecular imaging of fibrin in a breast cancer xenograft mouse model. Invest Radiol 2012;47:553–8.
- Li SP, Padhani AR. Tumor response assessments with diffusion and perfusion MRI. J Magn Reson Imaging 2012;35: 745–63.
- Hawighorst H, Knapstein PG, Weikel W, Knopp MV, Zuna I, Knof A, et al. Angiogenesis of uterine cervical carcinoma: Characterization by pharmacokinetic magnetic resonance parameters and histological microvessel density with correlation to lymphatic involvement. Cancer Res 1997;57: 4777–86.
- Yuh WTC, Mayr NA, Jarjoura D, Wu D, Grecula JC, Lo SS, et al. Predicting control of primary tumor and survival by DCE MRI during early therapy in cervical cancer. Invest Radiol 2009;44:343–50.
- Mayr NA, Yuh WT, Jajoura D, Wang JZ, Lo SS, Montebello JF, et al. Ultra-early predictive assay for treatment failure using functional magnetic resonance imaging and clinical prognostic parameters in cervical cancer. Cancer 2010;116:903–12.
- Liu Y, Bai R, Sun H, Liu H, Li Y. Diffusion-weighted imaging in predicting and monitoring the response of uterine cervical cancer to combined chemoradiation. Clin Radiol 2009;64: 1067–74.
- Zhang Y, Chen JY, Xie CM, Mo YX, Liu XW, Liu Y, et al. Diffusion-weighted magnetic resonance imaging for prediction of response of advanced cervical cancer to chemoradiation. J Comput Assist Tomogr 2011;35:102–7.
- Nakamura K, Joja I, Kodama J, Hongo A, Hiramatsu Y. Measurement of SUVmax plus ADCmin of the primary tumour is a predictor of prognosis in patients with cervical cancer. Eur J Nucl Med Mol Imaging 2012;39:283–90.