Abstract
Background. Focal boosting of prostate tumours to improve outcome, requires accurate tumour delineation. For this, the apparent diffusion coefficient (ADC) derived from diffusion-weighted MR imaging (DWI) seems a useful tool. On voxel level, the relationship between ADC and histological presence of tumour is, however, ambiguous. Therefore, in this study the relationship between ADC and histological variables was investigated on voxel level to understand the strengths and limitations of DWI for prostate tumour delineation. Material and methods. Twelve radical prostatectomy patients underwent a pre-operative 3.0T DWI exam and the ADC was calculated. From whole-mount histological sections cell density and glandular area were retrieved for every voxel. The distribution of all variables was described for tumour, peripheral zone (PZ) and central gland (CG) on regional and voxel level. Correlations between variables and differences between regions were calculated. Results. Large heterogeneity of ADC on voxel level was observed within tumours, between tumours and between patients. This heterogeneity was reflected by the distribution of cell density and glandular area. On regional level, tumour was different from PZ having higher cell density (p = 0.007), less glandular area (p = 0.017) and lower ADCs (p = 0.017). ADC was correlated with glandular area (r = 0.402) and tumour volume (r = −0.608), but not with Gleason score. ADC tended to decrease with increasing cell density (r = −0.327, p = 0.073). On voxel level, correlations between ADC and histological variables varied among patients, for cell density ranging from r = −0.439 to r = 0.261 and for glandular area from r = 0.593 to r = 0.207. Conclusions. The variation in ADC can to a certain extent be explained by the variation in cell density and glandular area. The ADC is highly heterogeneous, which reflects the heterogeneity of malignant and benign prostate tissue. This heterogeneity might however obscure small tumours or parts of tumours. Therefore, DWI has to be used in the context of multiparametric MRI.
Dose escalation has proven to benefit treatment outcome in patients with prostate cancer [Citation1,Citation2]. However, increasing the dose to the entire prostate gland comes with the cost of more toxicity to organs at risk such as the rectum and bladder. As local recurrences frequently originate at the site of the macroscopic tumour, focal boost of the tumour area alone might improve tumour control [Citation3,Citation4]. Recently, a randomised phase III trial was started to investigate the benefit of focal lesion ablative microboost (FLAME trial) [Citation5].
An essential element of focal boosting is the accurate delineation of the tumour area. It has been widely established that magnetic resonance imaging (MRI) is the modality of choice to localise prostate tumours [Citation6,Citation7]. The diagnostic performance of MRI for prostate cancer detection has been shown to improve by the addition of diffusion-weighted imaging (DWI) and dynamic contrast-enhanced MRI (DCE-MRI) to conventional T2 weighted MRI [Citation8–10]. In a radiotherapy setting, however, target localisation puts higher demands on tumour detection accuracy. Every single voxel needs to be assigned to tumour or to normal prostate tissue to delineate the focal boost area accurately.
DWI is a powerful tool to identify high cellular tissue, like tumours [Citation11,Citation12]. For absolute quantification, the apparent diffusion coefficient (ADC) is derived. In prostate, the ADC is thought to be determined by both the amount of free water in the glandular ducts and the water diffusion restriction in the cellular tissue. Although several authors showed a relationship between ADC and cellularity on regional level, the reported correlation coefficients were merely weak to moderate [Citation11–14]. On voxel level, the relationship between ADC and histological presence of tumour is, however, even more ambiguous. Therefore, thresholding the ADC is inadequate for tumour delineation [Citation15]. To understand the limitations of DWI for tumour delineation, detailed analysis on voxel level is required to reveal the strong and weak points of DWI.
In the present study, we performed a detailed comparison between prostate histology and ADC maps, based on a robust and accurate MRI-pathology registration method. The distribution of ADC and histological variables cell density and relative glandular area was described on a voxel level. This was done for tumour areas, as well as for the normal tissues in peripheral zone (PZ) and central gland (CG).
Aim of this study was to reveal the relationship between ADC and histological variables on voxel level to understand the strengths and the limitations of DWI for prostate tumour delineation.
Patients and methods
Patients
The study was approved by the institutional review board and informed consent was obtained from all patients. Twelve patients were enrolled in the study. All patients had biopsy proven prostate cancer and were scheduled for a Robotic Assisted Laparoscopic Prostatectomy (RALP). Before radical prostatectomy, patients underwent a 3T MRI exam including a T2w sequence and DWI. For registration purposes afterwards, a urinary catheter was inserted before the MRI exam. Peristalsis was not suppressed. To prevent prostate deformations, no endorectal coil was used.
Two patients were excluded from analysis, because of large deformations of the diffusion-weighted images in one patient and because of considerable motion during image acquisition in the second patient. In one other patient, artefacts distorted a small part of the ADC map. This part was excluded from analysis and contained all the healthy PZ voxels. Tumour regions in the PZ of this patient were not affected. Ten patients were eligible for analysis ().
Table I. Patient characteristics.
MR imaging
MRI exams were performed on a 3T Philips Achieva MR scanner (Philips, Best, The Netherlands). T2w images were acquired with a fast spin-echo sequence, TR/TE = 8396/120 ms, echo train length 13, acquisition matrix 256 × 256, field of view (FOV) = 20 cm, slice thickness 3 mm, intersection gap 1 mm.
DWI scans were performed using a multislice single shot spin-echo echo-planar imaging (EPI) sequence (FOV = 380 × 320 mm2, acquisition matrix = 152 × 89, acquisition resolution = 2.5 × 3.5 mm2, slice thickness = 3 mm, number of slices = 60, intersection gap = 0 mm, TR/TE = 5000/54 ms, EPI-factor = 47, 3 averages, SENSE factor = 2, b-values 0, 300, 500 and 1000 s/mm2, in three orthogonal directions). ADC values were calculated after exclusion of the perfusion sensitive b = 0 data and resampled to an in-plane resolution of 2.5 × 2.5 mm2 [Citation16].
Histopathology
Immediately after prostatectomy, the left and right prostate surfaces were inked with different colours. The whole prostate was fixed in formaldehyde for approximately two days. Three carbon rods were inserted into the prostate to facilitate the registration process. Next, the prostate was cut into slices of 3 mm. Finally, whole-mount microscopic slices of 4 μm were cut from the paraffin embedded macroscopic slices and stained with haematoxylin-eosin (H&E). Tumour areas were delineated on the H&E sections by a pathologist. Each tumour region was assigned with a Gleason score in consensus by two observers. Digital photographs were taken of the macroscopic slices and the H&E stained sections including the delineations were digitised using a flatbed scanner (Epson Expression 10000XL).
MRI-pathology registration
MR images were registered to the H&E sections, as described by Groenendaal et al. [Citation17]. Three steps were performed: 1) registration of the H&E sections to the macroscopic slices; 2) reconstruction of the prostate specimen from the macroscopic slices; and 3) registration of the reconstructed prostate specimen to the T2w MR images. The protocol was optimised in the last five patients, where the prostate was first embedded in agarose gel to match for the sectioning plane of the prostate and the MRI plane. On average, the registration error in all patients was about 1 voxel (reconstructed voxel size 2.5 × 2.5 × 2.5 mm3) [Citation17].
Analysis of histological variables
Three microscopic slices per patient, containing the dominant tumour nodule and normal PZ and CG, were chosen for further analysis and digital whole slide images were created [Citation18]. Analysis of the cell density and glandular area was performed in a grid of 2.5 × 2.5 mm2, corresponding to the MRI voxels. The H&E sections were used for the determination of the cell density and glandular area. With the IHC Nuclear Algorithm v8 in ImageScope v10.0 (Aperio Technologies, Vista, CA, USA) the absolute number of cell nuclei per voxel was identified. Minimum detectable nuclear size was set at 20 μm2. Glandular area was defined as space without tissue, which predominantly comprised the lumens of glandular structures. The Positive Pixel Count Algorithm v9 was used to identify the relative glandular area per voxel.
Regional analysis
Healthy PZ, CG and tumours were defined as regions of interest (ROI) in each prostate. To account for the registration error and to prevent partial volume effects, a margin of approximately one voxel in the transverse plane was removed from the PZ and CG ROIs. As most tumour regions were too small to apply a margin, we did not apply a margin to tumour regions. Since partial volume effects and registration errors have a large influence on small tumours, we excluded tumour regions with a volume < 0.22 cm3 (diameter < three voxels = 7.5 mm). To investigate the correlation with Gleason score, regions within a tumour with a different Gleason score were separated into different ROIs.
Statistical analysis
On regional level, median ADC, cell density and glandular area were calculated for each ROI. Differences in median ADC and histological variables between PZ, CG and tumour were calculated with the paired Wilcoxon signed rank test (SPSS version 16.0, SPSS, Chicago, IL, USA). The Bonferroni correction was used to correct for multiple testing, P-values ≤ 0.025 were considered significant.
Spearman's correlation coefficients were calculated between the median ADC and histological variables. In addition, a voxel-wise correlation analysis of ADC and histological variables was performed for every single patient. P-values ≤ 0.05 were considered significant.
Results
In total, 31 ROIs were available for analysis: 12 tumour, nine PZ and 10 CG ROIs. Two patients had a second tumour with a volume > 0.22 cm3 in addition to the dominant tumour. Eleven tumour regions were located in the PZ and one tumour region was found in the CG.
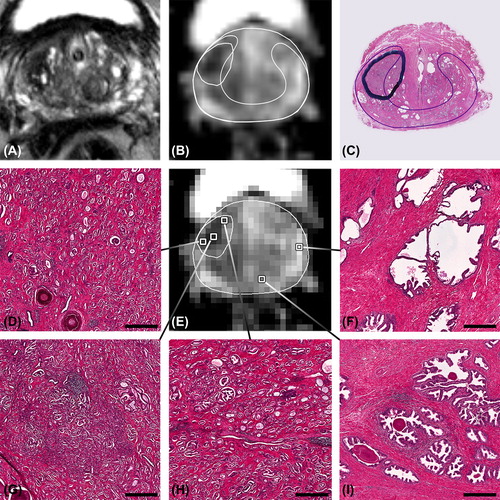
The detailed information available in this study is exemplified by two patients. The first example shows a hypointense region on T2w MRI with low ADC values, clearly corresponding to the delineated tumour on the H&E section (). Tumour voxels are highly conspicuous in histology even at low magnification and present with high cell density and small glandular area compared to normal tissue. The variation in histological appearance among the selected voxels is reflected by the variation in ADC values. The voxel with the lowest ADC value () corresponds to a Gleason grade 4 tumour voxel, whereas both other tumour voxels consist of Gleason grade 3 and contain less dense tumour tissue.
Figure 1. Patient example, showing voxels with an ADC ranging from 0.781 to 1.83 × 10⁻³ mm2/s and the corresponding microanatomy. A) T2w image, B) high resolution ADC map with delineation of tumour and peripheral zone, C) corresponding H&E section with delineations of a tumour with Gleason score 3 + 4 = 7 and the peripheral zone (thin line). On the low resolution ADC map in E) several voxels are selected of which the corresponding microanatomy is shown in D) and F–I). D) and H) tumour voxels with Gleason grade 3. G) tumour voxel with Gleason grade 4. F) and I) voxels with normal peripheral zone tissue. Benign voxels have apparent lower cell density and more glandular area. Bars: 200 μm.
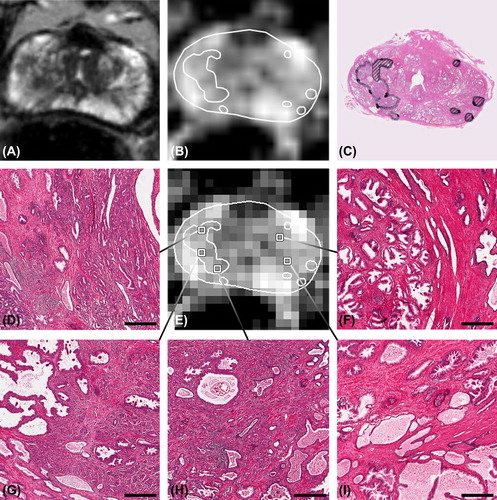
The second example illustrates the heterogeneity in histological appearance of voxels with a similar ADC (). Although the dominant tumour in this patient is quite large, it is not easy to distinguish the tumour boundaries on the T2w MRI and ADC map. On the ADC map, several voxels are selected with an ADC of 1.2 × 10⁻³ mm2/s. The corresponding histology shows that large differences in microanatomy could be present among voxels, despite a comparable ADC.
Figure 2. Patient example, showing the broad difference in histology among voxels with an ADC of 1.2 × 10⁻³ mm2/s. A) T2w image, B) high resolution ADC map, C) corresponding H&E section with delineated tumour. The dominant tumour had a Gleason score 4 + 5 = 9, striped tumour areas consisted of Gleason grade 3. D), G) and H) tumour voxels. F) central gland voxels containing benign prostatic hyperplasia. I) voxel with normal peripheral zone tissue. Bars: 200 μm.
For all patients, a wide range in all variables was observed on three levels: 1) on voxel level within tumour and normal tissue ROIs, 2) among different tumours within patients (regional level) and 3) among patients (). This heterogeneity is visualised in for ADC and cell density in tumours and PZ.
Figure 3. Boxplots of ADC and cell density for tumour and peripheral zone regions. Boxes are per patient with patient 3 and 4 having two separate tumour regions. Dotted line: median value of all tumour regions. Dashed line: median value of all peripheral zone regions.
Table II. Regional histological characteristics and ADC.
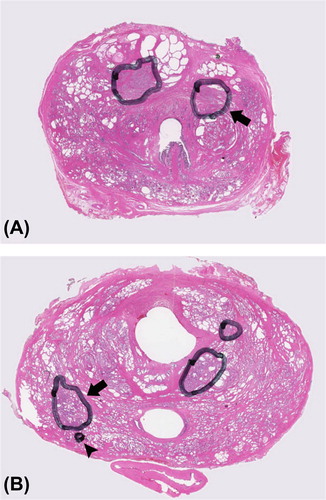
Notwithstanding the large heterogeneity, significant differences in median values between tumour and normal tissue ROIs could be observed. In tumour regions, ADC and glandular area were lower and cell density was higher compared with PZ. Compared with CG, tumour regions had only significantly higher cell density (). Tumour regions with Gleason score 6 (low-risk disease) and Gleason score ≥ 7 (intermediate/high-risk disease) were not different in ADC and histological variables. Large overlap between the different Gleason scores was present for all variables. Interestingly, in three of 12 very small tumours, excluded from analysis due to the small tumour volume (range 0.01–0.21 cm3), areas with high Gleason grades were observed. In , two examples are shown of small tumour islets with Gleason grade 4 and Gleason grade 5.
Figure 4. Example showing small tumour islets containing high Gleason grades. A) arrow pointing at a tumour with a volume < 0.22 cm3 and Gleason score 3 + 4. B) arrowhead pointing at a small tumour islet consisting of Gleason grade 5, located directly adjacent to a larger tumour with Gleason score 3 + 4. This shows that small tumour areas with high Gleason grades can be located outside the larger tumours.
On regional level, Spearman's correlation coefficients were calculated based on the median values of all ROIs. A weak correlation was observed between ADC and glandular area (r = 0.402, p = 0.025) and the ADC tended to be lower with increasing cell density, which, however, was not significant (r = −0.327, p = 0.073). No significant correlations were found between Gleason score and ADC and histological variables. Tumour volume was correlated with ADC (r = −0.608, p = 0.036) (), but not with cell density and glandular area.
Figure 5. Scatterplot showing the correlation between tumour volume and ADC. Spearman's r = 20.608, p = 0.036.
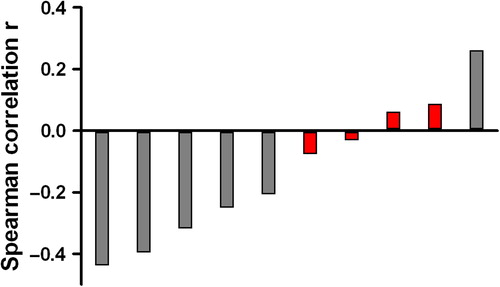
On voxel level, we determined correlations per patient, since the heterogeneity among patients could be large. Significant correlations between ADC and glandular area were found in five patients and ranged from r = 0.593 to r = 0.207 (p < 0.000 to p = 0.008). Significant correlations between ADC and cell density were found in six patients ranging from r = −0.439 to r = 0.261 (p < 0.000 to p = 0.021) (). One patient showed even a positive correlation of cell density with ADC.
Figure 6. Voxel-wise correlation of ADC with cell density per patient. Red bars represent the non-significant correlations.
Discussion
In this study, we described and illustrated on a voxel level the distribution of ADC and the histological variables cell density and glandular area to understand the strengths and limitations of DWI for prostate tumour delineation. Large heterogeneity played a key role in the histological and diffusional characterisation of malignant and benign prostate tissue.
DWI with ADC maps, as part of multiparametric MRI, is a useful tool for prostate cancer diagnosis [Citation6,Citation9]. Although it is well known that a region with low ADC is suspicious for prostate cancer, ADC maps can be rather vague and the interpretation challenging. Small tumours and parts of tumours might be easily missed. To benefit most of focal boost, accurate tumour delineation including all tumour voxels, is required. As a consequence, there is need for a decision about malignancy on a voxel level. Therefore, we evaluated the variation in ADC and histological variables both on regional and voxel level.
In this study, we found significant differences between tumour and PZ regions. A difference in cell density between tumour and CG was observed, but not a difference in ADC. This might be explained by the high incidence of benign prostatic hyperplasia (BPH) in elderly men with its wide spread in ADC values [Citation19]. In addition, on regional level a weak correlation between ADC and glandular area was observed. These results are consistent with published data. To our knowledge, four studies investigated the relationship of ADC with cell density of prostate tissue. Significant, but weak to moderate correlations were reported. The correlations in these studies were based upon average ADC values and cell density per tumour ROI. MRI data and histopathology were visually matched. Correlations of −0.5 between ADC and cell density were observed by Langer et al. and Zelhof et al. [Citation12,Citation13]. A somewhat stronger correlation of −0.69 was found by Gibbs et al. and of −0.64 by Wang et al. [Citation11,Citation14]. Together with the results of other investigators, our study showed that the strength of ADC maps is that they reflect the heterogeneity of prostate tissue. The variation in ADC can be explained to a certain extent by a variation in cell density and glandular area. Although a registration error will always have some influence on MRI-pathology correlation analyses, the hypothesis that ADC is determined by cell density might be too simple. Other factors like extracellular and intracellular space and volume as well as membrane permeability might be involved [Citation20]. As more detailed information is needed for optimal tumour delineation, we investigated the distribution of ADC and histological characteristics in tumour, PZ and CG on voxel level. Tumour tissue, as well as normal tissue, showed large heterogeneity in ADC, cell density and glandular area. Overlap between malignant and benign regions was clearly present. Especially between smaller tumours large diversity in ADC was observed. In addition, we observed an inverse correlation between tumour volume and ADC. This might rather reflect partial volume effects than less restricted diffusion, as we did not find a correlation between tumour volume and histological characteristics. Nevertheless, this correlation, together with the heterogeneity of prostate tissue, means that some of the smaller tumours and parts of tumours might be missed on an ADC map.
Correlation coefficients found on voxel level, varied a lot among patients. Although this might be partially explained by differences in registration accuracy among patients, we have illustrated that patient specific differences in prostate tissue composition are likely to play an additional important role. In addition, considerable variation in ADC values of normal PZ might be present among patients. In a study by Litjens et al. it was hypothesised that this variation might be the result of normal variations in prostate physiology [Citation21]. The variation in ADC values we found in the present study was comparable with the variation found in literature [Citation15]. It is, however, hard to compare ADC values between different institutes, as ADC values are influenced by differences in the choice of b-values and other experimental variables [Citation22].
Further, we sought for a spatial correlation between ADC and Gleason score. Although in literature significant correlations are found, we could not demonstrate a difference in ADCs between tumours with Gleason score 6 (low-risk disease) and Gleason score 7 or higher (intermediate- and high-risk disease) [Citation23,Citation24]. Neither was there a difference in cell density, nor in glandular area. The Gleason grading system is the most commonly used system to assess prostate cancer aggressiveness and consequently a very important clinical and prognostic factor. This system however, is based on tissue architecture and therefore not directly related to cell density, glandular area or ADC. To our knowledge, no correlation of Gleason score with cell density has been reported yet, although we would expect cell density to be higher and glandular area to be sparser in areas with higher Gleason scores.
In our study, tumour regions with Gleason grade 4 or 5 were present in very small lesions (volume < 0.22 cm3), which are beyond the detection level of MRI. Until now, it has been hypothesised that these small lesions are of minor influence on outcome of the patient, because most recurrences originate at the site of the dominant primary tumour [Citation3,Citation4,Citation25]. The clinical consequence of missing these small regions with high Gleason scores, might be resolved by the recently started randomised phase III trial investigating the benefit of a focal lesion ablative microboost (FLAME trial) [Citation5].
This study has some limitations. Although we used a robust and accurate MRI-pathology registration method, this method was not perfect and a registration error of approximately one voxel was present. Furthermore, the number of patients was small.
Altogether, the strength of the ADC is that its heterogeneity reflects the heterogeneity of malignant and benign prostate tissue and that the variation in ADC to a certain extent can be explained by a variation in cell density and glandular area. However, small tumours and parts of tumours might be missed on an ADC map.
In conclusion, we histologically evaluated the strengths and the limitations of DWI for prostate tumour delineation. On voxel level, cell density and glandular area of malignant and benign regions were highly heterogeneous, which was reflected by the heterogeneity of ADC maps. This heterogeneity might however obscure small tumours or parts of tumours. Therefore, DWI has to be used in the context of multiparametric MRI.
Declaration of interest: The authors report no conflicts of interest. The authors alone are responsible for the content and writing of the paper.
References
- Peeters ST, Heemsbergen WD, Koper PC, van Putten WL, Slot A, Dielwart MF, et al. Dose-response in radiotherapy for localized prostate cancer: Results of the Dutch multicenter randomized phase III trial comparing 68 Gy of radiotherapy with 78 Gy. J Clin Oncol 2006;24:1990–6.
- Zelefsky MJ, Pei X, Chou JF, Schechter M, Kollmeier M, Cox B, et al. Dose escalation for prostate cancer radiotherapy: Predictors of long-term biochemical tumor control and distant metastases-free survival outcomes. Eur Urol 2011; 60:1133–9.
- Cellini N, Morganti AG, Mattiucci GC, Valentini V, Leone M, Luzi S, et al. Analysis of intraprostatic failures in patients treated with hormonal therapy and radiotherapy: Implications for conformal therapy planning. Int J Radiat Oncol Biol Phys 2002;53:595–9.
- Arrayeh E, Westphalen AC, Kurhanewicz J, Roach M, 3rd, Jung AJ, Carroll PR, et al. Does local recurrence of prostate cancer after radiation therapy occur at the site of primary tumor?Results of a longitudinal MRI and MRSI study. Int J Radiat Oncol Biol Phys 2012;82:e787–93.
- Lips IM, van der Heide UA, Haustermans K, van Lin EN, Pos F, Franken SP, et al. Single blind randomized Phase III trial to investigate the benefit of a focal lesion ablative microboost in prostate cancer (FLAME-trial): Study protocol for a randomized controlled trial. Trials 2011;12:255.
- Groenendaal G, Borren A, Moman MR, Monninkhof E, van Diest PJ, Philippens ME, et al. Pathologic validation of a model based on diffusion-weighted imaging and dynamic contrast-enhanced magnetic resonance imaging for tumor delineation in the prostate peripheral zone. Int J Radiat Oncol Biol Phys 2012;82:e537–44.
- Turkbey B, Mani H, Shah V, Rastinehad AR, Bernardo M, Pohida T, et al. Multiparametric 3T prostate magnetic resonance imaging to detect cancer: Histopathological correlation using prostatectomy specimens processed in customized magnetic resonance imaging based molds. J Urol 2011;186:1818–24.
- Langer DL, van der Kwast TH, Evans AJ, Trachtenberg J, Wilson BC, Haider MA. Prostate cancer detection with multi-parametric MRI: Logistic regression analysis of quantitative T2, diffusion-weighted imaging, and dynamic contrast-enhanced MRI. J Magn Reson Imaging 2009;30:327–34.
- Haider MA, van der Kwast TH, Tanguay J, Evans AJ, Hashmi AT, Lockwood G, et al. Combined T2-weighted and diffusion-weighted MRI for localization of prostate cancer. Am J Roentgenol 2007;189:323–8.
- Futterer JJ, Heijmink SW, Scheenen TW, Veltman J, Huisman HJ, Vos P, et al. Prostate cancer localization with dynamic contrast-enhanced MR imaging and proton MR spectroscopic imaging. Radiology 2006;241:449–58.
- Gibbs P, Liney GP, Pickles MD, Zelhof B, Rodrigues G, Turnbull LW. Correlation of ADC and T2 measurements with cell density in prostate cancer at 3.0 Tesla. Invest Radiol 2009;44:572–6.
- Langer DL, van der Kwast TH, Evans AJ, Plotkin A, Trachtenberg J, Wilson BC, et al. Prostate tissue composition and MR measurements: Investigating the relationships between ADC, T2, K(trans), v(e), and corresponding histologic features. Radiology 2010;255:485–94.
- Zelhof B, Pickles M, Liney G, Gibbs P, Rodrigues G, Kraus S, et al. Correlation of diffusion-weighted magnetic resonance data with cellularity in prostate cancer. BJU Int 2009;103:883–8.
- Wang XZ, Wang B, Gao ZQ, Liu JG, Liu ZQ, Niu QL, et al. Diffusion-weighted imaging of prostate cancer: Correlation between apparent diffusion coefficient values and tumor proliferation. J Magn Reson Imaging 2009;29:1360–6.
- Groenendaal G, van den Berg CA, Korporaal JG, Philippens ME, Luijten PR, van Vulpen M, et al. Simultaneous MRI diffusion and perfusion imaging for tumor delineation in prostate cancer patients. Radiother Oncol 2010;95:185–90.
- Padhani AR, Liu G, Koh DM, Chenevert TL, Thoeny HC, Takahara T, et al. Diffusion-weighted magnetic resonance imaging as a cancer biomarker: Consensus and recommendations. Neoplasia 2009;11:102–25.
- Groenendaal G, Moman MR, Korporaal JG, van Diest PJ, van Vulpen M, Philippens ME, et al. Validation of functional imaging with pathology for tumor delineation in the prostate. Radiother Oncol 2010;94:145–50.
- Huisman A, Looijen A, van den Brink SM, van Diest PJ. Creation of a fully digital pathology slide archive by high-volume tissue slide scanning. Hum Pathol 2010;41:751–7.
- Noworolski SM, Vigneron DB, Chen AP, Kurhanewicz J. Dynamic contrast-enhanced MRI and MR diffusion imaging to distinguish between glandular and stromal prostatic tissues. Magn Reson Imaging 2008;26:1071–80.
- Anderson AW, Zhong J, Petroff OA, Szafer A, Ransom BR, Prichard JW, et al. Effects of osmotically driven cell volume changes on diffusion-weighted imaging of the rat optic nerve. Magn Reson Med 1996;35:162–7.
- Litjens GJ, Hambrock T, Hulsbergen-van de Kaa C, Barentsz JO, Huisman HJ. Interpatient variation in normal peripheral zone apparent diffusion coefficient: Effect on the prediction of prostate cancer aggressiveness. Radiology 2012;265:260–6.
- Norris DG, Niendorf T. Interpretation of DW-NMR data: Dependence on experimental conditions. NMR Biomed 1995;8:280–8.
- Hambrock T, Somford DM, Huisman HJ, van Oort IM, Witjes JA, Hulsbergen-van de Kaa CA, et al. Relationship between apparent diffusion coefficients at 3.0-T MR imaging and Gleason grade in peripheral zone prostate cancer. Radiology 2011;259:453–61.
- Verma S, Rajesh A, Morales H, Lemen L, Bills G, Delworth M, et al. Assessment of aggressiveness of prostate cancer: Correlation of apparent diffusion coefficient with histologic grade after radical prostatectomy. Am J Roentgenol 2011;196:374–81.
- Pucar D, Hricak H, Shukla-Dave A, Kuroiwa K, Drobnjak M, Eastham J, et al. Clinically significant prostate cancer local recurrence after radiation therapy occurs at the site of primary tumor: Magnetic resonance imaging and step-section pathology evidence. Int J Radiat Oncol Biol Phys 2007;69:62–9.