
Abstract
Background. To benefit most of focal treatment of prostate tumours, detection with high precision of all tumour voxels is needed. Although diffusion-weighted imaging (DWI) and dynamic contrast-enhanced magnetic resonance imaging (DCE-MRI) have good diagnostic performance, perfect tumour detection is challenging. In this study, we investigated the variation in prostate tissue characteristics Gleason score (GS), cell density (CD) and microvessel density (MVD) to explain the limitations in tumour voxel detection with a MRI-based logistic regression model. Material and methods. Twelve radical prostatectomy patients underwent a pre-operative 3.0T DWI and DCE-MRI exam. The MRI scans were used to calculate voxel-wise tumour probability with a logistic regression model for the peripheral zone (PZ) of the prostate. Tumour probability maps were correlated and validated with whole-mount histology. Additionally, from the whole-mount histological sections CD, MVD and GS were retrieved for every single voxel. GS, CD and MVD of true- and false-positive voxels and of true- and false-negative voxels were compared using Mann-Whitney U-tests. Results. False-negative tumour voxels had significantly lower CD and MVD (p < 0.0001) and were similar to non-tumour PZ. True-positive detected tumour voxels had high CDs and MVDs (p < 0.0001). In addition, tumour voxels with higher GS showed a trend towards more frequent detection (p = 0.06). Tumour voxels with GS ≥ 3 + 4 showed higher CD and MVD compared to tumour voxels with GS 3 + 3 (p < 0.0001). Conclusion. Tumour voxels with low CD and MVD resemble healthy tissue and are limiting tumour voxel detection using DWI and DCE-MRI. Nevertheless, the most aggressive tumour voxels, containing high CD, MVD and GS, are more likely to be detected and can therefore be treated with high dose using focal therapy or focal boosting.
Evidence is emerging that local recurrences of prostate tumours after radiotherapy are often seen at the original tumour site [Citation1]. Therefore, an additional radiation boost dose to this tumour could improve the tumour control probability. By limiting the boost to the visible tumour, radiation toxicity to the organs at risk such as rectum and bladder may be minimised [Citation2,Citation3]. Treatment side effects can be reduced with targeted focal therapy to the index lesion only without treating the whole prostate gland [Citation4]. In this case it is essential that all significant cancer is detected to allow for proper selection of patients for focal therapy. Treatment strategies like focal boosting and focal therapy therefore require precise delineation of the entire tumour area.
Diffusion-weighted imaging (DWI) and dynamic contrast-enhanced magnetic resonance imaging (DCE-MRI) have a high sensitivity and specificity for tumour detection [Citation5,Citation6]. However, the use of multiparametric MRI in radiotherapy clinic requires improved tumour detection accuracy. First, on voxel level, DCE-MRI and DWI appear to provide complementary information about the presence of tumour, which, however, does not always point exactly at the same tumour locations. Second, the performance of simple thresholding of MRI parameters such as Ktrans and maps of apparent diffusion coefficients (ADCs) is insufficient for accurate delineation of all tumour voxels [Citation7].
To deal with these challenges, in a previous study, we created a logistic regression model based on DWI and DCE-MRI [Citation8]. This model had a high diagnostic performance (AUC = 0.89). However, certain tumour parts remained undetected and parts of the non-tumour peripheral zone (PZ) were incorrectly assigned as tumour tissue. The explanation for these limitations may be found in the tissue's cell density and microvessel density, as the MR techniques DWI and DCE-MRI are believed to reflect these tissue properties [Citation9–11]. Both non-tumour PZ tissue and prostate tumour tissue can be highly heterogeneous with regard to these characteristics, affecting tumour detectability [Citation12].
In this study, the limitations in sensitivity and specificity of tumour voxel detection with a logistic regression model are explored in relation to the cell density (CD) and microvessel density (MVD) of malignant and benign PZ tissue of the prostate. Furthermore, the limitations in sensitivity are related to the GS.
Material and methods
Patients
This study was approved by the institutional review board and informed consent was obtained from all patients. Twelve patients were included in this study. All patients had biopsy proven prostate cancer and were scheduled for a Robotic Assisted Laparoscopic Prostatectomy (RALP). Clinical characteristics are shown in .
Table I. Patient characteristics.
Imaging
Prior to prostatectomy all patients underwent a T2w, balanced TFE, DWI and DCE-MRI exam using a 3T Philips Achieva MR scanner (Philips, Best, The Netherlands). To prevent prostate deformations, no endorectal coil was used. Before the MR exam, a urinary catheter was inserted to visualise the urethra in order to facilitate registration of MR-images and histological slices. MRI acquisition details are listed in Supplementary Appendix 1 (available online at http://informahealthcare.com/doi/abs/10.3109/0284186X.2013.837581).
Logistic regression model
In a previous study, a logistic regression model was developed, which can be used for predicting the presence of tumour tissue. Experienced observers delineated highly tumour suspicious regions and healthy regions on MRI scans of radiotherapy patients. Tumour suspiciousness was based on hypointense values on T2w scans, low ADC and high Ktrans values. The voxels in these regions were used to create the model. The final model consisted of: the ADC and Ktrans value in a voxel, the minimum and maximum of the ADC and Ktrans in a kernel around this voxel and the relative y (ventral-dorsal direction) and z (caudal-cranial direction) coordinate. The model was validated on a group of prostatectomy patients and yielded high diagnostic performance (mean AUC = 0.89). The continuous model outcome, ranging from 0 to 1, was stratified based upon the positive- and negative-predictive values. A threshold of 0.72 was used, which resulted in a sensitivity of 0.89 and a specificity of 0.72 for voxel-wise tumour detection [Citation8].
Histopatholgy
After prostatectomy, the left and right prostate surfaces were inked with different colours. The whole prostate was fixed in formaldehyde for approximately two days. Three carbon rods were inserted in the prostate specimen to facilitate the registration process after slicing of the prostate. Subsequently, we cut the prostate into slices of 3 mm. The precise thickness of these macroscopic slices was verified with a digital vernier caliper. Finally, whole-mount microscopic sections of 4 μm were cut from the macroscopic paraffin embedded slices and stained with haematoxylin-eosin (H&E). A pathologist delineated the tumour areas on the H&E sections. Each tumour region was assigned with a GS in consensus by two observers. Digital photographs were taken of the macroscopic slices and the H&E sections including delineations were digitised using a flatbed scanner (Epson Expression 10000XL).
Registration between histopathology and MR images
To compare the MR data with histopathology, the MR images were registered to the H&E sections, as described previously by Groenendaal et al. [Citation13]. Three steps were performed: 1) registration of the H&E sections to the macroscopic slices; 2) 3D reconstruction of the prostate specimen from the macroscopic slices; and 3) registration between the prostate reconstruction and the T2w MR images. On average the registration error of this method was 2–3 mm [Citation13]. For the last eight patients, the protocol was improved by embedding the prostate in agarose gel (5%) prior to slicing, to match for the sectioning plane of the prostate and the MRI plane. This improvement decreased the registration error with approximately 0.5 mm. For all patients, the registration error between the MR images and histopathology was on average about 1 voxel (reconstructed voxel size 2.5 × 2.5 × 2.5 mm3) [Citation13].
Immunohistochemical vessel staining
Tissue sections were deparaffinised, endogenous peroxidase activity was blocked and antigen retrieval was performed. Sections were incubated with an anti-CD31 monoclonal antibody (mouse-anti-human CD31, Novocastra). Subsequently, sections were incubated with HRP-conjugated secondary antibody (Novolink Polymer Detection System, Leica Microsystems) and diaminobenzidin and counterstained with haematoxylin. Throughout, appropriate positive and negative controls were used.
Tissue evaluation
Three microscopic slices per patient, containing the dominant tumour nodule and normal PZ, were chosen for further analysis and digital whole-slide images at microscopic resolution were created. Analysis of CD and MVD was performed in a grid of 2.5 × 2.5 mm2, corresponding to the MRI voxels. The H&E stained sections were used for the determination of the CD. With the IHC Nuclear Algorithm v8 in ImageScope v10.0 (Aperio Technologies, Vista, CA, USA) the absolute number of cell nuclei per voxel was identified. Minimum detectable nuclear size was set at 20 μm2. The Microvessel Analysis Algorithm v1 was used to identify CD31-stained blood vessels. The minimum vessel area threshold was set at 50 μm2 to ignore aspecific background staining. To compensate for variation in staining intensity, the settings of the algorithms were evaluated qualitatively and optimised for every batch by adjusting them on test regions.
Data analysis
The registration error of about one voxel (2.5 × 2.5 × 2.5 mm3) results in a misalignment between the suspicious region on the MR images and the tumour on the H&E stained sections. This may result in incorrect classification of voxels as either false negative or false positive. To exclude false- positive voxels from the data, non-tumour voxels were only taken into account if all the neighbouring voxels contained non-tumour PZ tissue only. This correction method, however, results in a large reduction in the number of eligible voxels. For tumour, the amount of remaining voxels was considered too small for analysis. For tumour voxels we therefore chose an alternative approach to compensate for the registration error: we considered a tumour voxel as correctly detected when at least one neighbouring voxel contained tumour tissue. This approach was previously used by Turkbey et al. [Citation14] on a regional level.
CD and MVD were compared for the true-positive, false-negative, false-positive and true-negative voxels. For these analyses a Mann-Whitney U-test was used (SPSS version 16.0, SPSS, Chicago, IL, USA). We used a Kruskal-Wallis test to determine if MR tumour detectability was related to GS. Furthermore, we tested if CDs and MVDs differed for GS = 3 + 3 and GS ≥ 3 + 4, using a Mann-Whitney U-test. The Bonferroni method was used to correct for multiple testing, p-values < 0.05/5 = 0.01 were considered significant.
Results
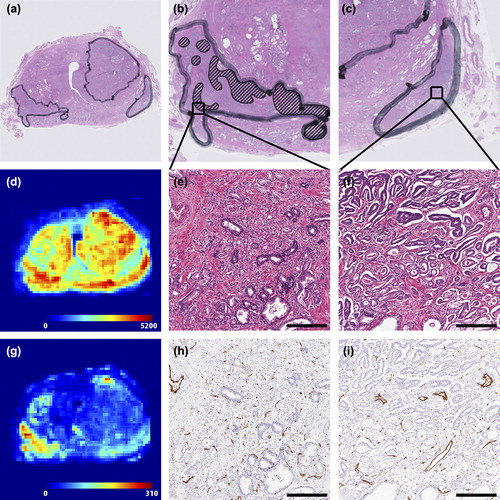
The detailed and heterogeneous data in this study is illustrated in two figures. In , the histopathological properties of one prostate slice are depicted. The figure shows that prostate (tumour) tissue can be highly heterogeneous, both on the CD and MVD level. Especially on MVD, both PZ tumours are very different (). The heterogeneity in tissue characteristics is partly reflected by differences in Gleason patterns within a single tumour (). Given the relatively large voxel sizes on MRI, MR voxels are likely to show a mixture of different CD, MVD and Gleason patterns.
Figure 1. Example of histological parameters retrieved from the prostate slices. (a) Overview of H&E stained slice. (b) Detailed image of the right tumour. Gleason grade 4 components are delineated. The rest of the tumour consists of grade 3 components only. (c) Detailed image of the left tumour. This tumour consists only of Gleason grade 3 components. (d) Overview of the distribution of cell densities in the prostate slice (cells/mm2). A large heterogeneity can be appreciated. (e) Detailed zoom of the H&E staining from the right tumour. Gleason grade 3 (lower left) and 4 (upper right) are both present in this image. The whole image has a size of 1 mm2, which is the same as the pixel size in (d). (f) Detailed zoom of H&E staining of the left tumour. A large difference in microscopic structure between image (e) and (f) can be appreciated. (g) Overview of the distribution of microvessel densities in the prostate slice (vessels/mm2). A large heterogeneity can be appreciated. (h) Detailed zoom of the CD31 microvessel staining from the right tumour. This image contains a relatively large number of small vessels (brown staining). (i) Detailed zoom of CD31 staining from the left tumour. A large difference in microscopic structure between image (h) and (i) can be appreciated. More large vessels are shown in (i) compared to (h). Scale bars: 250 μm.
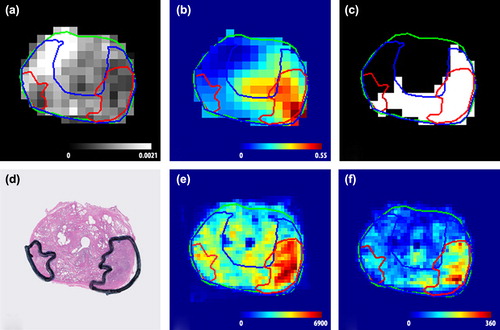
shows an example of the relation between the MR images and the spatial distribution of CD and MVD. In this figure an ADC map (a) and Ktrans map (b) are shown, as well as the prediction of the logistic regression model (c). On these images two tumours are delineated. The left tumour has on average a low ADC (0.93·10-3 mm2/s) and a high normalised Ktrans (3.2). The right tumour consists of high ADC values (mean 1.2·10 mm2/s) and low Ktrans values (mean 1.1), associated with healthy tissue. Due to its low ADC and high Ktrans, the left tumour was detected and even overestimated by the logistic regression model (). In contrast, a large part of the right tumour was not detected by the logistic regression model. The two tumours also differed on CD and MVD ( and ). The left tumour consists of voxels with a high CD and MVD and has a GS of 3 + 4 (mean CD: 5437 cells/mm2, mean MVD: 241 vessels/mm2), whereas the CD and MVD in the right tumour are low with GS 3 + 3 (mean CD: 2657 cells/mm2, mean MVD: 99 vessels/mm2).
Figure 2. (a) ADC map (mm2/s). (b) Ktrans map (min-1). (c) stratified model outcome, where white is assigned to be tumour and black is assigned to be non-suspicious. (d) H&E stained section. (e) cell density (cells/mm2). (f) microvessel density (vessels/mm2). The left tumour is detected by the model and has a high cell and microvessel density and a Gleason score of 3 + 4. In contrast, the right tumour is not detected and has a low cell density and microvessel density and a Gleason score of 3 + 3. Cell density and microvessel density are for the image sampled on resolution of 1 × 1 mm2.
Similar results were found in all patients. The MR detected tumour voxels (true positives) had on average the highest CD, followed by the MR non- detected tumour voxels (false negatives) (median CD true positive: 3560 cells/mm2, MR false negative: 2910 cells/mm2, median MVD true positive: 115 vessels/mm2, false negative: 90 vessels/mm2) ( and ). These values were compared with CDs and MVDs in non-tumour PZ voxels that were either incorrectly assigned by the model as tumour voxel (false positives) or correctly as non-tumour (true negatives). CDs and MVDs in the false-positives and true-negatives groups were 3015 cells/mm2, 95 vessels/mm2 and 2480 cells/mm2, 85 vessels/mm2, respectively. These differences in CD and MVD were all significant (p < 0.0001), except for the differences between the false-negative and false-positive voxels (CD: p = 0.198, MVD: p = 0.234). Also, false-negative tumour tissue had similar MVD as the MVD found in the non-tumour PZ (p = 0.233).
Figure 3. Cell density (a) and microvessel density (b) for MR-detected (true positives) and non-detected tumour (false negatives) voxels and for peripheral zone tissue assigned as tumour (false positives) and non-tumour (true negatives) based on MR images. Significant differences (p < 0.0001) are marked with an ‘*’.
In , the percentages of true-positive and false-negative tumour voxels are plotted for the different GSs. We found a trend that the tumour voxels with higher GS were easier to detect (p = 0.06). This is in line with the finding that tumour tissue with a GS ≥ 3 + 4 showed a higher CD and MVD compared to tumour tissue with a GS of 3 + 3 (p < 0.0001).
Figure 4. Percentage of true-positive and false-negative tumour voxels for the different Gleason scores. We found a trend that the tumour voxels with higher Gleason score (GS ≥ 3 + 4) score were easier to detect (p = 0.06). N, total amount of voxels per Gleason score.
Discussion
Precise prostate tumour detection, and therefore tumour delineation, is complicated by the large spread in ADC and Ktrans values inside the tumour. In a previous study, we presented a logistic regression model with a high diagnostic performance (AUC = 0.89) for detection of tumour voxels in the prostate PZ [Citation8]. The output of this model can be used for tumour delineation. However, parts of tumours were non-detected by the model. Similarly, parts of non-tumour PZ tissue were incorrectly assigned as tumour tissue. As the model was generated based on clinical data, it can be inferred that prostate tumours frequently are delineated incompletely or that normal tissue is included in tumour areas. This will have implications for the outcome of focal boosting strategies and of focal therapy, which is an upcoming and promising treatment strategy.
In the present study, we searched for a histological explanation of the difficulty to detect all tumour voxels. We showed a significant difference in CD and MVD between detected (true positives) and non-detected tumour parts (false negatives). False-negative tumour voxels contain on average a lower density of cells and microvessels ( and ). Interestingly, the false-negative tumour voxels show CDs which are similar to the values found in the false positives. Furthermore, MVDs in false-negative tumour voxels are similar to the MVDs found in non-tumour PZ tissue. This strongly indicates that the limitations in sensitivity and specificity of tumour voxel detection with MRI are caused by the underlying histology. MRI-based tumour prediction models might therefore reflect underlying histological characteristics like cell density and microvessel density, rather than predicting tumour presence [Citation15]. Although this may be seen as a disadvantage, when it comes to radiotherapy, this reflection of histological characteristics may be beneficial. In contrast to all-or-nothing therapies like surgery, in radiotherapy it is possible to sculpt the radiation dose based on underlying tissue characteristics to obtain optimal tumour control probability [Citation16]. A model reflecting histological properties may therefore be a valuable input for such an approach.
For translation of histological variables into prescription of radiation dose, one could argue from a radiobiological point of view, that tumour regions with a higher CD require higher radiation dose levels [Citation17]. The relation between MVD and required dose is, however, more complicated. In many cancers, high vascularity has been associated with tumour growth and metastases. In prostate cancer, this relationship is controversial. Schlemmer et al. reported in a study including 28 patients, no correlation between MVD and GS and other clinical variables [Citation10]. On the other hand, in a study by Mucci et al. including 572 patients, high-grade prostate tumours showed significantly larger MVD than low-grade tumours [Citation18]. This is consistent with what we found in the current study. Future studies are necessary to investigate the relation between imaging parameters and histological variables on one side and required dose levels on the other side.
We found a trend that tumour voxels with higher GS were easier to detect. This suggests that the most aggressive tumour parts are the most easy to detect. In addition, of voxels with GS3 + 3, 85% was detected in this study. This is a high value compared with other studies [Citation12]. It can be speculated that the histology of the detected GS3 + 3 voxels is slightly different from the non-detected voxels. However, the number of patients in this study is too small to draw definitive conclusions on this.
In this study, detailed histological properties are related to MR parameter maps on voxel level. Such high resolution information about the relation between MRI and histology is important for precise target definition for focal boosting and focal therapy. Previous studies have shown relationships between histology and MR parameter maps. Regions with a higher CD are correlated with low ADC and high Ktrans values [Citation9,Citation19]. Tumour CD was related to detectability based on ADC images [Citation12]. Qualitative parameters retrieved from the analysis of DCE-MRI signal-enhancement curves have been related with microvasculature of prostate tumour tissue [Citation10,Citation11]. However, most of these studies were performed on a regional or tumour level and did not provide the detailed information which is required for focal treatment. Therefore, focus in this study was on the voxel level. In addition, most studies did not investigate the non-tumour PZ tissue in a detailed fashion. We showed that non-tumour PZ tissue is highly heterogeneous on CD and MVD. This may be partly caused by prostate intraepithelial neoplasia and prostatitis, but even healthy PZ tissue is highly heterogeneous on these characteristics.
This study shows that tumour voxels with a CD below 3000 cells/mm2 and a MVD less than 90 vessels/mm2 are harder to detect. Given the high similarity in CD and MVD between tumour and healthy tissue ( and ), it seems unlikely that all tumour voxels can be detected using the imaging techniques DWI and DCE-MRI, unless large volumes of non-tumour tissue are included. This is, of course, not endeavoured by focal boosting strategies or focal therapy. As tumour detection is still not perfect, focal boosting might be preferred above focal therapy, as with focal boosting the remaining prostate tissue receives normal dose levels. Local recurrences will be reduced, toxicity, however, will stay at same levels.
This study has some limitations. First of all, the number of patients is small. The explorative nature of this work should be kept in mind for the interpretation of the results. Due to the small registration error, we were able to relate histopathological information with MR images in a highly detailed fashion. This high-resolution comparison resulted in a high number of voxels included in this study. However, one should keep in mind that all these voxels are not completely independent. Moreover, Ktrans values were normalised to the median values in the PZ. This method is feasible, unless > 50% of the PZ is comprised of tumour. In the future, improved quantification of DCE-MRI might allow the use of absolute Ktrans values [Citation20]. Unfortunately, the phase images needed for this quantification method, were not available in this patient cohort. Furthermore, this study focused only on the PZ of the prostate. This has several reasons. First, the number of transition and central zone tumours in our patient group was limited (n = 1). Second, the interpretation of MRI is a lot more complicated in these parts of the prostate, due to the presence of benign prostatic hyperplasia. Additionally, histological data was retrieved from patients of the same cohort as used for the initial validation of the model. To extend the applicability of the model to other institutes, the model accuracy is being validated in an independent patient cohort. Finally, in this study, we compared model outcome with the tissue characteristics CD and MVD. However, these tissue characteristics do not fully explain the large spread in the ADC and Ktrans data. An explanation for this might be the limited measurement precision of ADC and Ktrans. Moreover, future research should focus on what tissue characteristics explain ADC and Ktrans values inside tumour tissue best. The ADC, for instance, might be influenced by other factors like extracellular and intracellular space and volume, as well as membrane permeability [Citation21].
In conclusion, we found large heterogeneity inside prostate tumours and non-tumour PZ tissue on histological level. This heterogeneity is reflected by the MR images. CDs and MVDs of false-negative tumour voxels resembled those found in non-tumour PZ tissue. This illustrates that the limitations in tumour voxel detection with MRI are related to histological characteristics. In addition, detected tumour voxels had high CDs and MVDs and voxels with higher GS showed a trend towards easier detection. As stated before, high CDs require higher radiation doses to sterilise a tumour and high MVDs may be related to tumour aggressiveness. Therefore, it could be speculated that the tumour parts requiring the highest radiation dose are detected with MRI and can be treated using focal therapy or focal boosting.
Supplementary Appendix 1
Download PDF (1.3 MB)Acknowledgements
This research was financially supported by the Dutch Cancer Society Grant No. UU-2009-4310.
Declaration of interest: The authors report no conflicts of interest. The authors alone are responsible for the content and writing of the paper.
References
- Cellini N, Morganti AG, Mattiucci GC, Valentini V, Leone M, Luzi S, et al. Analysis of intraprostatic failures in patients treated with hormonal therapy and radiotherapy: Implications for conformal therapy planning. Int J Radiat Oncol Biol Phys 2002;53:595–9.
- Pickett B, Vigneault E, Kurhanewicz J, Verhey L, Roach M. Static field intensity modulation to treat a dominant intra-prostatic lesion to 90 Gy compared to seven field 3- dimensional radiotherapy. Int J Radiat Oncol Biol Phys 1999;44:921–9.
- Singh AK, Guion P, Sears-Crouse N, Ullman K, Smith S, Albert PS, et al. Simultaneous integrated boost of biopsy proven, MRI defined dominant intra-prostatic lesions to 95 Gray with IMRT: Early results of a phase I NCI study. Radiat Oncol 2007;2:36.
- Ahmed HU, Hindley RG, Dickinson L, Freeman A, Kirkham AP, Sahu M, et al. Focal therapy for localised unifocal and multifocal prostate cancer: A prospective development study. Lancet Oncol 2012;13:622–32.
- Futterer JJ, Heijmink SW, Scheenen TW, Veltman J, Huisman HJ, Vos P, et al. Prostate cancer localization with dynamic contrast-enhanced MR imaging and proton MR spectroscopic imaging. Radiology 2006;241:449–58.
- Hosseinzadeh K, Schwarz SD. Endorectal diffusion-weighted imaging in prostate cancer to differentiate malignant and benign peripheral zone tissue. J Magn Reson Imaging 2004; 20:654–61.
- Groenendaal G, van den Berg CA, Korporaal JG, Philippens ME, Luijten PR, van Vulpen M, et al. Simultaneous MRI diffusion and perfusion imaging for tumor delineation in prostate cancer patients. Radiother Oncol 2010; 95:185–90.
- Groenendaal G, Borren A, Moman MR, Monninkhof E, van Diest PJ, Philippens ME, et al. Pathologic validation of a model based on diffusion-weighted imaging and dynamic contrast-enhanced magnetic resonance imaging for tumor delineation in the prostate peripheral zone. Int J Radiat Oncol Biol Phys 2012;82:e537–44.
- Xu J, Humphrey PA, Kibel AS, Snyder AZ, Narra VR, Ackerman JJ, et al. Magnetic resonance diffusion characteristics of histologically defined prostate cancer in humans. Magn Reson Med 2009;61:842–50.
- Schlemmer HP, Merkle J, Grobholz R, Jaeger T, Michel MS, Werner A, et al. Can pre-operative contrast-enhanced dynamic MR imaging for prostate cancer predict microvessel density in prostatectomy specimens?Eur Radiol 2004;14:309–17.
- Oto A, Yang C, Kayhan A, Tretiakova M, Antic T, Schmid-Tannwald C, et al. Diffusion-weighted and dynamic contrast-enhanced MRI of prostate cancer: Correlation of quantitative MR parameters with Gleason score and tumor angiogenesis. AJR Am J Roentgenol 2011;197:1382–90.
- Langer DL, van der Kwast TH, Evans AJ, Sun L, Yaffe MJ, Trachtenberg J, et al. Intermixed normal tissue within prostate cancer: Effect on MR imaging measurements of apparent diffusion coefficient and T2-sparse versus dense cancers. Radiology 2008;249:900–8.
- Groenendaal G, Moman MR, Korporaal JG, van Diest PJ, van Vulpen M, Philippens ME, et al. Validation of functional imaging with pathology for tumor delineation in the prostate. Radiother Oncol 2010;94:145–50.
- Turkbey B, Pinto PA, Mani H, Bernardo M, Pang Y, McKinney YL, et al. Prostate cancer: Value of multiparametric MR imaging at 3 T for detection – histopathologic correlation. Radiology 2010;255:89–99.
- Rosenkrantz AB, Mendrinos S, Babb JS, Taneja SS. Prostate cancer foci detected on multiparametric magnetic resonance imaging are histologically distinct from those not detected. J Urol 2012;187:2032–8.
- Bentzen SM. Theragnostic imaging for radiation oncology: Dose-painting by numbers. Lancet Oncol 2005;6: 112–7.
- Webb S, Nahum AE. A model for calculating tumour control probability in radiotherapy including the effects of inhomogeneous distributions of dose and clonogenic cell density. Phys Med Biol 1993;38:653–66.
- Mucci LA, Powolny A, Giovannucci E, Liao Z, Kenfield SA, Shen R, et al. Prospective study of prostate tumor angiogenesis and cancer-specific mortality in the health professionals follow-up study. J Clin Oncol 2009;27:5627–33.
- Langer DL, van der Kwast TH, Evans AJ, Plotkin A, Trachtenberg J, Wilson BC, et al. Prostate tissue composition and MR measurements: Investigating the relationships between ADC, T2, K(trans), v(e), and corresponding histologic features. Radiology 2010;255:485–94.
- Korporaal JG, van den Berg CA, van Osch MJ, Groenendaal G, van Vulpen M, van der Heide UA. Phase-based arterial input function measurements in the femoral arteries for quantification of dynamic contrast-enhanced (DCE) MRI and comparison with DCE-CT. Magn Reson Med 2011;66:1267–74.
- Anderson AW, Zhong J, Petroff OA, Szafer A, Ransom BR, Prichard JW, et al. Effects of osmotically driven cell volume changes on diffusion-weighted imaging of the rat optic nerve. Magn Reson Med 1996;35:162–7.
- Schabel MC, Parker DL. Uncertainty and bias in contrast concentration measurements using spoiled gradient echo pulse sequences. Phys Med Biol 2008;53:2345–73.
- de Bazelaire C, Rofsky NM, Duhamel G, Zhang J, Michaelson MD, George D, et al. Combined T2* and T1 measurements for improved perfusion and permeability studies in high field using dynamic contrast enhancement. Eur Radiol 2006;16:2083–91.
- Cheng HL, Wright GA. Rapid high-resolution T(1) mapping by variable flip angles: Accurate and precise measurements in the presence of radiofrequency field inhomogeneity. Magn Reson Med 2006;55:566–74.
- Roberts C, Little R, Watson Y, Zhao S, Buckley DL, Parker GJ. The effect of blood inflow and B(1)-field inhomogeneity on measurement of the arterial input function in axial 3D spoiled gradient echo dynamic contrast-enhanced MRI. Magn Reson Med 2011;65:108–19.