
Abstract
Background. Long-term recession of the Japanese economy during the 1990s led to growing social inequalities whilst health inequalities also appeared. The 2007 National Cancer Control Program of Japan targeted “equalisation of cancer medical services”, but the system to monitor health inequalities was still inadequate. We aimed to measure socioeconomic inequalities in cancer survival in Japan.
Material and methods. We analysed 13 common invasive, primary, malignant tumours diagnosed from 1993 to 2004 and registered by the population-based Cancer Registry of Osaka Prefecture. An ecological socioeconomic deprivation index based on small area statistics, divided into quintile groups, was linked to patients according to their area of residence at the time of diagnosis. We estimated one-, five-year and conditional five-year net survival by sex, period of diagnosis (1993–1996/1997–2000/2001–2004) and deprivation group. Changes in survival over time, deprivation gap in survival, and change in deprivation gap were estimated at one and five years after diagnosis using variance-weighted least square regression.
Results. The deprivation gap in one-year net survival was narrower than in five-year net survival and conditional five-year survival. During the study period, there was no change in deprivation gap, except for reductions for pancreas (men) and stomach (women), and an increase for lung (men) in one-year survival. We observed a linear association between level of survival and deprivation gap at five years and conditional five years, but no association at one-year survival.
Conclusion. A wide deprivation gap in survival was observed in most of the adult, solid, malignant tumours, within the universal healthcare system in Japan. Overall, cancer survival improved in Osaka without any widening of inequalities in cancer survival in 1993–2004, shortly after the long-term economic recession and deep modifications in the social and work environments in Japan. The longer term impact of the recession on inequalities in cancer survival needs to be monitored using population-based cancer registry data.
Substantial deficit in cancer survival among socioeconomically deprived patients has been repeatedly reported in several countries [Citation1–10], despite universal access to the healthcare system in most of these countries. Furthermore, in England and Wales, widening of these inequalities was shown to be positively associated with the improvement in cancer survival [Citation11], suggesting progress in diagnosis and treatment offered greater benefit to the more affluent patients [Citation12].
Few studies of socioeconomic inequalities in cancer survival based on wide ecological data have been reported in Japan [Citation13,Citation14]. Until recently, Japan was among the group of more equitable high-income countries [Citation15,Citation16]. Life expectancy in Japan has been one of the longest in the world for decades [Citation17] and cancer survival is among the highest [Citation18]. While a clear relationship between income inequalities and mortality has been established in many populations, this relationship was fairly weak in Japan, compared with other high-income countries [Citation19]. However, the long-term recession of the Japanese economy during the 1990s led to growing social inequalities whilst wider health inequalities also appeared [Citation20]. The 2007 National Cancer Control Program in Japan targeted “equalisation of cancer medical services”, but the system to monitor health inequalities was still inadequate in Japan. We aimed to measure the socioeconomic inequalities in cancer survival and their time trends in Japan.
Material and methods
We analysed the survival of 20 sex-cancer combinations corresponding to 13 common invasive, primary, malignant tumours diagnosed from 1993 to 2004, registered by the population-based Cancer Registry of Osaka Prefecture (population 8.8 million), and followed up for at least five years after their cancer diagnosis (). The Osaka Cancer Registry follows the international rules for the sources of their data and the data quality checks [Citation21]. As a result, the cancer registry has been included in the IARC-led series of Cancer Incidence in Five Continents (CI-V) since the volume III in 1976 [Citation22] until the most recent volume X in 2014 [Citation23]. The Osaka Cancer Registry assessed the vital status of patients using two sources: vital statistics from the database of the Osaka Prefecture (every year) and the residential registry database (five and 10 years after diagnosis). It is compulsory for any resident in Japan to have their address recorded in the residential registry and updated every time they move, e.g. to another prefecture. As a result, lost to follow-up cases represented 2.1% of the study subjects. Furthermore, nearly 12% of the cases were excluded because the cancer diagnosis was based on death certificate only (DCO).
Table I. Cancer patients diagnosed from 1993–2004 in Osaka Japan by deprivation group.
With the exception of laryngeal cancer, these cancers (colon and rectum being grouped in a single site) are the most common solid tumours in Japan, representing over 75% of all incident cancer cases in the country during the study period [Citation24]. Laryngeal cancer in men was included in the analysis because the socioeconomic inequalities in survival were by far the largest observed in England and Wales [Citation25].
An ecological socioeconomic deprivation index, divided in quintile groups, was linked to patients according to their area of residence at time of diagnosis. Briefly, the deprivation index was built according to a two-step approach initially developed in Europe in order to obtain an index of relative deprivation, i.e. representative of the deprivation in a given country, but still enabling international comparisons [Citation26,Citation27]. The first step consisted of selecting items, using logistic regression, which define household poverty based on the Japanese General Social Survey (JGSS) [Citation28] cumulative data 2000–2003. In the second step, similar items from the national census questionnaire of 2000 were combined to build the ecological deprivation index. The detailed concept and procedures for the Japanese deprivation index are described elsewhere [Citation29] and in Appendix 1 (available online at http://informahealthcare.com/doi/abs/10.3109/0284186X.2014.912350). The smallest common area for data in both the population-based cancer registry and from national census was “Cho-Aza” level (average population 3000). The deprivation index was therefore defined for each of the 3152 Cho-Aza in Osaka (except for 193 Cho-Aza whose population was less than 50). In this study, we categorised the deprivation level into five groups according to the quintiles of the Osaka distribution of the deprivation index values.
We estimated net survival at one year, five years and five years conditional on being alive at one year, using a cohort approach, by sex, period of diagnosis (1993–1996/1997–2000/2001–2004) and deprivation group (from the least deprived in the 1st quintile to the most deprived in the 5th quintile) for each of the 13 studied sites. Main sources of all variables (sex, period at diagnosis, date at diagnosis, end of follow-up, vital status and patient address) collected by the Osaka Cancer Registry were based on hospital records, pathological reports, vital statistics database, and residential registry database. We considered one-year net survival as showing the short-term effects of the initial phase of diagnosis and treatment, five-year net survival as long-term prognosis reflecting both initial treatment and monitoring care. In addition, conditional five-year net survival can show the effect of long-term care excluding the effect of the initial phase [Citation30]. Net survival is the survival of a group of cancer patients in the hypothetical situation that the patients cannot die from causes other than the cancer of interest. It is the only survival measure which enables unbiased comparisons in survival between different populations (defined according to geography, calendar period, deprivation, ethnicity etc.). Net survival accounts for the mortality hazard from causes of death other than the cancer of interest (expected mortality). As no reliable individual cause of death information was available, the expected mortality of the patients was obtained from life tables derived for the general population of the Osaka Prefecture. Multivariable flexible Poisson models were applied to build these life tables by sex, single year of age and single calendar year for the period 1990–2010. Net survival was estimated using the unbiased non-parametric approach described by Perme et al. [Citation31].
We defined the (absolute) deprivation gap in three types of net survival (one-year, five-year and conditional five-year survival) as the difference in survival between the most deprived (5th quintile of deprivation index) and most affluent groups (1st quintile of deprivation index) of patients. For each cancer (and sex), we estimated the change in survival over the three periods and the deprivation gap in survival, and the change in deprivation gap using a least square regression weighted by the variance of each of the 15 period- and deprivation-specific net survival estimates (see Appendix 2, available online at http://informahealthcare.com/doi/abs/10.3109/0284186X.2014.912350, for more detail).
We finally performed two additional sensitivity analyses in order to account for weaknesses in our study (see Appendix 3, available online at http://informahealthcare.com/doi/abs/10.3109/0284186X.2014.912350, for more detail). First, all-cause mortality and life expectancy of the general population usually vary by deprivation and it is important to account for the differential expected mortality in the net survival estimation by deprivation. Using general life tables leads to over-estimation of the inequalities in survival. However, due to the unavailability of death data at Cho-Aza level, we were unable to build deprivation-specific life tables. We then applied the gradients in mortality by deprivation observed in the general population of England in 2001 to the general Osaka life tables and re-ran the net survival analysis.
Second, the size of the area (Cho-Aza) on which deprivation index is defined is quite wide, leading a dilution effect within the mechanism. Based on analyses carried out in a similar context in England and Wales, we calculated that the under-estimation of inequalities in cancer survival could be as large as 25% [Citation32]. This correction factor was therefore applied to our deprivation gap estimates.
Unless specifically mentioned, all survival estimates used the general Osaka life tables. All analyses were performed with the statistical package Stata 12 [Citation33].
Results
Net survival by deprivation
Net survival was generally lower in the more deprived groups, both at one and five years since diagnosis (Supplementary Table IA–C, available online at http://informahealthcare.com/doi/abs/10.3109/0284186X.2014.912350, for the patients diagnosed in 2001–2004 and for the all study period). The widest deprivation gap in one-year survival was observed in men for oesophagus, stomach and in women for ovary (). At five years, inequalities in survival were largest in men for stomach, colorectum, larynx and prostate, and in women for ovary and bladder (). The deprivation gap in survival hardly changed during the study period for almost all cancer sites (). In men, inequalities in one-year survival from pancreatic cancer reduced in absolute terms by + 10.5% from − 13.3% in 1993–1996. By contrast, the deprivation gap in survival widened for lung cancer (men), by − 4.6% at one year and − 3.5% at five years, both from − 1.2%. Among women, the deprivation gap in one-year survival from stomach cancer, at − 7.0% in 1993–1996, narrowed by + 6.0%.
Table IIA. Temporal change and deprivation gap in one-year net survival and change in deprivation gap from 1993–2004 in Osaka, Japan.
Table IIB. Temporal change and deprivation gap in five-year net survival and change in deprivation gap from 1993–2004 in Osaka, Japan.
Table IIC. Temporal change and deprivation gap in five2year conditional survival and change in deprivation gap from 1993–2004 in Osaka, Japan.
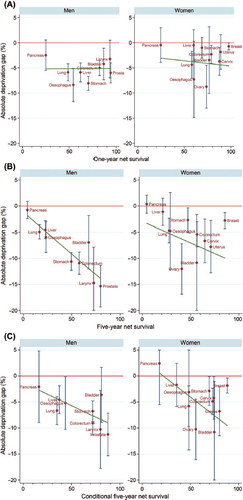
Inequalities tended to be more marked in men than in women (). We did not find any linear relationship between the average (over the three periods) level of net survival and the average deprivation gap in survival at one year since diagnosis (, Supplementary Table II, available online at http://informahealthcare.com/doi/abs/10.3109/0284186X.2014.912350). By contrast, a strong association was found at five years (, Supplementary Table II available online at http://informahealthcare.com/doi/abs/10.3109/0284186X.2014.912350) among men, the coefficient of five-year survival was − 0.159 (95% CI -0.253, − 0.065), while among women no statistically significant association was found [coefficient: − 0.082 (95% CI − 0.212, 0.049)]. For the conditional five-year survival of one-year survivors, a strong association was observed among both men [coefficient: − 0.088 (95% CI -0.168, − 0.009)] and women [coefficient: − 0.144 (95% CI − 0.259, − 0.028)] (, Supplementary Table II available online at http://informahealthcare.com/doi/abs/10.3109/0284186X.2014.912350).
Figure 1. (A) Association between the average level of one-year net survival and the deprivation gap in one-year net survival in 1993–2004 in Osaka, Japan. (B) Association between the average level of five-year net survival and the deprivation gap in five-year net survival in 1993–2004 in Osaka, Japan. (C) Association between the average level of five-year conditional survival and the deprivation gap in five-year conditional survival in 1993–2004 in Osaka, Japan.
General net survival results
Net survival improved over the three calendar periods for most cancers at one year since diagnosis, with the notable exceptions of colorectum (women), cervix, uterus, and bladder (men). The improvement pattern was less general at five years, with no increase in survival for oesophagus (women), stomach (both sexes), colorectum (women), pancreas (both sexes), cervix, uterus, ovary, and bladder (both sexes) ().
Sensitivity analyses
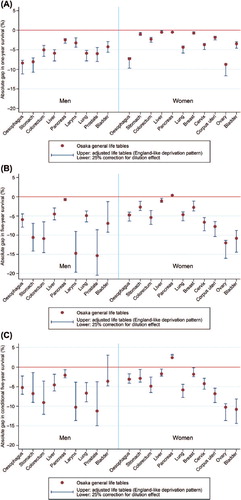
Three estimates of deprivation gap in survival are presented in for each of the 20 sex-cancer combinations at one, five and conditional five years: 1) using general Osaka life tables (as in ) (central estimates in ); 2) using general Osaka life tables adjusted for deprivation according to mortality patterns observed in England (upper estimates in ); and 3) applying a 25% inflation factor to the deprivation gap estimates previously reported in Supplementary Table IIIA–C (available online at http://informahealthcare.com/doi/abs/10.3109/0284186X.2014.912350) (lower estimates in ). The deprivation gaps were observed at most sites of cancer, even though we applied adjusted life tables in an England-like pattern. At one-year survival, the overestimation was smaller than in five-year survival and conditional five-year survival. When we considered 25% inflation by using the deprivation index based on the larger area, we observed a maximum deprivation gap of 10–12% in one-year survival for oesophagus and stomach in men and ovary, 20% in five-year survival for larynx and prostate, and 15% in conditional five-year survival for prostate.
Figure 2. (A) Sensitivity analysis of the deprivation gap in one-year net survival based on three different life tables in 1993–2004 in Osaka, Japan. (B) Sensitivity analysis of the deprivation gap in five-year net survival based on three different life tables in 1993–2004 in Osaka, Japan. (C) Sensitivity analysis of the deprivation gap in conditional five-year survival based on three different life tables in 1993–2004 in Osaka, Japan.
Discussion
Our study showed the deprivation gap in one-year net survival was narrower than in five-year net survival; this is confirmed by the wider inequalities in conditional five-year net survival. Apart from a few exceptions for one-year survival, the deprivation gaps hardly changed during the study period. We observed a linear relationship between the level of survival and the deprivation gap in five-year survival and in conditional five-year survival, whilst no association was found for one-year survival.
This is the first study of socioeconomic inequalities in cancer survival to use population-based cancer registry data and the small area deprivation index in Japan. The literature on socioeconomic inequalities in cancer survival comes almost exclusively from western countries including the UK, particularly when considering population-based studies. To our knowledge, our study is one of the very few based in a non-western country, i.e. in a very different social structure where local networks play an important role in individual health care. Osaka Prefecture, one of the largest population-based cancer registries in Japan, presents certain specificities. Compared with other prefectures, the standardised cancer mortality ratio is high in Osaka, with wide socioeconomic inequalities [Citation29]. Cancer survival is also lower in Osaka than in other prefectures [Citation34]. Nevertheless, investigating the inequalities in a cancer outcome in Osaka helps us understand their mechanisms both in Japan and in other countries.
These inequalities were estimated for most cancer sites in Japan and at a level similar to those in England and Wales [Citation11], despite having a universal healthcare system in place in both countries from 1948 in the UK and from 1961 in Japan. The deprivation gap in survival could be explained by differences in both the early detection and the quality of cancer treatment among deprivation groups, and further research is needed to explore the relative contribution and mechanisms of these factors. Certain patient factors are often mentioned as potentially playing an important role in these inequalities. For example, more prevalent and severe co-morbidity in the more deprived patients could limit the choice and efficacy of cancer treatment, as well as increase the adverse effects of the treatment. However, the role of co-morbidity in those inequalities remains to be demonstrated [Citation35,Citation36]. In Finland, low educational level of patients was strongly associated with low cause-specific five-year survival of most cancers and adverse stage distribution in 1996–2005. Avoidable cancer deaths were estimated at 4–7% of deaths if differences in five-year cancer survival across education levels were eliminated [Citation5]. The authors suggested “earlier cancer diagnosis and ability to cope with the healthcare system” as potential factors. Swedish study observed that educational level affected survival of breast and colorectal cancer. Differences were related to management of cancer care, such as diagnostics and treatment intensity. In Denmark, education and income were positively associated with breast cancer survival up to 10 years after diagnosis in 1983–1999. Interestingly, while comorbidity plays a role on survival, this role is higher in low socioeconomic categories, and the authors conclude that differential management of comorbidity could explain some of the socioeconomic inequalities in survival [Citation8]. In the Netherlands, socioeconomic inequalities in breast cancer survival were greatly reduced by adjusting for stage at diagnosis [Citation9]. However, differential stage by socioeconomic level hardly explained inequalities in survival from colorectum, lung and prostate [Citation10]. The Netherlands, most European Nordic countries and Japan, in contrast to the UK, are equitable societies and they have achieved the highest cancer survival in the world [Citation18]. Further comparative study between these European countries, the UK and Japan using data on diagnosis and treatment could investigate the mechanisms of socioeconomic inequality in cancer survival under universal healthcare systems.
For a few cancers (stomach, colorectum, lung, corpus uteri, ovary, prostate and bladder), the less deprived patients were diagnosed at a younger age in Osaka, Japan. This may reflect the employer-based and community-based organisation of health insurance in Japan. The more affluent have more stable employment in bigger companies, which offer more opportunities for early diagnosis, in particular for cancers with screening, such as stomach, colorectum, and lung. However, accounting for these differences in age distribution between the deprivation groups hardly modified the estimation of deprivation gaps in the regression models (data not shown).
A striking difference from England and Wales is that, in Japan, the inequalities tended to widen with time since diagnosis (see Supplementary Figures 1A and B available online at http://informahealthcare.com/doi/abs/10.3109/0284186X.2014.912350). This could reflect different mechanisms underlying these inequalities in both countries. In Japan, patients can freely choose a hospital for diagnosis and treatment, while the hospital where patients in England and Wales are diagnosed and treated is usually determined by their place of residence. Early inequalities may be due to delay in diagnosis associated with a lower proportion of treatment with curative intent in the UK, while inequalities in time since diagnosis may reflect understaging and/or lack of (neo-)adjuvant treatment, which is increasing risk of late recurrence in Japan. This non-optimal management of cancer patients is more pro-eminent in the small and non-specialised hospitals, which are particularly numerous in Osaka Prefecture. It will of interest to investigate whether the more deprived patients are more likely to be treated in these hospitals rather than specialised cancer centres or teaching hospitals, which was similarly observed in the Swedish breast cancer patients: lower educated patients were treated rather in local hospitals [Citation6].
The lack of deprivation-specific life tables is a limitation of our study. The assumption that the inequalities in the Osaka general population were as wide as in the England and Wales modified our conclusions. However, without full access to the mortality data in Japan, it is not possible to confirm or inform our hypothesis, nor to assess “the reduction in health inequalities” published by the government in the health policy “the second term of Healthy Japan 21st (century)”. In near future, we hope we can establish deprivation-specific life tables.
Our study makes an important contribution towards understanding inequalities in cancer survival by considering different societies which have a universal healthcare system. However, additional, detailed and comparative studies are required to identify the common mechanisms leading to those inequalities. Universal access to health care does not mean universal access to optimal health care, as observed, e.g. in the UK [Citation37–39] and other European countries [Citation5–8].
Conclusion
A wide deprivation gap in survival was observed in most of the adult, solid, malignant tumours within the universal healthcare system in Japan. Overall, cancer survival improved in Osaka without any widening of the inequalities in cancer survival from 1993 to 2004, shortly after the long-term economic recession and deep modifications in the social and work environment in Japan. The longer term impact of the recession on inequalities in cancer survival needs to be monitored using population-based cancer registry data.
Notice of correction
The version of this article published online ahead of print on 27 May 2014 contained errors in Table IIA, IIB, IIC, Supplementary Table IA, IB, and IC. 95% confidence intervals of one-year, five-year, and five-year conditional survival of patients diagnosed from 2001–04 were wrong. The error has been corrected for this version.
Supplementary Tables IA–C, II, IIIA–C, Figure 1 and Appendix 1–3
Download PDF (286.1 KB)Declaration of interest: This work was supported by the Japanese Society for Promotion of Science [the JSPS Invitation Fellowship for Research in Japan (Long-Term) to BR and YI], the Ministry of Education, Science and Culture of Japan [a Grant-in-Aid for Scientific Research (B) No. 24300323 to TN and YI] and the Ministry of Health, Labour and Welfare of Japan [a Health and Labour Sciences Research Grant for the Third Term Comprehensive Control Research for Cancer No. 22091601 to TN, and No. H25-008 to YI and AI]. The authors report no conflicts of interest. The authors alone are responsible for the content and writing of the paper.
References
- Woods LM, Rachet B, Coleman MP. Origins of socio- economic inequalities in cancer survival: A review. Ann Oncol 2006;17:5–19.
- Kogevinas M, Porta M. Socioeconomic differences in cancer survival: A review of the evidence. IARC Sci Publ 1997;138:177–206.
- Auvinen A, Karjalainen S, Pukkala E. Social class and cancer patient survival in Finland. Am J Epidemiol 1995; 142:1089–102.
- Yu XQ. Socioeconomic disparities in breast cancer survival: Relation to stage at diagnosis, treatment and race. BMC Cancer 2009;9:364.
- Pokhrel A, Martikainen P, Pukkala E, Rautalahti M, Seppa K, Hakulinen T. Education, survival and avoidable deaths in cancer patients in Finland. Br J Cancer 2010; 103:1109–14.
- Eaker S, Halmin M, Bellocco R, Bergkvist L, Ahlgren J, Holmberg L, et al. Social differences in breast cancer survival in relation to patient management within a National Health Care System (Sweden). Int J Cancer 2009;124:180–7.
- Cavalli-Bjorkman N, Lambe M, Eaker S, Sandin F, Glimelius B. Differences according to educational level in the management and survival of colorectal cancer in Sweden. Eur J Cancer 2011;47:1398–406.
- Dalton SO, Ross L, During M, Carlsen K, Mortensen PB, Lynch J, et al. Influence of socioeconomic factors on survival after breast cancer – a nationwide cohort study of women diagnosed with breast cancer in Denmark 1983–1999. Int J Cancer 2007;121:2524–31.
- Schrijvers CT, Coebergh JW, van der Heijden LH, Mackenbach JP. Socioeconomic status and breast cancer survival in the southeastern Netherlands, 1980–1989. Eur J Cancer 1995;31a:1660–4.
- Schrijvers CT, Coebergh JW, van der Heijden LH, Mackenbach JP. Socioeconomic variation in cancer survival in the southeastern Netherlands, 1980–1989. Cancer 1995; 75:2946–53.
- Rachet B, Woods LM, Mitry E, Riga M, Cooper N, Quinn MJ, et al. Trends and inequalities in survival for 20 cancers in England and Wales 1986–2001: Population-based analyses and clinical commentaries. Br J Cancer 2008;99:S1–120.
- Lyratzopoulos G, Barbiere JM, Rachet B, Baum M, Thompson MR, Coleman MP. Changes over time in socioeconomic inequalities in breast and rectal cancer survival in England and Wales during a 32-year period (1973–2004): The potential role of health care. Ann Oncol 2011;22:1661–6.
- Ueda K, Kawachi I, Tsukuma H. Cervical and corpus cancer survival disparities by socioeconomic status in a metropolitan area of Japan. Cancer Sci 2006;97:283–91.
- Ueda K, Tsukuma H, Ajiki W, Oshima A. Socioeconomic factors and cancer incidence, mortality, and survival in a metropolitan area of Japan: A cross-sectional ecological study. Cancer Sci 2005;96:684–8.
- OECD. Income distribution and poverty at the OECD. 2013. [cited 2013 Jul 12]. Available from: http://www.oecd.org/social/inequality.htm.
- Kagamimori S, Gaina A, Nasermoaddeli A. Socioeconomic status and health in the Japanese population. Soc Sci Med 2009;68:2152–60.
- Wilmoth J, Shkolnikov V. The human mortality database. 2013. [cited 2013 Jun 25]. Available from: http://www.mortality.org/.
- Coleman MP, Quaresma M, Berrino F, Lutz JM, De Angelis R, Capocaccia R, et al. Cancer survival in five continents: A worldwide population-based study (CONCORD). Lancet Oncol 2008;9:730–56.
- Kondo N, Sembajwe G, Kawachi I, van Dam RM, Subramanian SV, Yamagata Z. Income inequality, mortality, and self rated health: Meta-analysis of multilevel studies. Br Med J 2009;339:b4471.
- Wada K, Kondo N, Gilmour S, Ichida Y, Fujino Y, Satoh T, et al. Trends in cause specific mortality across occupations in Japanese men of working age during period of economic stagnation, 1980–2005: Retrospective cohort study. Br Med J 2012;344:e1191.
- Shin HR, Curado MP, Ferlay J, Heanue M, Edwards B, Storm H. Chapter 5: Comparability and quality of data. In: Curado MP, Edwards B, Shin HR, Storm H, Ferlay J, Heanue M, et al., editors. Cancer incidence in five continents, Vol. IX. Lyon: IARC; 2007. p. 67–94.
- Waterhouse J, Muir CS, Correa P, Powell, J, editors. Cancer incidence in five continents, Vol. III. Lyon: IARC; 1976.
- Forman D, Bray F, Brewster DH, Gombe Mbalawa C, Kohler B, Piñeros M, et al., editors. Cancer incidence in five continents, Vol. X (electronic version). Lyon: IARC; 2014. [cited 2013 Aug 13] Available from: http://ci5.iarc.fr.
- Matsuda T, Marugame T, Kamo K, Katanoda K, Ajiki W, Sobue T, et al. Cancer incidence and incidence rates in Japan in 2004: Based on data from 14 population-based cancer registries in the Monitoring of Cancer Incidence in Japan (MCIJ) Project. Jpn J Clin Oncol 2010;40:1192–200.
- Rachet B, Quinn MJ, Cooper N, Coleman MP. Survival from cancer of the larynx in England and Wales up to2001. Br J Cancer 2008;99 (Suppl 1):S35–7.
- Gordon D. Census based deprivation indices: Their weighting and validation. J Epidemiol Community Health 1995; 49(Suppl 2):S39–44.
- Pornet C, Delpierre C, Dejardin O, Grosclaude P, Launay L, Guittet L, et al. Construction of an adaptable European transnational ecological deprivation index: The French version. J Epidemiol Community Health 2012;66:982–9.
- JGSS Research Center. The Japanese General Social Surveys. [cited 2013 Aug 13]. Available from: http://jgss.daishodai.ac.jp/english/index.html.
- Nakaya T. Evaluating socioeconomic inequalities in cancer mortality by using areal statistics in Japan: A note on the relation between the municipal cancer mortality and the areal deprivation index. Proc Inst Stat Math 2011;59:239–65.
- Miller K, Merry B, Miller J. Seasons of survivorship revisited. Cancer J 2008;14:369–74.
- Perme MP, Stare J, Esteve J. On estimation in relative survival. Biometrics 2012;68:113–20.
- Woods LM, Rachet B, Coleman MP. Choice of geographic unit influences socioeconomic inequalities in breast cancer survival. Br J Cancer 2005;92:1279–82.
- StataCorp. Stata Statistical Software: Release 12. College Station, TX: StataCorp LP. 2011.
- Ito Y, Ioka A, Tsukuma H, Ajiki W, Sugimoto T, Rachet B, et al. Regional differences in population-based cancer survival between six prefectures in Japan: Application of relative survival models with funnel plots. Cancer Sci 2009;100:1306–11.
- Shack LG, Rachet B, Williams EM, Northover JM, Coleman MP. Does the timing of comorbidity affect colorectal cancer survival?A population based study. Postgrad Med J 2010;86:73–8.
- Ibfelt EH, Kjaer SK, Hogdall C, Steding-Jessen M, Kjaer TK, Osler M, et al. Socioeconomic position and survival after cervical cancer: Influence of cancer stage, comorbidity and smoking among Danish women diagnosed between 2005 and 2010. Br J Cancer 2013;109:2489–95.
- Morris EJ, Taylor EF, Thomas JD, Quirke P, Finan PJ, Coleman MP, et al. Thirty-day postoperative mortality after colorectal cancer surgery in England. Gut 2011;60:806–13.
- Jack RH, Gulliford MC, Ferguson J, Moller H. Explaining inequalities in access to treatment in lung cancer. J Eval Clin Pract 2006;12:573–82.
- Jack RH, Gulliford MC, Ferguson J, Moller H. Geographical inequalities in lung cancer management and survival in South East England: Evidence of variation in access to oncology services? Br J Cancer 2003;88:1025–31.