
Abstract
Epidemiological cancer data shed light on key questions within basic science, clinical medicine and public health. For decades, Denmark has had linkable health registers that contain individual level data on the entire population with virtually complete follow-up. This has enabled high quality studies of cancer epidemiology and minimized the challenges often faced in many countries, such as uncertain identification of the study base, age misreporting, and low validity of the cancer diagnoses. However, methodological challenges still remain to be addressed, especially in cancer epidemiology studies among the elderly and the oldest-old. For example, a characteristic pattern for many cancer types is that the incidence increases up to a maximum at about ages 75–90 years and is then followed by a decline or a leveling off at the oldest ages. It has been suggested that the oldest individuals may be asymptomatic, or even insusceptible to cancer. An alternative interpretation is that this pattern is an artifact due to lower diagnostic intensity among the elderly and oldest-old caused by higher levels of co-morbidities in this age group. Currently, the available cancer epidemiology data are not able to provide clear evidence for any of these hypotheses.
The complex interaction between cancer and aging
There is a strong, but complex interaction between cancer risk and aging. For the majority of cancer types, incidence and mortality increase with age throughout most of adulthood and old age, with a tendency of leveling off at the highest ages. Whether the leveling off for the oldest-old is real or an artifact (partly) caused by selection and less diagnostic intensity will be discussed below, but the strong, positive correlation between age and overall cancer incidence is overwhelmingly documented in many large populations [Citation1,Citation2] (including those presented in this issue).
In light of this, it seems surprising that animal models and a few human studies have suggested a tradeoff at the individual level where low cancer risk is associated with accelerating aging phenotypes and, vice versa, that longevity potential comes with the cost of increased cancer risk. Mechanisms that protect organisms from early life cancer have been identified, but these same mechanisms have been found to accelerate the aging processes and the development of diseases in later life – an example of antagonistic pleiotropy [Citation3]. In particular, the “better cancer protection–accelerated aging” hypothesis found support in a famous experiment published in Nature in 2002. This study showed that p53 mutant mice with augmented p53 activity displayed signs of early aging and, at the same time, an enhanced resistance to spontaneous tumors compared with wild types [Citation4].
In humans, the results are mixed. A study of the Utah-population found that families with greater longevity did not die of causes different from those of the background population; they died of the same causes, but at reduced rate. Individuals of longer-lived families had lower mortality rates for most age-related diseases including heart disease, stroke, and diabetes, but, noteworthy, not from cancer [Citation5]. Contrary to this, a US study of offspring of centenarians showed that the offspring had lower all-cause, cardiovascular and cancer mortality compared with the control offspring [Citation6], and a large Danish twin study found no evidence of a cancer-longevity tradeoff in humans. This last study showed that longevity in one twin is associated with lower cancer incidence in the co-twin, indicating an association of familial factors with both low cancer occurrence, better aging patterns, and longevity [Citation7]. Preliminary results from studies of long-lived Danish families further support the notion that age, aging, and cancer risk strongly correlate not only at the population level, but also at the individual level, with no sign of tradeoff [Citation8]. This epidemiological evidence is in agreement with the theory of mutation accumulation which implies that genomic damages accumulate during life, and mutations with detrimental effects are selected against only if they act in the reproductive years, but that no selection occurs for mutations acting late in life. Hence, DNA damage accumulates with age and increases the risk for both aging and cancer [Citation9].
These few examples illustrate how epidemiological data on cancer and aging can be used for testing specific biological hypotheses about the complex interaction between aging and cancer. The same data are also widely used in clinical epidemiology with regard to cancer prognosis estimates and health care planning and as an instrument for detecting risk factors and pointing toward insufficient treatment of sub-groups of patients, e.g. the elderly and very old, as shown in this issue. In view of these numerous, important uses of epidemiological cancer data, it is important to carefully consider also the methodological challenges.
The epidemiology of cancer in elderly and very old individuals
The general epidemiological patterns
Internationally
Several international studies have described type-specific cancer incidence as well as cause-specific mortality rates for different cancer types in the elderly and the very old. In a recent study of cancer incidence, mortality, and prevalence of more than 20 different, major cancers in the US population in the period 1998–2002 and for ages 0–114 years [Citation2], the cancer incidence rates for most cancer types increased up to a maximum at about ages 75–90 years, and dropped quite abruptly afterwards. Mortality rates for the same cancer types showed similar patterns and, with some exceptions, peaked within five years of the age of cancer incidence peak. A trend of both incidence and mortality rates toward zero among centenarians led the authors to suggest that centenarians may be asymptomatic or insusceptible to cancer. A previous US study of cancer mortality rates based on the 1990 census [Citation10] found peaks at similar ages followed by a decline for overall cancer mortality rates as well as for most of eight type-specific cancer mortality rates. Similar patterns are found outside the US. A study that examined incidence and mortality rates in the Netherlands from 1989–1995 for about 10 specific cancers in the older population with age categories up to ages 95+ [Citation11] found that most incidence rates peaked at ages 75–84 or 85–94 years and declined afterwards, while the corresponding mortality rates mostly increased until ages 95 + years. The patterns of cancer incidence peak and decline at similar ages are also seen in a study using Japanese, US, former German Democratic Republic, and Canadian data from the International Agency for Research on Cancer (IARC) [Citation12]. Cancer prevalence in the US for most cancers was found to increase in the order of a power function up to around age 70 years, to peak between ages 75 and 95 years, and then to decline or level off, with a prevalence for all cancers of around 15% in women and 25% in men [Citation2,Citation6].
Denmark
In this issue, the patterns and trends of incidence, mortality, prevalence and relative survival for 38 types of cancer for the years 1978–2012 are described. Data stem from the NORDCAN database [Citation13] but with a more detailed division of older ages. The Danish data in NORDCAN are based on the Danish Cancer Register (DCR) and the Danish Cause of Death Register. Below, we consider the age patterns of cancer incidence, mortality, and prevalence for the age groups 0–69, 70–74, 75–79, 80–84, 85–89, and 90+, for men and women, and for the periods 1978–82, 1988–92, 1998–2002, 2003–2007, and 2010–2012.
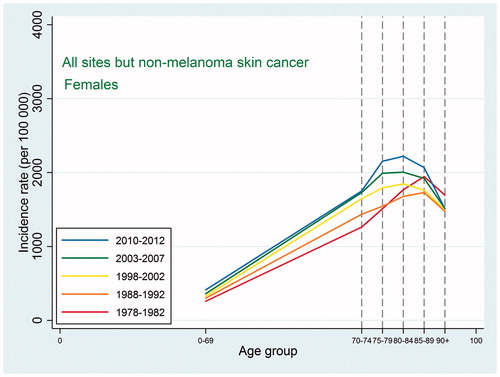
Similarly to the cancer incidence pattern seen internationally, the cancer incidence of all sites except non-melanoma skin cancer in Denmark ( and ) showed a peak at around ages 80–89 followed by a decline in all five periods with a few exceptions: cancers of other female genital organs (vulva and vagina) and esophagus cancer in women, where the observed pattern was more compatible with an increase or a leveling off, and non-melanoma skin cancer in both sexes where there was a consistent steady increase in incidence with higher age group.
Figure 1. Age-specific cancer incidence for all sites except non-melanoma skin among Danish men. Separate curves for the periods 1978–1982, 1988–1992, 1998–2002, 2003–2007, and 2010–2012.
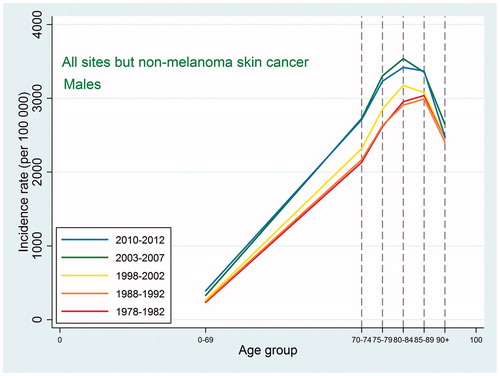
Figure 2. Age-specific cancer incidence for all sites except non-melanoma skin among Danish women. Separate curves for the periods 1978–1982, 1988–1992, 1998–2002, 2003–2007, and 2010–2012.
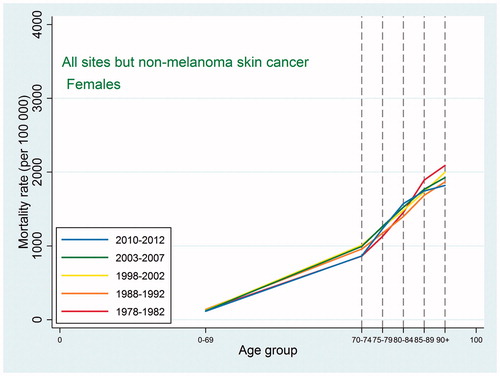
Also the cancer mortality patterns were similar to those observed in international studies. For all sites except non-melanoma skin cancer, the mortality increased with age up to 90 + with a possible leveling off at that age ( and ). For the specific types, the highest mortality rates were usually observed at ages 85–89 or 90+, and as we did not have the power to consider the age category 95+, we were not able to detect a decline at older ages. For lung cancer, ovarian cancer, and cancer in the brain and central nervous system, the mortality peaked earlier with some decline afterwards, and this pattern reflected an earlier peak in incidence for the same site, so that, for most types, mortality would peak at the same age or in the age category following the peak age of cancer incidence.
Figure 3. Age-specific cancer mortality for all sites except non-melanoma skin among Danish men. Separate curves for the periods 1978–1982, 1988–1992, 1998–2002, 2003–2007, and 2010–2012.
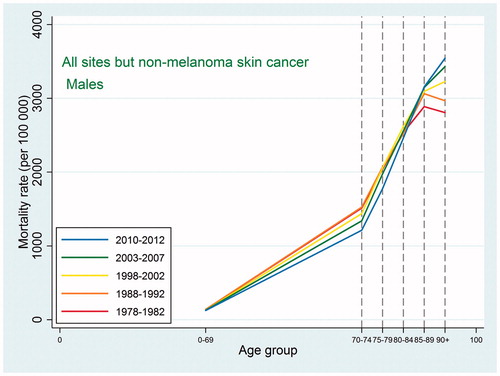
Figure 4. Age-specific cancer mortality for all sites except non-melanoma skin among Danish women. Separate curves for the periods 1978–1982, 1988–1992, 1998–2002, 2003–2007, and 2010–2012.
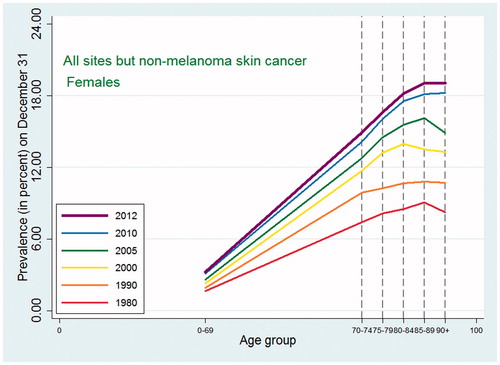
As expected, given the similarity between observed incidence and mortality patterns for cancer in Denmark and the US, the cancer prevalence age patterns in our study did not deviate from the patterns observed in a recent US study [Citation2]. For all-site cancer except non-melanoma skin cancer, prevalence peaked at around age 80–89 for men with a small decline afterwards, while for women in earlier periods the prevalence plateaued after age 80, whereas in later periods it continued to increase at age 90+. The type-specific prevalence usually peaked at age 75–89 or increased up to age 90+. As seen in and , later periods were associated both with higher prevalence and with later peaks. For the specific types of cancer, most of those for which age at peak prevalence changed in different periods tended to peak later in more recent periods (lung, cervix uteri, corpus uteri, ovary, other female genitals, bladder, melanoma of skin for males, brain and central nervous system for females) whereas a few (breast cancer for women, and prostate cancer) peaked earlier in later periods. The latter observation could be related to the introduction of breast cancer screening in the 1990s and to the more recent use of PSA, which may both result in earlier diagnoses, for breast cancer up to age 69 years, leading to an earlier peak age.
Figure 5. Age-specific cancer prevalence for all sites except non-melanoma skin among Danish men. Separate curves at time points 1980, 1990, 2000, 2005, 2010, and 2012 (on December 31).
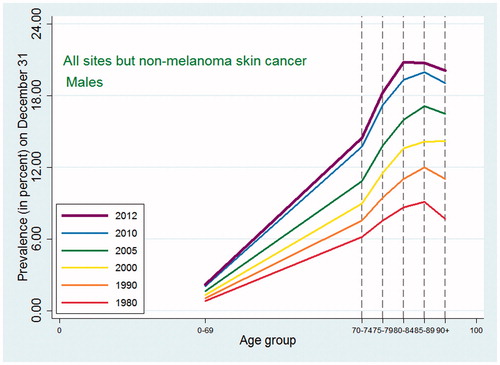
Figure 6. Age-specific cancer prevalence for all sites except non-melanoma skin among Danish women. Separate curves at time points 1980, 1990, 2000, 2005, 2010, and 2012 (on December 31).
Methodological challenges in studies of cancer in the elderly – internationally and in Denmark
Studies of cancer in the elderly have many challenges. Some are shared with most epidemiological studies while others are specific to the field. The intriguing pattern with peaking incidence and mortality rates followed by a decline or a leveling off may be real or (partly) a product of bias and methodological challenges. This is considered in more depth below.
Identification of study base and incident cases
To properly estimate rates and prevalences, it is necessary to have information on the size of the study base from which cancer diagnoses and deaths are identified. One method is to use population figures, provided from census data, to estimate these sizes within categories of age, sex, period, race, and relevant geographic areas. Several older studies have found that the population of very old is overestimated in US censuses [Citation14,Citation15] leading to underestimated rates and prevalences in the older age categories, although the more recent censuses have improved their figures in all age categories.
Another issue is the difficulty in determining exactly which population makes up the study base. When cancer diagnoses and/or cancer deaths are provided by, e.g. hospitals, some discrepancy may exist between the geographical coverage of those hospitals and the geographical coverage of a census, which may result in inaccuracies or bias when these sources are combined. Related to this is the problem of cross-border migration, where, e.g. healthy US immigrants from Mexico return to their native country when they become ill [Citation16].
In the Nordic countries it is possible to identify a very accurate study base due to a century of excellent population registration and to the use of personal identification numbers for the entire populations for almost half a century, which have enabled linkage to, e.g. population-based cancer registers. The registration includes continuously updated information on migration. Even so, cross-border migration issues may still exist, partly because no information on health status is available after emigration, and partly since the emigration may not be recorded in the register for persons who have left the country.
When studying cancer occurrence it is important to distinguish between prevalent and incident cases. When a new cancer registry is established, there is a risk that many cases registered as incident cases are in fact prevalent. As time passes, the observed incidence rates will represent the true incidence in the population. The DCR contains records of cancer in the Danish population since 1943 [Citation17], thus enabling us to study cancer occurrence over a large period, with minimal risk of counting prevalent cases as incident.
Age validation and loss to follow-up
To avoid age misclassification, the data sources for age at diagnosis of cancer and age at death need to be reliable. To ensure this, validation studies of age at cancer diagnosis or death must be carried out, especially among older populations. In the US, age misreporting among the oldest-old has been a concern, but several studies have found that age recorded on US death records is accurate also among the oldest individuals [Citation15,Citation18]. A birth certificate is considered the gold standard for verifying an individual’s birth date, but for an old individual, the second best validation tool is often census data from the individual’s early life. In the Nordic countries, where population registers continuously have been updated with regard to births, deaths, names, migrations, and other personal data for almost a century, and with data provided by municipal authorities based on parish registers [Citation19], the problem of age misreporting is minimized as is the problem of loss to follow-up.
Validity of cancer diagnosis
The validity of data on cancer diagnoses relies on a correct diagnosis and a reliable registration of the diagnosis. Morphologically verified cancers are often considered indicative of a valid diagnosis. A high quality of data registration can be achieved by obtaining data from several independent sources, and can also be supported by linkage to independent registers with information on cancer.
Cancer registration in Denmark took place at a national level from 1943 based on reporting from all hospitals involved in diagnosis, treatment, or follow-up of cancer patients. Registration was not compulsory before April 1987, but was still considered virtually complete both before and after [Citation17]. Since 2004, all registrations have been made electronically through linkage of the National Patient Register, the Cause of Death Register and the Pathology Register. From 1978, the International Classification of Diseases for Oncology, first revision (ICD-O-1), with site information, morphology and information on whether the tumor is invasive, has been used and was updated to the ICD-O-3 in 2004. The overall percentage of morphologically verified tumors after 2004 is about 89% [Citation17], but this number has changed over the years and with the age of the patients. For ages 0–69 years at diagnosis, 4–6% of the tumors were not morphologically verified. For ages 70 + years, the percentages increased with age and decreased with time. For the age group 90+ years, the percentage of unverified tumors was around 31% in 1980, decreasing to about 23% in 2012. The overall percentages of cancer cases diagnosed only from death certificates were about 1% in 1980, decreasing to about 0.3% after 2004. For the oldest age group of 90+ years, the number was as high as 7.5% around 1980, decreasing to less than 5% after 2004 (calculations are based on information from the DCR).
Using relative survival in populations of elderly
The relative survival estimates for the older age groups and the most common cancers are probably slightly overestimated. Relative survival is defined as the observed survival of the cancer patients divided by the expected survival of a comparable group from the general population, free from the cancer under study. In practice, and here as well, expected survival is calculated from the general population mortality. Such estimates are biased since they also include mortality from cancer patients, but the bias is usually ignored since mortality among individuals with a specific cancer is thought to constitute only a small proportion of the total mortality. For common cancer sites and for older ages this is not entirely true. A Swedish study [Citation20] showed that for five-year relative survival for all cancers combined and ages 75 + years, the overestimation of relative survival can be as high as 3% points. The similar overestimation for prostate cancer was 1.7% point and for breast cancer 0.7% point. For other sites and for lower ages, however, the overestimation was less pronounced.
Cause of death
The misclassification of cause of death may obscure the relation between observed cancer mortality rates and the underlying hazard. This is especially an issue when considering time trends in rates. Changes over time in classification of diseases, in improved diagnostics for specific diseases, and in administrative procedures for reporting causes of death, will all have a potential impact on the observed trends in site-specific cancer mortality. Also, when several causes of death are present, the cause of death determined to be the primary may depend on current priorities in the health system. Autopsies may improve the quality of data on cause of death. While in the 1970s and 1980s a rather high proportion of 43% of all cancer deaths were autopsied [Citation21], by 2011 the overall proportion of autopsies in Denmark was only 10%, and for deaths in hospitals it was less than 20% [Citation22].
Diagnostic intensity among elderly and very old individuals compared to the younger ones
The treatment of elderly and the very old individuals has changed dramatically over the last 25 years. Ageism in the form of age criteria for diagnostics and treatments has vanished. For example, in Denmark a marked increase in primary prosthetic replacements of hip joint was observed not only over cohorts of elderly and very old, but also within cohorts: for Danes born 1895, no one received a hip replacement at ages 85–89 years compared to 3% at ages 95–99 years of the same cohort [Citation23]. However, it is still likely that severe comorbidity among elderly and the very old individuals, e.g. Alzheimer’s disease, will lead to less intensive diagnostics if an asymptomatic cancer is suspected, in particular if the diagnostic procedure is invasive. As co-morbidities increase with age, such a tendency would lead to an underestimation of incidence rates among the oldest individuals.
Indications of a higher proportion of undiagnosed cancers among the elderly and very old can be found by comparing age-specific incidence and mortality rates for these age categories. For both sexes, the incidence rates for all sites except non-melanoma skin cancer peaked at ages 80–89 years and then declined quite steeply. Contrary to this, the mortality rates never peaked but kept increasing up to ages 90+ years, perhaps with an indication of a leveling off, and at ages 90 + years, the mortality rates were higher than the incidence rates. This pattern is to be expected if cancer is diagnosed less frequently at the oldest ages. Mortality rates, however, may be less affected as the cause of death is required by law on death certificates, which could lead to suspected cancer cases being included in cancer mortality rates but not in cancer incidence rates.
The observation above may also be explained by discrepancies between cancer registration in the Cancer Registry and the Register of Causes of Death. In the registration process in Denmark, the Cancer Registry is linked to the Register of Causes of Death. If a cancer diagnosis not known from the Cancer Registry is found on the death certificate, a follow-back procedure will be made searching for other registrations and verifications. Some diagnoses are verified and will then be included. These verified diagnoses often correspond to patients with a very short survival from diagnosis. Other cancer diagnoses found on the death certificates can be rejected based on benign or “obs pro” (not verified) diagnoses in the Cancer Registry or Pathology Register, and they are not included as cancer cases, but are still included as cancer deaths. This follow-back procedure may result in higher age-specific death rates than incidence rates for the older ages. The remaining cancer cases found via the death certificates with no information from other sources, and thus neither confirmed nor rejected, are kept as death certificate only (DCO) in the Cancer Registry. These DCOs account for about 1% of the cancer registration declining to 0.3% after 2004, but with higher percentages for the older age groups.
If there is a tendency to less diagnostic intensity or perhaps less registration of cancers among the elderly and very old, this could result in a decline in cancer incidence rates in these groups. As the survival prognosis of the elderly has greatly improved since about 1800 [Citation24], and present evidence suggests that these survivors live in better health and with less functional disabilities [Citation25], it could be expected that the age at which the tendency to abate cancer diagnostics will increase with calendar period. Hence, it can be hypothesized that the age of peak of cancer rates will increase with rates from more recent periods compared to age-specific rates from older periods. Data from Miyagi prefecture in Japan, 1959–1992, suggest such a pattern [Citation12]. However, the Danish cancer rates for the period 1980–2010 do not (this issue), although the gain in life expectancy in this period in Denmark was very modest.
Conclusion
The epidemiology of cancer among the elderly is of interest both for basic research and for clinical science and practice. It is important to appreciate the methodological challenges in epidemiologic cancer research when interpreting observed measures of cancer occurrence, both in settings where an understanding of the basic mechanisms of cancer is the focus, as well as in research where the prognosis after cancer treatment in a population is the primary concern. The comprehensive, high quality, population-based registers in Denmark and the other Nordic countries have minimized a number of these challenges, but others remain, and the consequences of these are important to consider.
Declaration of interest
The authors report no conflicts of interest. The authors alone are responsible for the content and writing of the paper.
Funding
This work is supported by the Danish Agency for Science, Technology and Innovation/The Danish Council for Independent Research [grant number 11-107308], the National Institute on Aging [grant number P01 AG08761], and the Odense University Hospital AgeCare program (Academy of Geriatric Cancer Research). The Danish Aging Research Center is supported by grant number 95-103-11419 from the VELUX Foundation.
References
- Bellizzi KM, Gosley MA. Cancer and Aging Handbook: Research and Practice, 1st edition. Wiley-Blackwell; 2012. 536 p.
- Harding C, Pompei F, Wilson R. Peak and decline in cancer incidence, mortality, and prevalence at old ages. Cancer 2012;118:1371–86.
- Ukraintseva SV, Arbeev KG, Akushevich I, Kulminski A, Arbeeva L, Culminskaya I, et al. Trade-offs between cancer and other diseases: Do they exist and influence longevity? Rejuvenat Res 2010;13:387–96.
- Tyner SD, Venkatachalam S, Choi J, Jones S, Ghebranious N, Igelmann H, et al. p53 mutant mice that display early ageing-associated phenotypes. Nature 2002;415:45–53.
- O'brien E, Kerber R, Smith K, Mineau G, Boucher K, Reed DL. Familial mortality in the Utah population database: Characterizing a human aging phenotype. J Gerontol Ser A Biol Sci Med Sci 2007;62:803–12.
- Terry DF, Wilcox MA, Mccormick MA, Pennington JY, Schoenhofen EA, Andersen SL, et al. Lower all-cause, cardiovascular, and cancer mortality in centenarians' offspring. J Am Geriatr Soc 2004;52:2074–6.
- Christensen K, Pedersen JK, Hjelmborg JV, Vaupel JW, Stevnsner T, Holm NV, et al. Cancer and Longevity–Is There a Trade-off? A Study of Cooccurrence in Danish Twin Pairs Born 1900–1918. J Gerontol Ser A Biol Sci Med Sci 2012;67:489–94.
- Pedersen JK, Skytthe A, Christensen K. Cancer occurrence in offspring of long-lived siblings. In: Hofman A, editor. EuroEpi 2013; Aarhus, Denmark. Eur J Epidemiol: Springer; 2013, Aug 1; 28(1 Supplement): S11–2.
- Medawar PB. An unsolved problem of biology. H. K. Lewis & Co., London; 1952.
- Smith DW. Cancer mortality at very old ages. Cancer 1996;77:1367–72
- de Rijke JM, Schouten LJ, Hillen HF, Kiemeney LA, Coebergh JW, van den Brandt PA. Cancer in the very elderly Dutch population. Cancer 2000;89:1121–33.
- Arbeev KG, Ukraintseva SV, Arbeeva LS, Yashin AI. Mathematical models for human cancer incidence rates. Demogr Res 2005;12:237–72.
- Engholm G, Ferlay J, Christensen N, Bray F, Gjerstorff ML, Klint A, et al. NORDCAN – a Nordic tool for cancer information, planning, quality control and research. Acta Oncol 2010;49:725–36.
- Boscoe FP. Subdividing the age group of 85 years and older to improve US disease reporting. Am J Public Health 2008;98:1167–70.
- Hill ME, Preston SH, Rosenwaike I. Age reporting among white Americans aged 85+: Results of a record linkage study. Demography. 2000;37:175–86. English.
- Wallace SP, Mendez-Luck C, Castaneda X. Heading south: why Mexican immigrants in California seek health services in Mexico. Med Care 2009;47:662–9.
- Gjerstorff ML. The Danish Cancer Registry. Scand J Public Health 2011;39:42–5.
- Elo IT, Mykyta L, Sebastiani P, Christensen K, Glynn NW, Perls T. Age validation in the long life family study through a linkage to early-life census records. J Gerontol Ser B: Psychol Sci Social Sci 2013;68:580–5.
- Malig C. The civil registration system in Denmark. International Institution for Vital Registration and Statistics; 1996.
- Talbäck M, Dickman PW. Estimating expected survival probabilities for relative survival analysis–exploring the impact of including cancer patient mortality in the calculations. Eur J Cancer 2011;47:2626–32.
- Storm HH, Andersen J. Percentage of autopsies in cancer patients in Denmark in 1971-1980. Ugeskr Læger 1986;148:1110–14 (Danish).
- Helweg-Larsen K. The Danish register of causes of death. Scand J Public Health 2011;39:26–9.
- Oksuzyan A, Jeune B, Juel K, Vaupel JW, Christensen K. Changes in hospitalisation and surgical procedures among the oldest-old: A follow-up study of the entire Danish 1895 and 1905 cohorts from ages 85 to 99 years. Age Ageing 2013;42:476–81.
- Vallin J, Meslé F. Will life expectancy increase indefinitely by three months every year? Populat Soc 2010;473:1–4.
- Christensen K, Doblhammer G, Rau R, Vaupel JW. Ageing populations: the challenges ahead. Lancet 2009;374:1196–208.