
Abstract
Aims. Interaction between blood and bio-surfaces is important in many medical fields. With the aim of studying blood-mediated reactions to cellular transplants, we developed a whole-blood model for incubation of small volumes for up to 48 h.
Methods. Heparinized polyvinyl chloride tubing was cut in suitable lengths and sealed to create small bags. Multiple bags, with fresh venous blood, were incubated attached to a rotating wheel at 37°C. Physiological variables in blood were monitored: glucose, blood gases, mono- and divalent cations and chloride ions, osmolality, coagulation (platelet consumption, thrombin-antithrombin complexes (TAT)), and complement activation (C3a and SC5b-9), haemolysis, and leukocyte viability.
Results. Basic glucose consumption was high. Glucose depletion resulted in successive elevation of extracellular potassium, while sodium and calcium ions decreased due to inhibition of energy-requiring ion pumps. Addition of glucose improved ion balance but led to metabolic acidosis. To maintain a balanced physiological environment beyond 6 h, glucose and sodium hydrogen carbonate were added regularly based on analyses of glucose, pH, ions, and osmotic pressure. With these additives haemolysis was prevented for up to 72 h and leukocyte viability better preserved. Despite using non-heparinized blood, coagulation and complement activation were lower during long-term incubations compared with addition of thromboplastin and collagen.
Conclusion. A novel whole-blood model for studies of blood-mediated responses to a cellular transplant is presented allowing extended observations for up to 48 h and highlights the importance of stringent evaluations and adjustment of physiological conditions.
Introduction
Several of the achievements in modern medicine, e.g. haemodialysis, joint and dental prostheses, vessel grafts, vascular stents, and organ and cellular transplants, involve contact between circulating human blood and biomaterials, cells, or tissues. The contact between human blood and bio-surfaces triggers complex cascades of complement and coagulation activation as well as activation of immune cells (Citation1–3). To study these mechanisms there is a continuous need for new adequate whole-blood models to answer clinically relevant questions in preclinical settings.
Well-established examples of whole-blood models in the literature include incubating blood in rotating (Citation4,5) and rocking (Citation3) tubing loops or slide chambers (Citation6) as well as rocking test tubes (Citation7,8). The applications are potentially manifold; besides biocompatibility of artificial materials and tissues, assessment of coagulation, complement, and immune responses, also environmental investigations, toxicity, and drug studies are within the scope of use. Optimized human whole-blood models, as replacement for animal models, would benefit research outcome. Most studies with whole blood run for up to a maximum of 60 min. Beyond 6 h there is a complete lack of models described (Citation9). With regard to transplantation of functional pancreatic islets, in vitro blood models have been crucial in describing the instant blood-mediated inflammatory reaction (IBMIR) following infusion of ABO-compatible donor islets into the portal vein of the recipient (Citation3,10). This reaction starts with an immediate thrombotic and inflammatory reaction with activation of complement and coagulation cascades together with platelet aggregation, and is believed to cause a deleterious rapid loss of transplanted islets prior to engraftment (Citation3,11,12). Originally defined in islet transplantation, IBMIR has later been reported for hepatocytes, mesenchymal stromal cells (MSCs), and recently also in autologous islet transplantation (Citation13–15). The lack of in vitro whole-blood models beyond the first few hours creates a significant gap of knowledge (Citation8). Loop models often require volumes of approximately 4–7 mL blood to get appropriate blood flow in the loop system. This demands large volumes of valuable cellular material and drugs to be tested and makes it impossible to run multiple treatment groups and replicates during the same experiment.
The aim of the present study was to develop a whole-blood model allowing extended studies of blood-mediated responses to a cellular transplant using smaller blood volumes. Literature on physiology in circulating blood during long-term incubation is absent. Energy depletion, disturbed acid–base and ion balances and pH regulation, impaired gas exchange, extensive clotting, and haemolysis all belong to expected problems. Here we share our experiences, achievements, and pitfalls during method development. We describe the changes in blood physiology during incubations for up to 72 h and evaluate the relative importance of these changes and ways to counteract them.
Materials and methods
Ethical approval
The ethical review board in Uppsala approved the drawing of blood from healthy voluntary donors (Dnr 2008/264) and the use of exocrine cells obtained during islet isolation from human pancreas (Dnr 2009/371/2).
Heparinization and blood collection
Equipment in contact with blood was coated with two layers of a Corline heparin surface (Corline AB, Uppsala, Sweden) (Citation5). Fresh venous whole blood was drawn from healthy volunteers, using an 18-gauge needle and an open system, and no anticoagulant was added (Citation9). This manuscript is based on 35 whole-blood experiments using blood obtained from 17 healthy volunteers.
The rotating tubing bag model
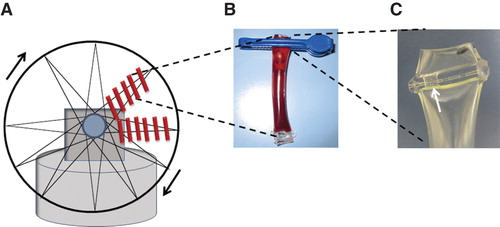
Referring to previous loop models (Citation3,4), we developed a method based on incubating whole blood in small bags of plastic tubing. Heparinized tubing was cut in suitable lengths (6 cm for 1 mL of blood) and sealed at one end (Biosealer CR 6, Ljungberg & Kögel AB, Helsingborg, Sweden). After application of 1 mL blood, the tube was sealed or clipped at the other end to form a small bag (). To avoid clotting and facilitate gas exchange an air bubble was left in the bag. Multiple bags were applied to a rotating wheel using rubber bands (). The rotating wheel was placed in a 36.5–37.0°C heating cabinet (Gallenkamp, Weiss Technik UK, Loughborough, United Kingdom) and set for a speed of about 10 revolutions per min (rpm), gently keeping the blood in motion. For experiments in 5% carbon dioxide (pCO2, partial pressure) a separate incubator was used (Galaxy R, LabRum A, Stockholm, Sweden) and a rocking device on slow motion, for practical reasons. Incubations were performed for a maximum of 72 h. Two tubing materials were tested: polyvinyl chloride (PVC) tubing (Tygon R-3630, Saint-Gobain, Courbevoie, France) with dimensions 6.4 mm × 0.8 mm (inner diameter and wall thickness) and silicone tubing (Pumpsil, Watson-Marlow, Falmouth, UK ) with dimensions 6.4 mm × 1.6 mm (inner diameter and wall thickness). Based on the permeability coefficient ((amount of gas (cm3) × tubing wall thickness (cm)/(surface area of tubing inner diameter (cm2) × time (s) × pressure drop across tubing wall (cmHg)), the silicone tubing used is 30 times more permeable to oxygen (O2) and 35 times more permeable to carbon dioxide (CO2), compared with the PVC tubing (Citation16). If not stated otherwise, data are presented from experiments using PVC tubing.
Figure 1. Schematic illustration of the rotating tubing bag whole-blood model. A. Multiple tubing bags attached to a rotating wheel in a 37°C cabinet using rubber bands. B. Tubing bags containing 1 mL of blood closed by sealing or a clip. C. A small hole left open for injections of additives (marked by an arrow).
Pancreatic exocrine tissue
Impure fractions containing exocrine tissue, including acinar tissue, from human islet isolations were used during method development. After being washed twice in PBS, 13–15 μL of exocrine tissue were added to 1 mL ABO-compatible whole blood at start. Human pancreases for islet isolation were obtained from brain-dead donors. Islets of Langerhans were isolated using a modified semi-automated method as previously described (Citation17). Exocrine tissue was cultured free-floating in islet medium for about 48 h prior to experiments—CMRL (Cellgro, Mediatech Inc, Manassas, VA, USA) 1066 culture medium with 10% human ABO serum and supplements (Citation18).
Coagulation controls
Five μL rabbit brain thromboplastin-S (Biopool International, Ventura, CA, USA), diluted 1:10 in PBS, were added to 1 mL whole blood. After reconstitution in 500 μL of distilled water, followed by a buffer exchange (Nanosep Omega 30 kDa; PALL Corporation, Port Washington, NY, USA) due to high glucose concentration in the lyophilized reagent, 30 μL of collagen reagent (COLtest, Dynabyte GmbH, Munich, Germany) were added to 1 mL of whole blood.
Additives for long-term incubation
To maintain a balanced physiological environment in the bags for long-term (>6 h) incubation, glucose (833 mmol L-1) and sodium hydrogen carbonate (1 mol L-1 NaHCO3) were added at regular intervals. For this purpose a small hole was left open at one end of the bags, and additives were injected using a Hamilton needle, towards the plastic inner surface of the tubing right above the blood surface (). This technique was developed to create as little mechanic disturbance and surface activation as possible. Glucose was adjusted to 10 mmol L-1 every 12 h based on glucose measurements, adding volumes of about 5–10 µL glucose. Plasma glucose concentrations were measured using a Glucometer (Bayer Contour, Bayer Healthcare, NY, USA). In the final model NaHCO3 was added in set microliter volumes every 12 to 24 h based on previous analysis of pH, standard bicarbonate (st.HCO3–) and osmolality (see further in Results).
End-point analysis
At the end of the incubation the bags were opened and blood was collected for further analysis. Blood gas analyses, including pH, lactate and plasma sodium and potassium ion concentrations, were performed on heparinized whole blood using a Roche Cobas b 221 instrument (Hoffmann-La Roche Ltd, Mannheim, Germany) and an ABL800 flex (Radiometer Medical, Bronshoj, Denmark). Plasma calcium and chloride ion concentrations were determined by the ABL800 flex system. Osmolality was measured in serum by a freezing-point depression method using an Osmometer Advance 2020 instrument (Advanced Instruments, Norwood, MA, USA). Lactate dehydrogenase (LD) activity in plasma was measured by an Abbott Architect instrument (Abbott Laboratories, IL, USA) and expressed as μkat L-1.
Ethylenediamine tetra-acetic acid (EDTA) was added to a final concentration of 0.1 mol L-1 before samples were taken for flow cytometry analysis and platelet counts, and spun down for plasma collection. Viability was estimated using phycoerythrin (PE) annexin V apoptosis detection kit I (BD Pharmingen, Erembodegem, Belgium). After lysis of red blood cells and two washing steps, remaining leukocytes were incubated with PE annexin V in a buffer containing 7-amino-actinomycin D (7-AAD). Cells were run on a BD FACS Calibur Canto II (BD Biosciences, San Jose, CA, USA) flow cytometer, and data were further analysed using BD FACSDiva (BD Biosciences, San Jose, CA, USA) and FlowJo (Tree Star Inc., OR, USA) commercial softwares. Cells were defined as viable, undergoing early apoptosis, or late apoptosis/dead. Phosphatidylserine exposed at the outer surface of the cell membrane was detected by staining with PE annexin V and by such means early stages of apoptosis (PE annexin V positive; 7-AAD negative), at a still reversible stage, were identified (Citation19). Membranes of permanently dead/damaged cells were permeable to 7-AAD. Platelet counts were measured using a Medonic CA 620 Hematology Analyzer (Boule Diagnostics AB, Spånga, Sweden) and a Coulter AcT diff hematology analyzer (Beckman Coulter Inc, Fullerton, CA, USA). After centrifugation at 4500 g for 10 min plasma was collected and stored at –80°C for further analyses. Thrombin-antithrombin (TAT) complexes were measured in plasma using a commercial ELISA kit (Nordic Diagnostica, Billdal, Sweden). C3a was detected using monoclonal antibody 4SD17.3 as capture antibody (Uppsala University, Uppsala, Sweden) and detected with biotinylated anti-C3a, followed by horseradish peroxidase (HRP)-conjugated streptavidin (Amersham, Little Chalfort, U.K). sC5b-9 (TCC, terminal complement complex) complexes were detected using a monoclonal antibody aE11 (Diatec, Oslo, Norway) as capture antibody and polyclonal rabbit anti-human C5 followed by HRP-conjugated polyclonal swine-rabbit Ig (both Dako, Glostrup, Denmark) for detection.
Statistics
All experiments were run with treatments in duplicate and data analysed by means of duplicates. Blood gas analysis, including mono- and divalent ions and osmolality, showed stable treatment effects and little variation between experiments; data are presented as means and range. Assessment for normal distribution was done prior to statistical analysis. Repeated measurement two-way ANOVA followed by Dunnet’s test for multiple comparisons was performed on log2-transformed protein data (TAT, C3a, and sC5b-9) to evaluate the main effect of thromboplastin and collagen addition compared with whole blood over 48 h incubation. Comparisons between groups were performed using paired t tests and repeated measurement ANOVA to account for the differences between blood donors and repeated measurements over time. The commercial program GraphPad Prism Version 6 (GraphPad Software, Inc., San Diego, CA, USA) was used for statistical analyses.
Results
Glucose consumption
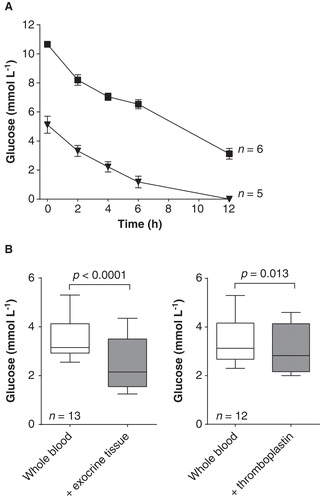
Basic energy metabolism, measured as glucose consumption, was high; 5.1 mmol L-1 in venous plasma glucose at start dropped to 2.2 mmol L-1 already after 4 h and <0.5 mmol L-1 (below detection limit) after 10–12 h (). By adding glucose at start and repeatedly every 12 h the glucose concentration was maintained at 3.5–10.0 mmol L-1 throughout the experiment. Addition of 13–15 μL exocrine tissue further increased glucose consumption corresponding to 1 mmol L-1 over 12 h (p < 0.0001) (). The glucose concentration also declined with addition of thromboplastin–on average 0.3 mmol L-1 over 12 h (p = 0.013) ().
Figure 2. Glucose consumption in whole blood, with and without addition of exocrine tissue and thromboplastin. A. Glucose consumption during incubation of blood for 12 h; fresh venous blood with no glucose added (▾) or with glucose added at start up to 10 mmol L-1 (▪). Data presented as means ± SEM. B. Glucose concentration after 12 h (adjusted to 10 mmol L-1 at start) with and without addition of exocrine tissue or thromboplastin. Box plots represent the 25th to 75th percentiles and the median; whiskers show maximum and minimum values. P values derived from paired t tests.
Extracellular sodium, potassium, ionized calcium, and chloride alterations
With no additives to whole blood extracellular K+ increased and Na+ decreased over time. Potassium ions reached upper physiological concentrations within 15 h incubation (slightly above 5 mmol L-1), thereafter dramatically increased to 9–14 mmol L-1 at 24 h and >20 mmol L-1 at 48–72 h (). The sodium ion concentration was at the lower reference concentration at 24 h (135–139 mmol L-1) and dropped further to approximately 110 mmol L-1 and below after 48–72 h incubation. By avoiding energy substrate depletion K+ and Na+ concentrations were normalized up to 24 h of incubation. Adjustment of acidosis resulted in K+ concentrations that were maintained <6.6 mmol L-1 for up to 48 h (). Ionized calcium spontaneously decreased over time from 1.2 mmol L-1 in venous blood to 1.0 mmol L-1 at 24 h and 0.4 mmol L-1 at 48–72 h. With addition of glucose, Ca2+ was kept at a concentration of 1.2 mmol L-1 over 72 h. With addition of NaHCO3 the Ca2+ concentration was slightly reduced over time but kept above 1.0 mmol L-1 for up to 48 h (). The chloride ion concentration remained close to reference values (100–110 mmol L-1) over the 72 h incubation period. Without additives Cl– slightly increased over time, and with additives it slightly decreased ().
pH and bicarbonate buffering
Without additives, lactate production rapidly increased within 24 h to approximately 14 mmol L-1 and remained stable over the next 24 h, and then it slowly decreased. Despite this increase in lactate, pH was stably maintained throughout the incubation (). With addition of glucose, pH drastically decreased over time, lactate concentrations remained high (>20 mmol L-1), and st.HCO3– together with base excess (BE) decreased (). Without buffer, pH dropped to approximately 7.0 at 24 h, 6.6 at 48 h, and 6.3 (or even below the detection limit of 6.3) at 72 h. After discouraging results with a Tris–HCl buffer (0.05 mol L-1; pH 7.5 at 34°C) and a Hepes buffer (25 mmol L-1, 40 mmol L-1, 100 mmol L-1, pH 7.4 at 36°C), metabolic acidosis was finally counteracted by adding small volumes of NaHCO3 (1 mol L-1). To accurately maintain pH at 7.0–7.1 for up to 36 h, addition of 10 µmoles (10 µL) NaHCO3 was needed at 12 h and 15 µmoles (15 µL) at 24 h. Then, pH fell to approximately 6.8–6.9 at 48 h. Incubation of exocrine tissue resulted in a decrease in pH of approximately 0.1 pH units at 48 h, requiring additional 7 µmoles (7 µL) of NaHCO3 at 36 h to maintain the mentioned pH levels ().
Figure 3. Blood gas analysis including A. Na+, K+, Ca2+, and Cl–; B. pH, lactate, standard bicarbonate (st.HCO3–) and base excess (BE); and C. pO2 and CO2 in venous blood at start and after 24, 48 and 72 h of incubation. C. Serum osmolality measured by a freezing-point depression method. Treatment groups: whole blood only (□ dashed line), whole blood with addition of glucose (○ dashed line), and whole blood with addition of glucose and NaHCO3 (• solid line). Glucose was added every 12 h; NaHCO3 at 12, 24, and 48 h. Total amount of NaHCO3 added up to 24, 48, and 72 h for presented data: 8–11 µmoles, 19–29 μmoles, and 33–40 μmoles; for osmolality data: 10 μmoles (12 h), 25 μmoles (24 h), and 40 μmoles (48 h). Data presented as means and range from 6–7 experiments (24–48 h) and 4–6 experiments (72 h). Ca2+, Cl–, st.HCO3– and osmolality data are derived from 2–4 experiments. The upper analytic limits for potassium and lactate were 20 mmol L-1.
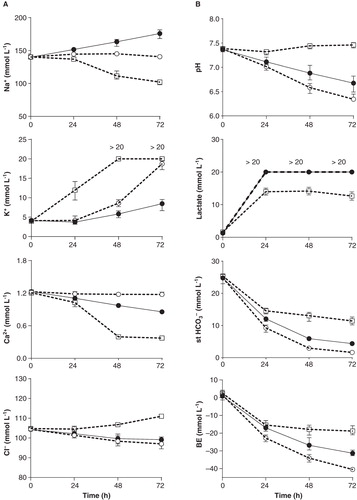
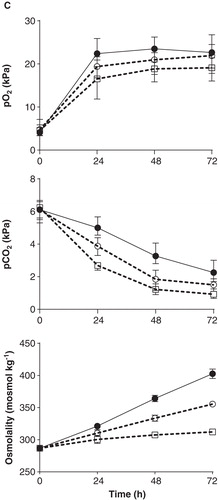
Table I. Blood gas analysis, including cations (Na+, K+, Ca2+) and anions (Cl–), and serum osmolality in whole blood at start and after 24, 48, and 72 h incubation with 12–15 μL of exocrine tissue. Glucose and NaHCO3 added every 12 h.
Osmolality
Addition of glucose and NaHCO3 together with endogenous production of metabolites created a hyperosmolar milieu. After 48 h, with repeated additions of glucose and a total of 25 μmoles (25 µL) NaHCO3, osmolality had increased from approximately 290 to 365 mosmol kg-1 (). With incubation in the presence of exocrine cells, demanding slightly more glucose and NaHCO3, osmolality increased further to 375 mosmol kg-1 at 48 h (). After 72 h incubation osmolality approached 400 mosmol kg-1 and above.
Partial oxygen (pO2) and carbon dioxide (pCO2) pressure
Despite documented low gas permeability through PVC plastic (Citation16) there was a continuous exchange of oxygen and carbon dioxide with the surrounding environment (). Several factors affected pO2 and pCO2, e.g. motion, tubing material, and addition of glucose/NaHCO3. Non-motion resulted in lower oxygen levels over time (data not shown). Highly permeable silicon material contributed to a faster equilibration with the surrounding environment and resulted in early non-physiological levels. Already at 6 h the pO2 level was 27 kPa and pCO2 0.8 kPa with glucose added. As expected, carbon dioxide exchange was important for pH regulation. When incubating whole blood in silicone tubing, pH initially increased to levels of approximately 7.5–7.6 (6–12 h) and then, from about 24 h, dropped to levels similar to or below those for PVC tubing. Due to less favourable physiological conditions for our purpose using the silicone tubing, together with the disadvantage of not being able to melt the silicone material with a tubing sealer, we continued to develop our model using PVC tubing. Incubations in a 5% pCO2 cabinet resulted in lower pH and comparably higher pCO2 (data not shown). Addition of glucose and NaHCO3 both contributed to a relative increase in pO2 and a decrease of the diminishing of pCO2 ().
Viability and haemolysis
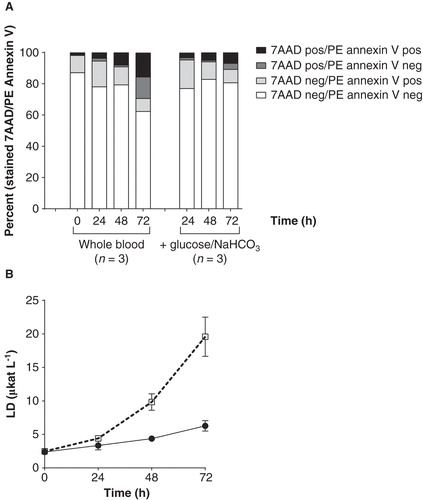
The percentage of fully viable leukocytes, staining neither for PE annexin V nor for 7-AAD, was about 80% for up to 48 h in all treatment groups (with or without additives and exocrine cells) (). An increased percentage of cells staining positive for 7-AAD was observed at 72 h in the group with no additives indicating loss of membrane integrity and cell death (p = 0.014) (). In the presence of glucose and NaHCO3 the percentage of viable leukocytes was constant for the entire observation period (72 h). Lactate dehydrogenase (LD) activity drastically increased after 24 h when incubating whole blood without additives resulting in LD activity of 10 μkat L-1 at 48 h and 20 μkat L-1 at 72 h (both corresponding to severe haemolysis) (). With addition of glucose and NaHCO3 the LD activity was kept at an average of 4.4 μkat L-1 at 48 h, slightly increasing to 6.3 μkat L-1 at 72 h ().
Figure 4. Viability and haemolysis (lactate dehydrogenase (LD) activity) in whole blood during incubation for 72 h. A. Viability of leukocytes measured as 7-AAD and PE annexin staining. Data presented as mean from three different experiments with or without addition of glucose and NaHCO3. Cells staining positive for 7-AAD represent late apoptosis or dead cells. Cells negative for 7-AAD but positive for PE annexin V represent early apoptosis. Cells negative for both 7-AAD and PE annexin V are viable. B. LD activity. Data presented as means from two different blood donors incubating whole blood only (□ dashed line) and whole blood with addition of glucose and NaHCO3 (• solid line).
Coagulation and complement activation
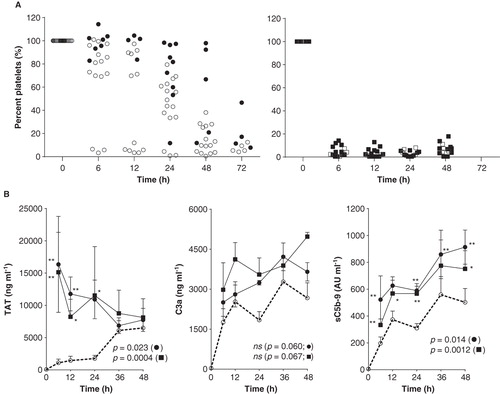
Coagulation and complement activation showed substantial variation between experiments and blood donors. Incubation of whole blood without additives usually gave no visual clotting over the first 12 h (sometimes up to 24 h) as reflected by platelet counts (). Addition of glucose/NaHCO3 resulted in somewhat increased clotting (). Addition of thromboplastin (n = 5) and collagen (n = 3) caused substantially lower platelet counts () and, up to 24 h, also elevated TAT production (p = 0.0004 and p = 0.023) (). Complement factors C3a and sC5b-9 showed increased concentrations in response to both thromboplastin and collagen (p = 0.0012 and 0.014 for sC5b-9) (). However, the effect on the concentration of C3a failed to reach statistical significance (p = 0.060 and 0.067) ().
Figure 5. Coagulation and complement activation during incubation for 72 h. A. Platelet consumption as percentage (%) compared with the platelet count in venous blood at start. Treatment groups: whole blood only (•) and whole blood with addition of glucose and NaHCO3 during incubation (○) (left panel); whole blood with thromboplastin (▪) and collagen (□) added at start and then glucose and NaHCO3 at regular intervals during incubation (right panel). Data derived from 17 experiments, each dot representing one tubing bag. B. Coagulation and complement activation. Production of thrombin-antithrombin (TAT) complexes, C3a and sC5b-9 for control blood (○ dashed line) and with addition of thromboplastin (▪ solid line; n = 5) and collagen (• solid line; n = 3). All groups received addition of glucose and NaHCO3 during incubation. The effect of thromboplastin and collagen compared with control blood was evaluated with repeated measurement ANOVA and P values given in the figures for collagen (•) and thromboplastin (▪). Post hoc analysis presented as asterisks (*P < 0.05, **P < 0.01).
Discussion
A novel human whole-blood model is presented for analysis of blood-mediated responses to tissues and cellular transplants up to 48 h. This model fills a substantial experimental gap by extending the observation time from less than 6 h to days and also by working with small-volume samples. With emphasis on extended studies of blood–cell interaction it was crucial to monitor and evaluate the effect of physiological changes in whole blood during long-term incubation. The presented model comprises the following entities: glucose monitoring, blood gas analysis including lactate and Na+, K+, Ca2+, and Cl– concentrations, osmolality, haemolysis (monitored by LD activity), blood leukocyte viability, coagulation activation (platelet consumption and TAT complexes formation), and complement activation (C3a, sC5b-9).
Energy metabolic turnover in whole blood, measured as glucose consumption, was high. Basic glucose consumption in drawn blood was early described foremost to depend on blood cell metabolism and not on plasma components (Citation20). Erythrocytes, lacking intracellular organelles including mitochondria, are solely dependent on anaerobic glycolysis, whereas cells of myeloid lineage (polymorphonuclear cells, monocytes) derive their energy from both anaerobic and aerobic glycolysis (Citation21–23). Neutrophils have few mitochondria, and even during highly energy-demanding activities like chemotaxis and respiratory burst they gain very little energy from respiration (Citation22,24,25). Lymphocytes are known to use oxidative phosphorylation to a higher extent than the mentioned immune cells (Citation26). Outnumbering the white blood cells by almost a thousand times, erythrocytes account for up to 90%–95% of the basic glucose utilization in whole blood (Citation20). Platelets, containing small amounts of functional mitochondria, use both glycolysis (∼60%) and oxidative phosphorylation (∼35%) for their highly energy-demanding activation (Citation27). Adding thromboplastin to whole blood increased glucose consumption in parallel with platelet consumption and coagulation activation. Addition of exocrine tissue accelerated glucose depletion even further. One could speculate that besides increased cellular metabolism by adding cells, the induced IBMIR, including platelet activation and coagulation as well as recruitment and activation of innate immune cells, contributed to this elevation of energy demand. Extracellular elevation of potassium and depression of sodium ion levels, in association with rapid energy depletion, made us believe that glucose deprivation resulted in a retardation of the energy-demanding Na/K-ATPase activity (Citation28). Early described for human erythrocytes, the Na/K-ATPase is a crucial ion transport system in eukaryotic cells which sustains the electrochemical potential and by that protects the cells from water-induced osmotic swelling (Citation28,29). The discovery of inhibition of Na/K-ATPase by increased levels of intracellular calcium ions historically led to the finding of another vital energy-demanding ion pump in erythrocytes, the Ca2+-ATPase, to maintain a low intracellular Ca2+ concentration (Citation30). Based on the fact that erythrocytes are by far the dominating cell type, these two structurally alike ATPases play a central role in the observed cation changes. Stable intra- and extracellular levels of ionized calcium are vital when studying coagulation, inflammation, and immune activation. Intracellular signalling during immune cell activation as well as coagulation and complement activation are highly dependent on calcium ion homeostasis (Citation31,32).
Normalized glucose concentrations in our model stabilized the cation balances at the expense of an enhanced energy metabolism resulting in metabolic acidosis. Adjusting pH in a closed whole-blood system became an osmotic challenge. In human blood a pH of 6.8 has occasionally been tolerated in clinical circumstances as extreme ketoacidosis, hypoventilation, or anaerobic exercises (Citation33). In inflammatory microenvironments as those generated by tumors, inflammatory reactions to pathogens, and autoimmune inflammation, extracellular pH can locally be considerably lower (5.6–5.8) (Citation34). As summarized in two excellent reviews by Lardner (Citation35) and Kellum et al. (Citation36), acidosis does have an effect on the immune response. Severe acidosis (5.5–6.0), especially in combination with hypoxia, impairs chemotaxis in neutrophils, while the respiratory burst can be depressed already at a pH of 6.7 (Citation35,37,38). A study on resident macrophages indicates a drop in TNF-α secretion at pH 6.5, but more prominent at pH 5.5 (Citation39). The literature is, however, contradictive, and data also support enhanced immune function for macrophages under acidic conditions (pH 6.8) (Citation40). Interesting recent studies on natural killer (NK) cells imply enhanced NK cell-mediated killing of a fungal agent (cryptococcus) in an acidic environment (pH 6.8), whereas anti-tumoral killing was impaired at acidosis, demonstrating the complexity of the question how immune function is affected by pH (Citation41). Impaired non-major histocompatibility complex restricted killing at a tumor site (performed by NK cells and lymphokine-activated killer (LAK) cells) has previously been suggested at acidosis (pH 6.5) (Citation42). Not only immune cells are affected by an acidic pH. Acidosis down-regulates platelet haemostatic functions such as spreading and adhesion, successively at pH 6.5–7.0 (Citation43). Complement activation with increased levels of C3a and C5a was recorded in lactacidosis and respiratory acidosis below pH 7.0 (Citation44). As stated by Lardner, in vitro experiments evaluating pH-dependent mechanisms are almost exclusively conducted in non-physiologically buffered media with different acidic sources and therefore hard to interpret and compare (Citation35). A study performed in bicarbonate-buffered media showed increased neutrophil activation at acidosis (pH 6.5–7.0), a reaction not seen when bicarbonate was absent (Citation45). An up-regulation of neutrophil pro-inflammatory response mediated by platelets in an acidotic environment (6.5–7.0) has also been shown (Citation43). These later data agree with the essential role of neutrophils in acidic inflammatory microenvironments.
The effect of osmolality on whole-blood physiology and immune function is even harder to evaluate based on the sparse literature available since experimental conditions vary widely and the biological relevance is hard to grasp. Impaired neutrophil function measured by several different assays (superoxide production, migration, phagocytosis) has been described at osmotic pressures above 400–450 mosmol kg-1 (Citation46,47). Experimental and clinical data on the use of hypertonic salt solution provided some additional information (Citation48–50). In vitro assays demonstrated gradual impairment of neutrophil functions with increasing hypertonicity (addition of 10–50 mmol L-1 NaCl) (Citation48). A clinical study could not fully confirm these findings (Citation50). The same research group has also reported on restored T-cell functions with administration of hypertonic salt solution to trauma patients (Citation49). This report claims a positive osmotic effect on T-cell function in contrast to other studies showing impaired lymphocyte function as a result of elevated osmotic pressure (Citation51). Regarding the effect of osmotic pressure on erythrocytes, studies in the 1940s showed that below about 1.5 mol L-1 NaCl no hypertonic haemolysis occurs (Citation52). The concept of post-hypertonic haemolysis later stated that below a concentration of 670 mmol L-1 NaCl (corresponding to approximately 1300 mosmol kg-1) red blood cells could safely be moved into an isotonic environment without haemolysis (Citation53). Based on these thoroughly performed studies our concentration of sodium salts is safely low regarding haemolysis of red blood cells.
Against this background a pH above 6.8 and an osmolality below 400 mosmol kg-1 were considered acceptable for immune and coagulation studies in a whole-blood system. Since these limits, together with cation disturbances, were compromised beyond 48 h, especially with addition of exocrine cells, we believe that precautions must be taken for future in vitro studies beyond this time limit. The absence of major signs of haemolysis, together with sustained leukocyte viability up to 72 h with the elaborated additives, reflect the sustainability of the system. When designing a blood model it is fundamental to define what conditions the model should mimic. Here, our aim was to design a human whole-blood model mimicking the environment in portal vein liver branches where islets are trapped early after intraportal islet transplantation (Citation54). In this setting rapid activation of coagulation and complement systems occurs together with a high metabolic consumption, causing lowering of the pH in the microenvironment surrounding the islets trapped within the clots, cf. the microenvironment in the in vitro system described. We chose not to add anticoagulants since these agents will influence the innate immunity, which meant that we allowed a higher intrinsic background activity within the system. Depending on future applications of the model, evaluation of background activation and possibly addition of low doses of anticoagulants can be beneficial. The study demonstrates the feasibility of long-term incubation of whole blood under sustained physiological conditions, posing intriguing questions for future studies.
Acknowledgements
The authors thank the islet isolation team at the Rudbeck lab, Uppsala, for their skilled work as well as all the blood donors for kindly contributing with their blood. We also thank Anders Larsson and Yuji Teramura for valuable input during the method development. This study was supported by grants from the Swedish Medical Research Council, the Nordic Insulin Fund, the Ernfors Family Fund, the Swedish Diabetes Association, Diabetes Wellness–Sweden, the Juvenile Diabetes Research Foundation International, AFA Insurances, and European Community’s Seventh Framework Program. M.H. was supported by grants from the Centre for Clinical Research (CKF) Dalarna, and Dalarna County Council. O.K.’s and B.N.’s positions are in part supported by the National Institutes of Health. Human pancreatic islets were obtained from The Nordic Network for Clinical Islet Transplantation, supported by the Swedish national strategic research initiative EXODIAB (Excellence of Diabetes Research in Sweden) and the Juvenile Diabetes Research Foundation.
Declaration of interest: The authors report no conflicts of interest. The authors alone are responsible for the content and writing of the paper.
References
- Courtney JM, Lamba NM, Sundaram S, Forbes CD. Biomaterials for blood-contacting applications. Biomaterials. 1994;15:737–44.
- Nilsson B, Ekdahl KN, Mollnes TE, Lambris JD. The role of complement in biomaterial-induced inflammation. Mol Immunol. 2007;44:82–94.
- Bennet W, Sundberg B, Groth CG, Brendel MD, Brandhorst D, Brandhorst H, et al. Incompatibility between human blood and isolated islets of Langerhans: a finding with implications for clinical intraportal islet transplantation? Diabetes. 1999;48:1907–14.
- Gong J, Larsson R, Ekdahl KN, Mollnes TE, Nilsson U, Nilsson B. Tubing loops as a model for cardiopulmonary bypass circuits: both the biomaterial and the blood-gas phase interfaces induce complement activation in an in vitro model. J Clin Immunol. 1996;16:222–9.
- Andersson J, Sanchez J, Ekdahl KN, Elgue G, Nilsson B, Larsson R. Optimal heparin surface concentration and antithrombin binding capacity as evaluated with human non-anticoagulated blood in vitro. J Biomed Mater Res A. 2003;67:458–66.
- Hong J, Nilsson Ekdahl K, Reynolds H, Larsson R, Nilsson B. A new in vitro model to study interaction between whole blood and biomaterials. Studies of platelet and coagulation activation and the effect of aspirin. Biomaterials. 1999;20:603–11.
- Mollnes TE, Brekke OL, Fung M, Fure H, Christiansen D, Bergseth G, et al. Essential role of the C5a receptor in E coli-induced oxidative burst and phagocytosis revealed by a novel lepirudin-based human whole blood model of inflammation. Blood. 2002;100:1869–77.
- Moberg L, Korsgren O, Nilsson B. Neutrophilic granulocytes are the predominant cell type infiltrating pancreatic islets in contact with ABO-compatible blood. Clin Exp Immunol. 2005;142:125–31.
- Ekdahl KN, Hong J, Hamad OA, Larsson R, Nilsson B. Evaluation of the blood compatibility of materials, cells, and tissues: basic concepts, test models, and practical guidelines. Adv Exp Med Biol. 2013;735:257–70.
- Johansson H, Lukinius A, Moberg L, Lundgren T, Berne C, Foss A, et al. Tissue factor produced by the endocrine cells of the islets of Langerhans is associated with a negative outcome of clinical islet transplantation. Diabetes. 2005;54:1755–62.
- Moberg L, Johansson H, Lukinius A, Berne C, Foss A, Kallen R, et al. Production of tissue factor by pancreatic islet cells as a trigger of detrimental thrombotic reactions in clinical islet transplantation. Lancet. 2002;360:2039–45.
- van der Windt DJ, Bottino R, Casu A, Campanile N, Cooper DK. Rapid loss of intraportally transplanted islets: an overview of pathophysiology and preventive strategies. Xenotransplantation. 2007;14:288–97.
- Gustafson EK, Elgue G, Hughes RD, Mitry RR, Sanchez J, Haglund U, et al. The instant blood-mediated inflammatory reaction characterized in hepatocyte transplantation. Transplantation. 2011;91:632–8.
- Moll G, Rasmusson-Duprez I, von Bahr L, Connolly-Andersen AM, Elgue G, Funke L, et al. Are therapeutic human mesenchymal stromal cells compatible with human blood? Stem Cells. 2012;30:1565–74.
- Naziruddin B, Iwahashi S, Kanak MA, Takita M, Itoh T, Levy MF. Evidence for instant blood-mediated inflammatory reaction in clinical autologous islet transplantation. Am J Transplant. 2014;14:428–37.
- Permeability coefficients for peristaltic pump tubings. Saint-Gobain Performance Plastics. Available at http://www.processsystems.saint-gobain.com/uploadedFiles/SGPPL-PS/Documents/Peri_Pump/PS-PeriPumps-Permeability(1).pdf [Last accessed 16 September 2011].
- Goto M, Eich TM, Felldin M, Foss A, Kallen R, Salmela K, et al. Refinement of the automated method for human islet isolation and presentation of a closed system for in vitro islet culture. Transplantation. 2004;78:1367–75.
- Stahle MU, Brandhorst D, Korsgren O, Knutson F. Pathogen inactivation of human serum facilitates its clinical use for islet cell culture and subsequent transplantation. Cell Transplant. 2011;20:775–81.
- Hammill AK, Uhr JW, Scheuermann RH. Annexin V staining due to loss of membrane asymmetry can be reversible and precede commitment to apoptotic death. Exp Cell Res. 1999;251:16–21.
- Bartlett GR, Marlow AA. Comparative effects of the different formed elements on normal human blood glycolysis. J Appl Physiol. 1953;6:335–47.
- van Wijk R, van Solinge WW. The energy-less red blood cell is lost: erythrocyte enzyme abnormalities of glycolysis. Blood. 2005;106:4034–42.
- Kominsky DJ, Campbell EL, Colgan SP. Metabolic shifts in immunity and inflammation. J Immunol. 2010;184:4062–8.
- Everts B, Amiel E, van der Windt GJ, Freitas TC, Chott R, Yarasheski KE, et al. Commitment to glycolysis sustains survival of NO-producing inflammatory dendritic cells. Blood. 2012;120:1422–31.
- van Raam BJ, Sluiter W, de Wit E, Roos D, Verhoeven AJ, Kuijpers TW. Mitochondrial membrane potential in human neutrophils is maintained by complex III activity in the absence of supercomplex organisation. PLoS ONE. 2008;3:e2013.
- Borregaard N, Herlin T. Energy metabolism of human neutrophils during phagocytosis. J Clin Invest. 1982;70:550–7.
- Fox CJ, Hammerman PS, Thompson CB. Fuel feeds function: energy metabolism and the T-cell response. Nat Rev Immunol. 2005;5:844–52.
- Zharikov S, Shiva S. Platelet mitochondrial function: from regulation of thrombosis to biomarker of disease. Biochem Soc Trans. 2013;41:118–23.
- Whittam R. Potassium movements and ATP in human red cells. J Physiol. 1958;140:479–97.
- Post RL, Merritt CR, Kinsolving CR, Albright CD. Membrane adenosine triphosphatase as a participant in the active transport of sodium and potassium in the human erythrocyte. J Biol Chem. 1960;235:1796–802.
- Schatzmann HJ. ATP-dependent Ca++-extrusion from human red cells. Experientia. 1966;22:364–5.
- Brechard S, Tschirhart EJ. Regulation of superoxide production in neutrophils: role of calcium influx. J Leukoc Biol. 2008;84:1223–37.
- Rink TJ, Sage SO. Calcium signaling in human platelets. Annu Rev Physiol. 1990;52:431–49.
- Baker JM, Candy DJ, Hawker RJ. Influences of pH on human platelet metabolism. Platelets. 2001;12:333–42.
- Thistlethwaite AJ, Leeper DB, Moylan DJ3rd, Nerlinger RE. pH distribution in human tumors. Int J Radiat Oncol Biol Phys. 1985;11:1647–52.
- Lardner A. The effects of extracellular pH on immune function. J Leukoc Biol. 2001;69:522–30.
- Kellum JA, Song M, Li J. Science review: extracellular acidosis and the immune response: clinical and physiologic implications. Crit Care. 2004;8:331–6.
- Leblebicioglu B, Lim JS, Cario AC, Beck FM, Walters JD. pH changes observed in the inflamed gingival crevice modulate human polymorphonuclear leukocyte activation in vitro. J Periodontol. 1996;67:472–7.
- Gabig TG, Bearman SI, Babior BM. Effects of oxygen tension and pH on the respiratory burst of human neutrophils. Blood. 1979;53:1133–9.
- Heming TA, Dave SK, Tuazon DM, Chopra AK, Peterson JW, Bidani A. Effects of extracellular pH on tumour necrosis factor-alpha production by resident alveolar macrophages. Clin Sci (Lond). 2001;101:267–74.
- Park SY, Bae DJ, Kim MJ, Piao ML, Kim IS. Extracellular low pH modulates phosphatidylserine-dependent phagocytosis in macrophages by increasing stabilin-1 expression. J Biol Chem. 2012;287:11261–71.
- Islam A, Li SS, Oykhman P, Timm-McCann M, Huston SM, Stack D, et al. An acidic microenvironment increases NK cell killing of Cryptococcus neoformans and Cryptococcus gattii by enhancing perforin degranulation. PLoS Pathog. 2013;9:e1003439.
- Muller B, Fischer B, Kreutz W. An acidic microenvironment impairs the generation of non-major histocompatibility complex-restricted killer cells. Immunology. 2000;99:375–84.
- Etulain J, Negrotto S, Carestia A, Pozner RG, Romaniuk MA, D’Atri LP, et al. Acidosis downregulates platelet haemostatic functions and promotes neutrophil proinflammatory responses mediated by platelets. Thromb Haemost. 2012;107:99–110.
- Emeis M, Sonntag J, Willam C, Strauss E, Walka MM, Obladen M. Acidosis activates complement system in vitro. Mediators Inflamm. 1998;7:417–20.
- Trevani AS, Andonegui G, Giordano M, Lopez DH, Gamberale R, Minucci F, et al. Extracellular acidification induces human neutrophil activation. J Immunol. 1999;162:4849–57.
- Hampton MB, Chambers ST, Vissers MC, Winterbourn CC. Bacterial killing by neutrophils in hypertonic environments. J Infect Dis. 1994;169:839–46.
- Bryant RE, Sutcliffe MC, McGee ZA. Effect of osmolalities comparable to those of the renal medulla on function of human polymorphonuclear leukocytes. J Infect Dis. 1972;126:1–10.
- Junger WG, Hoyt DB, Davis RE, Herdon-Remelius C, Namiki S, Junger H, et al. Hypertonicity regulates the function of human neutrophils by modulating chemoattractant receptor signaling and activating mitogen-activated protein kinase p38. J Clin Invest. 1998;101:2768–79.
- Loomis WH, Namiki S, Hoyt DB, Junger WG. Hypertonicity rescues T cells from suppression by trauma-induced anti-inflammatory mediators. Am J Physiol Cell Physiol. 2001;281:C840–8.
- Angle N, Cabello-Passini R, Hoyt DB, Loomis WH, Shreve A, Namiki S, et al. Hypertonic saline infusion: can it regulate human neutrophil function? Shock. 2000;14:503–8.
- Lang KS, Weigert C, Braedel S, Fillon S, Palmada M, Schleicher E, et al. Inhibition of interferon-gamma expression by osmotic shrinkage of peripheral blood lymphocytes. Am J Physiol Cell Physiol. 2003;284:C200–8.
- Nils S. Hemolysis by hypertonic solutions of neutral salts. Acta Physiol Scand. 1944;7:56–68.
- Zade-Oppen AM. Posthypertonic hemolysis in sodium chloride systems. Acta Physiol Scand. 1968;73:341–64.
- Korsgren O, Lundgren T, Felldin M, Foss A, Isaksson B, Permert J, et al. Optimising islet engraftment is critical for successful clinical islet transplantation. Diabetologia. 2008;51:227–32.