Abstract
Background: High-glucose-based peritoneal dialysis solution (PDS) is considered to be one of the primary causes for the increase of ionic permeability in peritoneum as detected by transmesothelial electrical resistance (TER) measurements and claudin-1 expression. However, the mechanism is not clear. The aim of this study is to test the hypothesis that high-glucose PDS induces hyperpermeability in human peritoneal mesothelial cell (HPMC) monolayer by mitochondrial respiratory chain complex III pathway. Methods: HPMCs were cultured in a 1 : 1 mix of Dulbecco's modified Eagle's medium (DMEM) and PDS containing 1.5% and 4.25% glucose for 24 h. A 1 : 1 mixture of 160 mg/L glutathione and 4.25% glucose PDS was also added as an antioxidant group. TER measurement and immunostaining and western blot analysis of claudin-1 expression were examined for detection of permeability damage in HPMCs. MitoSOX™ Red staining and respiratory chain complexes' activities were determined for detection of mitochondrial reactive oxygen species (ROS) production and mitochondrial complexes' activities. Results: TER decreased in a time- and concentration-dependent manner after culture with high-glucose PDS for 24 h. Claudin-1 was also downregulated. Complex III activity was inhibited accompanied by increasing mitochondrial ROS generation. These changes were partially prevented by glutathione. Conclusion: These findings demonstrate that mitochondrial respiratory complex III pathway has crucial importance in maintaining permeability of HPMCs, which might reveal a valuable target for novel therapies to fight hyperpermeability of peritoneum during the prolonged PD treatment.
INTRODUCTION
Peritoneal dialysis (PD) is a successful and effective form of therapy for end-stage renal disease (ESRD). However, progressive ultrafiltration failure (UFF), which is mainly caused by increasing hyperpermeability of the peritoneal membrane, is one of the major complications of long-term PD.Citation1 Transmesothelial electrical resistance (TER) is a measure of transmesothelial ionic permeability. Previous studies have reported a clear relationship between the decrease of TER values and the increase of solute permeability in different types of cells.Citation2,Citation3 Our previous studies have also reported high-glucose PD solution (PDS) could result in the decrease of TER values, indicating an increase of solute permeability in human peritoneal mesothelial cell (HPMC) monolayer.Citation4 In addition, claudin-1, which localizes in the intercellular space of HPMCs, belongs to tight junctions (TJs) family and is also generally believed to act as a permeability barrier between adjacent cells in mesothelial sheets.Citation5,Citation6 However, the mechanism of hyperpermeability induced by high-glucose-based PDS is not well known.
Reactive oxygen species (ROS) was reported to play a key role in cell damage by high glucose.Citation7 Exposure of HPMCs to exogenous oxidant agent can increase permeability accompanied by a reduction in TER in HPMCs.Citation7,Citation8 The vast majority of cellular ROS (estimated at ∼90%) are from mitochondrial electron transport chain, especially respiratory chain complex III.Citation9 These results indicated that mitochondrial respiratory chain complex III might play an important role in high-glucose PDS-induced damage in permeability of peritoneum.
In this study, we focus on the effect of high-glucose PDS and its mechanisms on the decreased TER through respiratory chain complex III pathway in HPMCs to reveal a valuable target for novel therapies to fight hyperpermeability of peritoneum during the prolonged PD treatment.
MATERIALS AND METHODS
Cell culture
An HPMC line (HMrSV5, kindly provided by Prof. Piedagnel R,Citation10 Hospital TENON, Paris, France) was cultured in Dulbecco's modified Eagle's medium (DMEM) supplemented with 10% heat-inactivated fetal bovine serum (FBS), 20 mmol/L hydroxyethyl piperazine ethanesulfonic acid (HEPES), and 2 mmol/L l-glutamine. Cells were incubated at 37°C in a humidified atmosphere with 5% CO2. The medium was changed every 2 or 3 days and cells were cultured in a 1 : 1 mixture of PDS (Baxter Healthcare Ltd., Deerfield, IL, USA) and DMEM as follows: (1) serum-free DMEM (control); (2) DMEM + 1.5% glucose PDS (1.5% PDS); (3) DMEM + 4.25% glucose PDS (4.25% PDS); and (4) 4.5% glucose PDS + 160 mg/L glutathione (4.25% PDS + glutathione). All chemicals, unless otherwise stated, were obtained from Gibco BRL Company, Rockville, MD, USA.
Construction of a HPMC monolayer on a membrane support
To construct an in vitro model of the HPMC monolayer, a cell suspension (5 × 10⁴ cells/cm2) was seeded and cultured on a polyester filter (0.4-μm pore size; Transwell, 12-well type, Millipore, Bedford, MA, USA), using 10% FBS/DMEM. The inner and the outer chambers were filled with 0.5 and 1.5 mL of the culture medium, respectively, and the culture medium was replaced every 3 days.
Measurement of transmesothelial electrical resistance
TER was measured daily by a Millicell-ERS ohmmeter with electrodes (Millipore) that were inserted into both sides of the filter until a steady state was reached. Alternating current applied between the electrodes was within ± 20 μA at a frequency of 12.5 Hz. Prior to the measurement, the culture medium was replaced with fresh medium (0.1% FBS/DMEM medium) and was maintained at 37°C. The resistance of the monolayer was multiplied by the effective surface area to obtain the electrical resistance of the monolayer (Ω cm2). The background TER of the blank Transwell filter was subtracted from the TER of the cell monolayer. Once stable resistances were obtained, four different culture media as described above were tested (n = 6). After the addition of test solutions, measurements were taken at 0, 3, 6, 12, and 24 h.
Immunostaining of claudin-1
HPMCs were cultured on a 24-chamber slide (Corning, New York, NY, USA). Following confluence, HPMCs were washed twice with phosphate-buffered saline (PBS); the medium was replaced with a fresh medium of 0.1% FBS/DMEM for another 24h. Subsequently, the cells were washed twice with PBS and then cultured for 24 h in the test media. Next, the cells were fixed in cold acetone/methanol at 4°C for 5 min, rehydrated in PBS, and blocked for 1 h in PBS containing 20% Block Ace (Dainippon Seiyaku, Tokyo, Japan). This was followed by an overnight incubation with a primary antibody at 4°C. A mouse anticlaudin-1 antibody (Santa Cruz Biotechnology Inc., Santa Cruz, CA, USA) was used as primary antibodies at a dilution of 1 : 30. After washing 5 times with PBS, an appropriate secondary antibody (1 : 100) labeled with fluorescein isothiocyanate (FITC) was applied for 1 h at room temperature, and the cells were again washed with PBS. Stained specimens were examined under a fluorescence microscope (ECLIPSE Ti, NIKON, Japan).
Western blot analysis of claudin-1
Cells were cultured in 100 mm dishes. After the cultures were confirmed to be confluence, they were cultured for 24 h in the test media. Next, cells were again washed twice with PBS and were lysed in a culture dish by adding 900 mL of TRIZOL® Reagent (Life Technologies, Carlsbad, CA, USA). Cellular protein was isolated and 20 mg of total protein, as measured with the bicinchoninic acid (BCA) protein assay (Pierce, Rockford, IL, USA), was dissolved in sodium dodecyl sulfate–polyacrylamide gel electrophoresis (SDS–PAGE) sample buffer and boiled for 3 min. Samples were subjected to SDS–PAGE on 8% gels and then transferred to polyvinylidene fluoride (PVDF) membranes (Millipore). The membranes were blocked for 1h at room temperature in PBS containing 1% Tween 20 (Katayama Chemical, Osaka, Japan) and 20% Block Ace (PBST-20% Block Ace) and were incubated for 1h with a mouse anticlaudin-1 antibody (1 : 500). Then the membranes were washed in PBST-20% Block Ace and incubated for 1h at room temperature with an appropriate secondary antibody (1 : 5000) labeled with horseradish peroxidase (Santa Cruz Biotechnology Inc.). After incubation, the membranes were washed again and the reaction products were detected by chemiluminescence (Amersham Pharmacia Biotech, Uppsala, Sweden). The intensity of each band was estimated using NIH image software (version 1.61).
ROS measurements
MitoSOX™ Red reagent (MolecularProbes, Eugene, OR, USA) is readily oxidized by superoxide in the mitochondria, emitting a bright red fluorescence in the cytoplasm. Cells were treated with the tested media for 24 h before the addition of MitoSOX™ to the culture media. Then cells were incubated in the dark at 37°C. After 10 min, the cells were washed with PBS and viewed under a fluorescent microscope. Fluorescence intensity was assessed by the imaging system Metamorph 3.5 on a region of interest that included the whole observational field.
Respiratory chain complex activities
Enzyme activities were performed at room temperature using Beckman Coulter DU 53 Spectrophotometer (Beckman Coulter, CA, USA). Citrate synthase activity was measured as described.Citation11 Activities of complexes I–IV were assayed as described.Citation12 All activity results are averages of six assays from each group. Citrate synthase assay results were used to normalize levels of mitochondrial proteins.
Statistical analysis
Results were expressed as mean ± SD. Comparison between two values was performed by Student's t-test. For multiple comparisons among different groups of data, the significant differences were determined by the Bonferroni method. Significance was defined at p < 0.05.
RESULTS
Effects of high-glucose PDS and glutathione on TER of human peritoneal mesothelial monolayer
The TER of HPMC monolayer was measured daily using Millicell-Electrical Resistance System (ERS). shows that the normalized TER, which was obtained by subtraction of the background TER of the blank Transwell, increased steadily, beginning at 0 and leveling off at 34.7 ± 1.5 Ω cm2 on the second day (n = 6). This was accompanied by the confluence of cells (). As shown in , the normalized TER of the HPMC monolayer reduced gradually in a time- and concentration-dependent manner in the presence of glucose-based PDS. A decrease of TER from 34.7 ± 1.5 Ω cm2 to 4.3 ± 1.4 Ω cm2 within 24 h was induced by 4.25% glucose PDS/DMEM. TER values in lower concentrations of glucose PDS (1.5% glucose PDS) group also showed a tendency to decline but were less pronounced. In addition, TER values in glutathione group showed a relatively stable state, which is similar to the 1.5% PDS group, ranging from 32.7 ± 0.6 Ω cm2 to 14.7 ± 0.5 Ω cm2.
Figure 1. Effects of high-glucose PDS and glutathione on TER of human peritoneal mesothelial monolayer cultured on a polyester membrane Transwell support (pore size, 0.4 μm). (a) TER was measured daily after a cell suspension (5 × 10⁴ cells/cm2) was seeded and cultured on a polyester filter. The normalized TER was obtained by subtraction of background TER of the blank filter. (b) This was accompanied by the confluence of the HPMCs (×100). (c) Once stable resistances were obtained, four different culture media were tested (n = 6). Then, TER measurements were taken at 0, 3, 6, 12, and 24 h. TER of the HPMC monolayer reduced gradually in a time- and concentration-dependent manner in the presence of glucose-based PDS. Glutathione could reverse these changes. *p < 0.05 versus control; **p < 0.05 versus control; and ***p < 0.05 versus 4.25% PDS group.
Effects of high-glucose PDS and glutathione on claudin-1 expression of HPMCs
In the immunostaining experiment (), the cell contour was clearly outlined by the staining for claudin-1 in control culture. The contour for claudin-1 decreased and became discontinuous after stimulation with 4.25% glucose-based PDS. However, supplement of glutathione caused only a slight decrease in the expression of claudin-1 with slight discontinuity of staining along the cell contour.
Figure 2. Effects of high-glucose PDS and glutathione on claudin-1 expression of HPMCs. (a) HPMCs treated with various media. Immunostaining of claudin-1 were detected after 24 h of incubation (×600). Claudin-1 decreased and became discontinuous after treated with 4.25% glucose PDS. Glutathione could reverse high-glucose-mediated reduction of claudin-1 expression. A, Control: DMEM; B, 1.5% glucose PDS; C, 4.25% glucose PDS; and D, glutathione + 4.25% PDS. (b) Western blot analysis of claudin-1 after HPMCs were cultured in different media. Claudin-1 expression was markedly reduced by 4.25% glucose PDS, whereas glutathione could obviously reverse the changes. Data show the mean values of three experiments. The control value was assumed to be 100%. *p < 0.05 versus control; **p < 0.05 versus 1.5% PDS group; and ***p < 0.05 versus 4.25% PDS group.
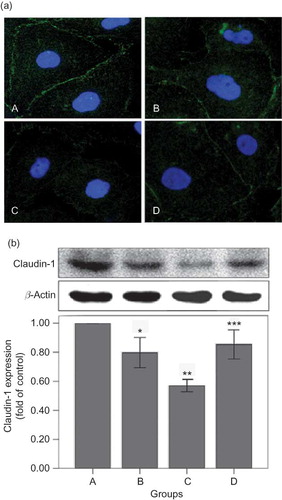
In the western blot analysis (), 4.25% glucose-based PDS decreased the level of claudin-1. All these changes were significantly reversed by glutathione supplement.
Effects of high-glucose PDS and glutathione on mitochondrial ROS production of HPMCs
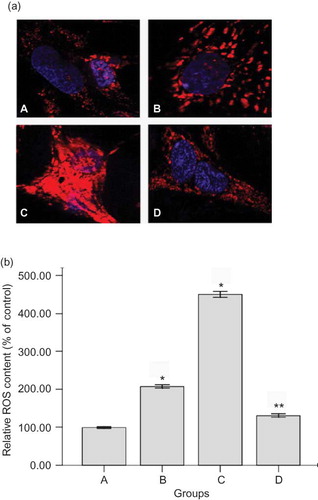
For measurements of ROS, the mitochondrial ROS sensor MitoSOX™ Red reagent was used for detection of HPMCs under the treatment of PDS (). The cells have very low MitoSOX fluorescence (red color) in cytoplasm of cells in both the 1.5% PDS group and the control. High-glucose-based PDS significantly triggers an increase in mitochondrial superoxide formation (increasing red fluorescence) (p < 0.05) (). Glutathione could partially prevent high-glucose-mediated changes of ROS production (p < 0.01).
Figure 3. Effects of high-glucose PDS and glutathione on mitochondrial ROS production of HPMC monolayer. (a) Representative photomicrographs viewed under a fluorescent microscope for mitochondrial ROS (MitoSOX red) (×600) and (b) quantification of ROS ratios (n = 3) after 24 h of incubation with tested media. Mitochondrial ROS significantly increased induced by high-glucose PDS. Glutathione could partially reverse the changes. *p < 0.05 versus control; **p < 0.01 versus 4.25% PDS group. A, Control: DMEM; B, 1.5% glucose PDS; C, 4.25% glucose PDS; and D, glutathione + 4.25% PDS.
Effects of high-glucose PDS and glutathione on mitochondrial respiratory chain complexes' activities of HPMCs
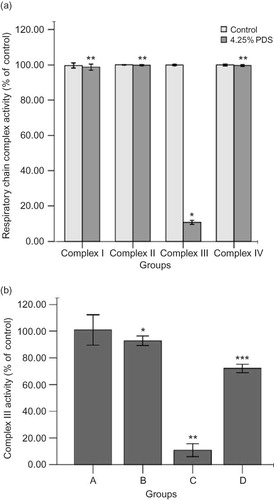
High-glucose treatment did not alter the activities of the complexes I, II, or IV (p > 0.05) (). Complex III activity was decreased to 10.8% in high-glucose PDS-injured HPMC of control (p < 0.001) (). In contrast, the addition of glutathione reversed the inhibition of complex III to 72.1% of control (p < 0.05). Mannitol, as osmolality control, had similar effect as the control at the same osmolality (data not shown).
Figure 4. Effects of high-glucose PDS and glutathione on mitochondrial respiratory chain complexes' activities of HPMCs. (a) Mitochondrial respiratory chain complexes' activities were measured after being treated with 4.25% glucose PDS or DMEM for 24 h. High-glucose PDS suppressed the activity of complex III and had no effects on complexes I, II, and IV. Values are expressed as percentage mean ± SEM (n = 6) of respective controls (set to 100%).*p < 0.001 versus control; **p > 0.05 versus control. (b) Mitochondrial respiratory chain complex III activity was measured in HPMCs after exposure to four different culture media for 24 h. Complex III activity was decreased in high-glucose PDS-injured HPMC. Glutathione could reverse this change. Values are expressed as percentage mean ± SEM (n = 6) of the respective controls (set to 100%).*p < 0.05 versus control; **p < 0.001 versus 1.5% PDS group; ***p < 0.05 versus 4.25% PDS group. A, Control: DMEM; B, 1.5% glucose PDS; C, 4.25% glucose PDS; and D, glutathione + 4.25% PDS.
DISCUSSION
Progressive UFF is one of the major complications of long-term PD.Citation1 The most frequent reason for UFF is the development of increasing hyperpermeability of the peritoneal membrane.Citation13,Citation14 Our previous study have shown that high-glucose PDS could significantly decrease the TER of HPMCs.Citation4 In this study, claudin-1, as an important protein in maintaining permeability barrier between adjacent cells, also decreased after exposure to high-glucose-based PDS, indicating high-glucose PDS could cause damage to the structure and function of HPMCs monolayer. However, the mechanism is unknown.
Recent evidences have shown that high-glucose-based PDS triggers the generation of ROS in HPMCs, resulting in the tissue injury and dysfunction.Citation15 Mitochondrion is a primary organelle for the production of ROS.Citation16 Most of ROS are originated from the mitochondrial respiratory chain, especially complex III. Mitochondrion is also one of the primary targets of ROS attack. Our results showed that HPMC monolayer barrier was injured as reflected by decreasing TER value and claudin-1 expression induced by high-glucose-based PDS. This was accompanied by increasing production of mitochondrial ROS and decreasing activity of complex III in mitochondria. Glutathione can reverse these damages. These suggested that high-glucose PDS could inhibit the activity of complex III in mitochondria. Following complex III damage, further ROS production will be enhanced in a vicious cycle, resulting in the structural and functional damages of peritoneum injury. Inhibited activity of complex III and consequent mitochondrial ROS accumulation might be one of the important mechanisms for the high-glucose PDS-induced hyperpermeability of peritoneum.
Glutathione is an important antioxidant in mitochondria and together with its related enzymes comprises a system that acts as primary defense against excessive generation of ROS.Citation17 It has been reported previously that patients undergoing dialysis have low levels of blood glutathione; the administration of glutathione precursor could increase the level of blood glutathione and improve antioxidant status.Citation18,Citation19 And in this study, we have proved that glutathione, as an antioxidant, can obviously reverse the decrease of TER value and expression of claudin-1 caused by high-glucose PDS. Our study has also shown that glutathione could increase the activity of respiratory complex III and decrease the accumulation of mitochondrial ROS induced by high-glucose PDS. These results have indicated that glutathione could prevent oxidative damages of peritoneal barrier by protecting the activity of respiratory complex III, which might reveal a novel therapy to fight damages of peritoneal barrier in the high-glucose PDS treatment.
In conclusion, our study shows that mitochondrial respiratory complex III pathway plays an important role in maintaining permeability of HPMCs. Glutathione could protect peritoneum by preventing respiratory complex III from oxidative injury, which might be a valuable target for novel therapies to fight hyperpermeability of peritoneum during the prolonged PD treatment.
Acknowledgments
This study is supported by the grants from Chinese National Natural Science Foundation (NSFC) (No.30871169/C140405), the Key Clinical Project of the Ministry of Health and the NIH (DK28492 & DK60635).
Declaration of interest: The authors report no conflicts of interest. The authors alone are responsible for the content and writing of this paper.
REFERENCES
- Brimble KS, Walker M, Margetts PJ, Kundhal KK, Rabbat CG. Meta-analysis: Peritoneal membrane transport, mortality, and technique failure in peritoneal dialysis. J Am Soc Nephrol. 2006;17:2591–2598.
- Hughes R, Kurth MJ, McGilligan V, McGlynn H, Rowland I. Effect of colonic bacterial metabolites on Caco-2 cell paracellular permeability in vitro. Nutr Cancer. 2008;60:259–266.
- Li FK, To CH, Leung JK, Chan TM, Lai KN. Electrophysiology and glucose transport of human peritoneal mesothelial cells: Implications for peritoneal dialysis. Perit Dial Int. 2001; 21:115–121.
- Ling G, Zhu X, Xia Y, Effect of glucose peritoneal dialysates on the transmesothelial electrical resistance and cellular migration of monolayer human peritoneal mesothelial cell. Zhong Nan Da Xue Xue Bao Yi Xue Ban. 2009;34: 418–424.
- Tsukita S, Furuse M, Itoh M. Multifunctional strands in tight junctions. Nat Rev Mol Cell Biol. 2001;2:285–293.
- Schneeberger EE, Lynch RD. The tight junction: a multifunctional complex. Am J Physiol Cell Physiol. 2004;286: C1213–C1228.
- Gotloib L, Wajsbrot V, Cuperman Y, Shostak A. Acute oxidative stress induces peritoneal hyperpermeability, mesothelial loss, and fibrosis. J Lab Clin Med. 2004;143:31–40.
- Noh H, Kim JS, Han KH, Oxidative stress during peritoneal dialysis: implications in functional and structural changes in the membrane. Kidney Int. 2006;69:2022–2028.
- Turrens JF. Mitochondrial formation of reactive oxygen species. J Physiol. 2003;552:335–344.
- Rougier JP, Moullier P, Piedagnel R, Ronco PM. Hyperosmolality suppresses but TGF beta 1 increases MMP9 in human peritoneal mesothelial cells. Kidney Int. 1997;51:337–347.
- Jarreta D, Orus J, Barrientos A, Mitochondrial function in heart muscle from patients with idiopathic dilated cardiomyopathy. Cardiovasc Res. 2000;45:860–865.
- Kwong LK, Sohal RS. Age-related changes in activities of mitochondrial electron transport complexes in various tissues of the mouse. Arch Biochem Biophys. 2000;373:16–22.
- Fussholler A, zur Nieden S, Grabensee B, Plum J. Peritoneal fluid and solute transport: Influence of treatment time, peritoneal dialysis modality, and peritonitis incidence. J Am Soc Nephrol. 2002;13:1055–1060.
- Davies SJ. Longitudinal relationship between solute transport and ultrafiltration capacity in peritoneal dialysis patients. Kidney Int. 2004;66:2437–2445.
- Lee HB, Yu MR, Song JS, Ha H. Reactive oxygen species amplify protein kinase C signaling in high glucose-induced fibronectin expression by human peritoneal mesothelial cells. Kidney Int. 2004;65:1170–1179.
- Ishibashi Y, Sugimoto T, Ichikawa Y, Glucose dialysate induces mitochondrial DNA damage in peritoneal mesothelial cells. Perit Dial Int. 2002;22:11–21.
- Suman S, Seth RK, Chandna S. Mitochondrial antioxidant defence in radio-resistant Lepidopteran insect cells. Bioinformation. 2009;4:19–23.
- Ahmadpoor P, Eftekhar E, Nourooz-Zadeh J, Glutathione, glutathione-related enzymes, and total antioxidant capacity in patients on maintenance dialysis. Iran J Kidney Dis. 2009;3:22–27.
- Styszynski A, Wieczorowska-Tobis K, Podkowka R, Breborowicz A, Oreopoulos DG. Effects of glutathione supplementation during peritoneal dialysis. Adv Perit Dial. 2006;22:88–93.