Abstract
Background: To investigate the renal microvascular injury in acute aristolochic acid nephropathy (AAN) and the protective effects of prostaglandin E1 (PGE1) in acute AAN. Methods: Female Sprague–Dawley rats were randomly divided into three groups. The rats in PGE1 group received Caulis Aristolochia manshuriensis (CAM) decoction by gavage for 5 days, and PGE1 was given by vena caudalis before gavage. The rats in model group were gavaged with CAM for 5 days, and the same dose of 0.9% physiologic saline was given by vena caudalis. The rats in control group only received an equal daily volume of saline solution by gavage. Animals were killed at days 3, 5, and 7. Blood urea nitrogen (BUN), serum creatinine, and urinary protein were monitored before killing. Microvascular density was determined by JG12 immunostaining. The expression of angiogenic factor was assessed by vascular endothelial growth factor (VEGF). Tubulointerstitial hypoxia was assessed by hypoxia-inducible factor-1α (HIF-1α) expression. Results: CAM induced a significant decrease in VEGF expression and microvascular density in the kidney tissue, accompanied by a significant increase in HIF-1α, which reduced renal function and increased 24-h urinary protein excretion rates. PGE1 lessened the capillary loss, relieved hypoxia, and protected renal function. No significant pathological changes were found in control rats. Conclusion: The renal microvascular injury in acute AAN is severe. PGE1 can significantly ameliorate the renal microvascular injury, relieve hypoxia, and protect renal function.
INTRODUCTION
Aristolochic acid (AA) nephropathy (AAN) is a rapidly progressive interstitial nephritis leading to end-stage renal disease and urothelial malignancy.Citation1 This disease was first reported in Belgium in women who had followed a slimming regimen including Chinese herbs, Aristolochia fangchi.Citation2 It is characterized by early, severe anemia, mild tubular proteinuria, and initially normal arterial blood pressure in half of the patients.Citation3 The pathology of AAN includes extensive hypocellular interstitial fibrosis with atrophy and loss of renal tubules.Citation4 Although botanicals known or suspected to contain AA were no longer permitted in many countries, several AAN cases were regularly observed all around the world. However, the pathogenic mechanisms of AAN remain unclear and therapies are limited.
A growing body of evidence supported that the vascular component was involved in the pathogenesis of AAN. Some studies have suggested that the primary lesions of AAN are located in the vessel walls.Citation5,Citation6 Abnormal ultrastructure of endothelial cells within the microvasculature was observed in renal biopsy samples of AAN patients,Citation7 and peritubular capillary (PTC) loss was also seen in both clinical practice and animal models of AAN.Citation7,Citation8 Prostaglandin E1 (PGE1) has multiple effects on the microcirculatory level.Citation9 In the kidney, PGE1 plays a role in keeping the blood-flow and intrarenal distribution of blood stable. PGE1 can inhibit effector T-cell induction and tissue damage in experimental murine interstitial nephritis.Citation10 We have observed that PGE1 slows the progression of renal failure in AAN patients,Citation11 but its protective mechanisms were not clearly clarified.
It was already confirmed that Caulis Aristolochia manshuriensis (CAM, Chinese: Mu-Tong) decoction could cause tubulointerstitial injury in an AAN model.Citation8 In this study, we investigated the role of microvascular injury in the pathogenesis of acute AAN and evaluate the potential therapeutic effect of PGE1 on AA-induced renal injury.
MATERIALS AND METHODS
Preparation of the CAM solution
CAM was purchased from Liaoning Academy of Chinese Traditional Sciences (Liaoning, China). CAM decoction was prepared as followingCitation8: 1000 g of crude CAM was sliced into a container, 5000 mL of water was added, and the solution was marinated for half an hour and then heated to boiling point on a fast fire (at 250 V and 2000 W) and on a slow fire (at 250 V and 2000 W) each for half an hour, and the decoction was poured into another container. Afterward, the remaining amount was added in 5000 mL of water and decocted for 1 h on a slow fire. The CAM solution was finally made at a concentration of 2 g medicine per milliliter solution, which was demonstrated to contain 0.58 mg/mL aristolochic acid I (AAI) by a reversed-phase high-performance liquid chromatography (RP-HPLC) method. The CAM solution was stored at 4°C.
Experimental Protocol
All animal procedures were conducted after approval of the protocol by the Xuzhou Medical College Animal Centre Committee. Female Sprague–Dawley rats (200–240 g, age = 8–9 weeks) were kept under standard conditions with unrestricted access to food and water in a 12 : 12 h light–dark cycle. Seventy-two rats were randomized into three groups: PGE1 group (CAM + PGE1, n = 24), model group (CAM + saline solution, n = 24), and control group (saline solution, n = 24). The PGE1 group was administered with CAM decoction by gavage at a dose of 60 g kg–1 d–1 (twice a day) for 5 days and was also administered with alprostadil injection (Qianliedi'er Zhusheye, Beijing Tidepharm Ltd., Beijing, PR China) through vena caudalis at a dose of 4 µg kg–1 d–1 (about 20 times of human, once daily) before CAM decoction administration for 7 days. The model group received the same dose of CAM decoction as the PGE1 group, but the same dose of saline solution was injected instead of alprostadil. The control group only received an equal daily volume of saline solution by gavage.
Eight animals were killed at days 3, 5, and 7 in each group. Urine was collected for 24 h in metabolic cages before death. At death, sample of serum was collected. The kidneys were rapidly removed and transferred to a metal plate cooled on ice for sectioning. One kidney was divided into two parts and snap frozen in liquid nitrogen and stored at –70°C. The other kidney was dissected into two parts. One part was fixed in 4% formaldehyde for pathological examination and immunohistochemical detection, and the other part was fixed in 2.5% glutaraldehyde for electron microscope detection. Twenty-four-hour urinary protein excretion rates were measured using the sulfosalicylic acid method, and blood urea nitrogen (BUN) and serum creatinine (Scr) levels were determined with a Keysys analyser (Boehringer Mannheim, Germany).
Histology and Immunohistochemical Staining
Formalin-fixed and paraffin-embedded tissue sections from the kidneys were cut into 4-µm thickness, which were stained with hematoxylin–eosin. For electron microscopy, glutaraldehyde-fixed tissues were postfixed with 1% osmium tetroxide, dehydrated, and embedded in Epon 812 (Okenshoji, Tokyo, Japan). Ultrathin sections were stained with uranyl acetate and lead citrate and were then examined with a Hitachi H7100 electron microscope (Hitachi, Yokohama, Japan). Mouse anti-vascular endothelial growth factor (VEGF) monoclonal antibody (1 : 100, Santa Cruz Biotechnology, Santa Cruz, CA, USA), mouse anti-JG12 (raised against aminopeptidase P of capillary endothelial cells) monoclonal antibody (1 : 100, Santa Cruz), and mouse anti-hypoxia-inducible factor-1α (HIF-1α) monoclonal antibody (1 : 50, Santa Cruz) were used for immunohistochemical procedures. All the latter (VEGF, JG12 and HIF-1α) were performed using an SABC Kit (Zhongshan, Zhongshan City, China) according to manufacturer's instructions. Negative controls comprised omission primary antibodies. Hematoxylin was used for counterstaining procedures. For quantification of VEGF and HIF-1α expression, 10 discontinuous visual fields of outer cortex were randomly selected in the section. Positive proteins were quantitatively analyzed by means of Image 6 Pro Plus system (Media Cybernetics, Bethesda, MD, USA).Citation8 Integrated optical density (IOD) represented the total quantity of VEGF and HIF-1α.
Quantification of Endothelial Density
Changes in endothelial density and morphology were evaluated by immunostaining with JG12 as previously reported.Citation12 In brief, the number of glomerular capillary loops per glomerular cross section was counted in all glomeruli in the tissue section at ×400 magnification. Glomerular capillary density was defined as the number of capillaries per glomerular cross-sectional area (0.065 mm2), the latter determined by computer image analysis. The PTCs' density was quantitated by counting the total number of PTCs within the confines of each of 10 random 0.065 mm2 fields (each of these fields was viewed at ×400 magnification) and was expressed as the average number per field.
Western Blotting Assay
Renal tissues lysed in RIPA (Cell lysis buffer; Bytotime, Haimen City, China) on ice were centrifuged at 11100 × g for 10 min at 4°C. Protein samples (100 µg protein/Lane) were electrophoresed through a 7% polyacrylamide gel and then transferred to nitrocellulose membranes (Amersham SA, Les Ulis, France). The membranes were blocked in 5% skim milk powder for 1 h and then incubated overnight at 4°C with primary polyclonal mouse anti-HIF-1α antibody (1 : 100). Proteins were visualized using an alkaline phosphatase-conjugated second antibody (Zhongshan, Zhongshan City, China) and a BCIP/NBT Alkaline Phosphatase Color Development Kit (Beyotime, China). Positive immunoreactive bands were scanned, analyzed, quantified densitometrically, and normalized by β-actin.
Statistics
The results are reported as mean ± SD, and statistical analyses were performed with Stata 7.0. Comparisons between groups were analyzed through ANOVA. A p-value of less than 0.05 was considered significant.
RESULTS
Functional and Pathological Effects of Acute AAN in Rats
As shown in , a significant increase in Scr level was observed for the acute AAN rats from the third day and a marked increase in BUN level was observed for the acute AAN rats from the fifth day, compared with the control group, respectively (p < 0.05). After PGE1 injection, the BUN and Scr levels were significantly reduced in the PGE1 group compared with the model group. Urea protein was significantly increased in the acute AAN rats after 3 days and then exhibited a continuous increase up to day 7 (). In the PGE1 group, urea protein was significantly reduced at each time-point (p < 0.05).
Table 1. Time course of renal function and urine protein in rats at each group
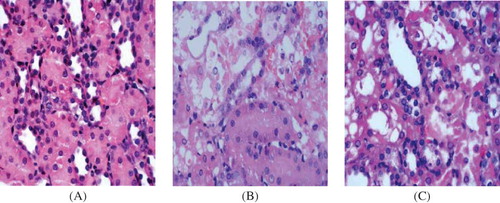
At the light microscope level, no significant abnormality was observed in the renal tissue samples obtained at days 3, 5, and 7 () in the control group. In contrast, there were remarkable lesions in kidney, especially in the region of the corticomedullary border in the model group. At day 7 (), severe interstitial edema, massive tubular atrophy, and necrosis were found, and part of the tubular basement membranes was naked. In the PGE1 group (), renal lesions were mild. Only local desquamation of tubular epithelial cells and protein casts were observed after PGE1 injection.
Figure 1. Hematoxylin–eosin staining in tissue samples. (×400). (A) Control group at day 7. There was no significant histological abnormality in the control group. (B) Model group at day 7. Severe epithelial degeneration, necrosis, and collapse were observed in most of the renal tubular epithelial cells, and some renal tubular epithelial cells had only the residual basement membrane. (C) PGE1 group at day 7. Only local tubular epithelial shedding and protein casts were observed, and mild glomerular lesions and proliferation of mesangial matrix were observed.
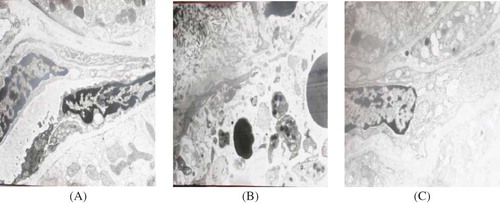
At the electron microscopy level, there was no significant abnormality in the renal tissue samples in the control group at days 3, 5, and 7(). At day 7 in the model group (), electron microscopy revealed severe PTC endothelial cell membrane lesion, focal separation of endothelial cells from the basement, and tubular basement membrane disruption. On the contrary, renal lesions were ameliorated in the PGE1 group (). In PTC endothelial cells, cytoplasmic swelling was seen, but no rupture of endothelial cells was observed after PGE1 therapy.
Figure 2. Electron microscopy in tissue samples (×10,000). (A) Control group at day 7. The ultrastructure of PTC endothelial cells was normal. (B) Model group at day 7. PTC endothelial cell membrane was partially damaged, and the partial separation of endothelial cells from the glomerular basement membrane was observed. (C) PGE1 group at day 7. PTC endothelial cells cytoplasmic swelling was seen, but no rupture of endothelial cells was observed.
Changes in the Renal Microvessel
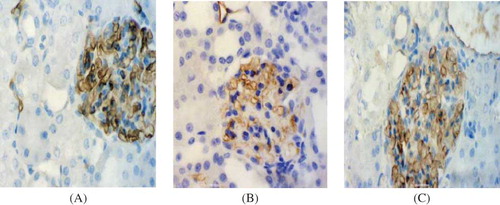
Renal microvessels were easily and accurately identified in the control group because immunostaining for JG12 clearly delineated their endothelial lining. The PTCs of the control group were patent, displayed uniform size and shape, and were regularly arranged in most of the interstitium (). Compared with the control group, the density of PTCs at days 3, 5, and 7 was significantly reduced in the model group (, ) (p < 0.05). There was no significant difference in the PTCs' density between the model group and the PGE1 group at day 3 after PGE1 therapy; however, the PTCs density of the PGE1 group was significantly increased at days 5 and 7 (p < 0.05) (, ). There was a significant reduction in the density of glomerular at day 7 in both model and PGE1 groups, whereas the capillary density was markedly higher in the PGE1 group than in the model group (p < 0.05) (, ). The results showed that PGE1 therapy alleviated renal microvessel injury in acute AAN in rats.
Figure 3. PTC staining in tissue samples. (×400). (A) Control group at day 7. The PTC of control group kidneys displayed uniform size and shape, and were regularly arranged in most of the interstitium. (B) Model group at day 7. The staining of PTC was obviously decreased. (C) PGE1 group at day 7. The positive staining was slightly decreased.
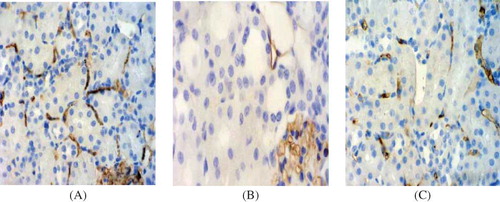
Table 2. Time course of immunohistochemical analysis in rats
Figure 4. Glomerular capillary staining in tissue samples. (×400). (A) Control group at day 7. The glomerular capillary of control group kidneys was prominent. (B) Model group at day 7. The staining of glomerular capillary was markedly decreased. (C) PGE1 group at day 7. The positive staining was slightly decreased.
Immunostaining and Western Blotting for HIF-lα
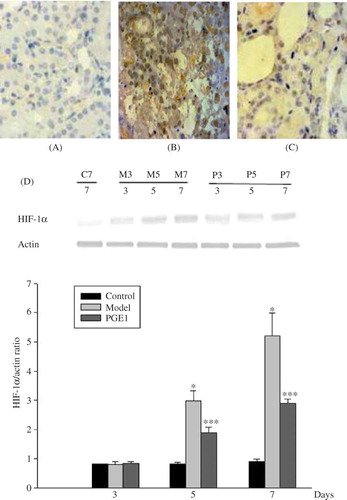
In the control group (), faint staining could be seen in cortical nuclei, predominantly in distal tubules. No nuclear staining was seen in the medulla or papilla. There were no significant differences in the expression of HIF-1α among three groups at day 3. In the model group, the HIF-1α levels were increased in tubular epithelial cells at day 3, and further increased at days 5 and 7 () than in the control group and in the PGE1 group (p < 0.05) (). After PGE1 therapy, at days 5 and 7, HIF-1α staining was apparently generally decreased in tubules, especially in areas of atrophy and necrosis () than in the model group (p < 0.05) (). The protein expression of HIF-1α by western blotting showed similar variation trends with the results of the immunohistochemistry. It was shown that PGE1 treatment remarkably reduced HIF-1α expression in the PGE1 group ().
Figure 5. HIF-1α staining in tissue samples. (×400). (A) Control group at day 7. Weak HIF-1α nuclear staining was seen in the control kidney. (B) Model group at day 7. The HIF-1α expression was obviously increased. (C) PGE1 group at day 7. The HIF-1α staining was slightly increased. (D) Western blotting of HIF-1α protein expression. HIF-1α protein level was significantly reduced from day 5, which was in accord with the results of the immunohistochemistry. C7 is the normal control group at 7 days. M3, M5, and M7 are the model group at days 3, 5, and 7, respectively. P3, P5, and P7 are the PGE1 group at days 3, 5, and 7, respectively.
Values are means ± SD. *and ** denote p < 0.05 versus the control group and p < 0.05 versus the model group, respectively.
Immunostaining for VEGF
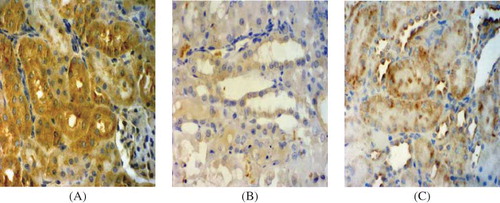
Extensive tubular staining for VEGF was seen in the control group () with accentuation of distal tubules. However, the VEGF staining was gradually reduced, particularly in areas of tubular damage or atrophy and the reduction was significantly more prominent in the model group than in the PGE1 group ( and C). There was an obvious reduction in VEGF levels in both model and PGE1 groups at days 3, 5, and 7 compared with that in the control group, but the VEGF protein expression in the PGE1 group was obviously enhanced in rats of the PGE1 group compared with rats in the model group at days 5 and 7 (). These data clearly indicated that the expression of VEGF protein was markedly increased in the PGE1 group after PGE1 injection.
Figure 6. VEGF staining in tissue samples. (×400). (A) Control group at day 7. VEGF staining was most prominent in tubular epithelial cells in the control group. (B) Model group at day 7. The VEGF staining was significantly reduced. (C) PGE1 group at day 7. The VEGF staining was slightly decreased.
DISCUSSION
AAN is a progressive tubulointerstitial renal disease caused by AA intoxication. However, its pathogenesis has not yet been clearly elucidated, and little information is available in the literature about effective therapy to slow its progression.Citation13,Citation14 There have been many hypothesizes about the pathogenesis of acute AAN. Some researchers found that there was blood vessel injury in AAN,Citation4,Citation7,Citation8,Citation15 and they thought it could be one of the causes for the continuously progressing tubulointerstitial damage. PGE1 is a natural prostaglandin with numerous pharmacologic effects including the well-known vasodilating effect. Due to severe renal vascular lesions of AAN, we chose PGE1 to treat rats with acute AAN and to explore its mechanism.
We evaluated the amount of microvessel (PTCs and glomerular vessels) and structure of PTCs by JG12 immunostaining. In the control group, it showed no changes in the number of capillaries per tubule or vascular rarefaction. However, our research revealed gradually aggravated microvessel injury in a time-dependent manner in the model group. Most of PTCs in acute AAN rats were distorted and collapsed. Microvessel density was progressively reduced in acute AAN models. PTC injury is related to a decreased blood supply to renal tubules.Citation16 These data indicated that there was renal microvessel injury in acute AAN rats. After PGE1 therapy, microvessel density was significantly increased in acute AAN rats in this study. PGE1 alleviated the renal microvessel injury.
HIF-1α is a sensitive hypoxia indicator because it is stabilized in a low-oxygen cellular milieu.Citation17 As the master hypoxia response regulator, the amount of HIF-1α is determined by oxygen-dependent degradation.Citation18 To observe the development of hypoxia, we investigated expression levels of HIF-1α in renal tissues. The principal advantage of a HIF-1α-based method of hypoxia detection is that it gives direct evidence of transcriptionally relevant hypoxia at a cellular level.Citation19 The expression of HIF-1α in the control group was relatively low, but its expression gradually increased in the model group. In the PGE1 group, the level of HIF-1α was significantly decreased than that in the model group. Hypoxia was ameliorated after PGE1 injection.
VEGF is an endothelial-specific growth factor that promotes endothelial cell proliferation and differentiation, increases vascular permeability, and supports vascular survival by preventing endothelial apoptosis.Citation20,Citation21 In this study, we observed a gradual reduction of VEGF as the disease progressed in the model group. PGE1 therapy increased the protein levels of VEGF in the PGE1 group.
Shown to be a downstream target of HIF-1α in in vitro studies, VEGF expression should be increased after HIF-1α induction and nuclear translocation.Citation22 However, we observed a reduction in VEGF expression in acute AAN rats at days 5 and 7, despite an increased expression of HIF-1α. There are several explanations for this disparity. One possible explanation for this finding could be that HIF-1α is not the only known transcriptional activator of VEGF, with experimental evidence suggesting a role for SP-1 as well as the oncogene ras.Citation23,Citation24 VEGF transcription is also inhibited by the anti-oncogenes p53 and p73. Another explanation could be that in contrast to cell culture experiments, renal VEGF gene expression in vivo is not sensitive to tissue hypoxia.Citation25,Citation26 Moreover, recent in vitro data have shown that increased glucose levels blunt hypoxia-induced VEGF expression through oxidative stress-regulated HIF-1α expression.Citation27 It is therefore likely that the findings of reduced VEGF in acute AAN model are multifactorial in origin.
From the morphologic and renal function observation, from day 3 onward, we found that renal injury in the model group was gradually aggravated, and renal function was gradually deteriorated. On the contrary, after PGE1 therapy, both renal injury and renal function were all ameliorated.
PGE1 has been used to treat ischemic liver damage,Citation28 ischemic colitis,Citation29 and cerebral ischemia.Citation30 However, there were little reports on acute AAN treatment with PGE1. The mechanisms of PGE1 for increasing capillary density and ameliorating renal function have not been fully elucidated. PGE1 plays a role in keeping the blood-flow and intrarenal distribution of blood in the kidney. Our study observed that PGE1 increased VEGF (angiogenesis factor) expression and microvascular density and reduced the protein levels HIF1-α.
In conclusion, following significant reductions in microvascular density and VEGF expression, HIF1-α expression increased markedly in acute AAN rats, which contributed to the progressive renal injury. Microvascular injury, with consequent tissue hypoxia and ischemia, may play an important role in the progression of acute AAN. After PGE1 therapy, the microvascular density was increased, hypoxia was alleviated, and renal function was consequently ameliorated. It seemed that the PGE1 treatment may represent a new and promising strategy for clinical application designed to block progressive renal injury in patients of acute AAN.
Acknowledgments
This work was supported by the Fund of the Educational Science Foundation of Jiangsu Province, China (No. 07KJB320121), the Project of the Science Foundation of Affiliated Hospital of Xuzhou Medical College, Qinglan Lan project (53051106), and Special talents Fund of Dean of Xuzhou Medical College (2010KJZ23).
Declaration of interest: The authors report no conflicts of interest. The authors alone are responsible for the content and writing of the paper.
REFERENCES
- Debelle FD, Vanherweghem JL, Nortier JL. Aristolochic acid nephropathy: A worldwide problem. Kidney Int. 2008;74(2): 158–169.
- Vanherweghem JL, Depierreux M, Tielemans C, Rapidly progressive interstitial fibrosis in young women: Association with slimming regimen including Chinese herbs. Lancet. 1993; 341:387–391.
- Reginster F, Jadoul M, van Ypersele de Strihou C. Chinese herbs nephropathy presentation, natural history, and fate after transplantation. Nephrol Dial Transplant. 1997;12:81–86.
- Depierreux M, Van Damme B, Vanden Houte K, Vanherweghem JL. Pathologic aspects of a newly described nephropathy related to the prolonged use of Chinese herbs. Am J Kidney Dis. 1994;24:172–180.
- Cosyns JP, Dehoux JP, Guiot Y, Chronic aristolochic acid toxicity in rabbits: A model of Chinese herbs nephropathy? Kidney Int. 2001;59:2164–2173.
- Yang CS, Lin CH, Chang SH, Hsu HC. Rapidly progressive fibrosing interstitial nephritis associated with Chinese herbal drugs. Am J Kidney Dis. 2000;35:313–318.
- Yang L, Li X, Wang H. Possible mechanisms explaining the tendency towards interstitial fibrosis in aristolochic acid-induced acute tubular necrosis. Nephrol Dial Transplant. 2007; 22:445–456.
- Sun D, Feng J, Dai C, Role of peritubular capillary loss and hypoxia in progressive tubulointerstitial fibrosis in a rat model of aristolochic acid nephropathy. Am J Nephrol. 2006; 26:363–371.
- Weiss T, Eckstein H, Weiss C, Diehm C. Neutrophil function in peripheral arterial occlusive disease: The effects of prostaglandin E1. Vasc Med. 1998;3:171–175.
- Kelly CJ, Zurier RB, Krakauer KA, Blanchard N, Neilson EG. Prostaglandin E1 inhibits effector T cell induction and tissue damage in experimental murine interstitial nephritis. J Clin Invest. 1987;79(3):782–789.
- Sun D, Feng JM, Zhao YL, Jin T, Wang LN. Effects of prostaglandin E1 on the progression of aristolochic acid nephropathy. Chin Med Sci J. 2005;20:67–69.
- Kang DH, Joly AH, Oh SW, Impaired angiogenesis in the remnant kidney model (I): Potential role of vascular endothelial growth factor and thrombospondin-1. J Am Soc Nephrol. 2001;12:1434–1447.
- Debelle FD, Nortier JL, Husson CP, The renin-angiotensin system blockade does not prevent renal interstitial fibrosis induced by aristolochic acids. Kidney Int. 2004;66: 1815–1825.
- Vanherweghem JL, Abramowicz D, Tielemans C, Depierreux M. Effects of steroids on the progression of renal failure in chronic interstitial renal fibrosis: A pilot study in Chinese herbs nephropathy. Am J Kidney Dis. 1996;27: 209–215.
- Yang L, Li XM, Wang SX, Wang HY. Peritubular capillary injury in Chinese herb guan-mu-tong-induced acute tubular necrosis. Chin J Intern Med. 2005;44:525–529.
- Choi YJ, Chakraborty S, Nguyen V, Peritubular capillary loss is associated with chronic tubulointerstitial injury in human kidney: Altered expression of vascular enthelial growth factor. Hum Pathol. 2000;31(12):1491–1497.
- Stravodimos KG, Koritsiadis G, Lazaris AC. Hydronephrosis promotes expression of hypoxia-inducible factor 1α. Urol Int. 2009;82:38–42.
- Safran M, Kaelin WG Jr. HIF hydroxylation and the mammalian oxygen-sensing pathway. J Clin Invest. 2003;111(6):779–783.
- Kairaitis LK, Wang Y, Gassmann M, Tay YC, Harris DC. HIF-1alpha expression follows micro vascular loss in advanced murine Adriamycin nephrosis. Am J Physiol Renal Physiol. 2005;288(1):F198–F206.
- Ferrara N, Gerber HP. The role of vascular endothelial growth factor in angiogenesis. Acta Hematol. 2001;106:148–156.
- Neufeld G, Cohen T, Gengrinovitch S, Poltorak Z. Vascular endothelial growth factor (VEGF) and its receptors. FASEB J. 1999;13:9–22.
- Nakamura M, Yamabe H, Osawa H, Hypoxic conditions stimulate the production of angiogenin and vascular endothelial growth factor by human renal proximal tubular epithelial cells in culture. Nephrol Dial Transplant. 2006;21:1489–1495.
- Akiyama H, Tanaka T, Maeno, T, Induction of VEGF gene expression by retinoic acid through SP1-binding sites in retinoblastoma Y79 cells. Invest Ophthalmol Vis Sci. 2002; 43(5):1367–1374.
- Okada F, Rak JW, Croix BS, Impact of oncogenes in tumor angiogenesis: Mutant K-rats up-regulation of vascular endothelial growth factor/vascular permeability factor is necessary, but not sufficient for tumorigenicity of human colorectal carcinoma cells. Proc Natl Acad Sci USA. 1998,95:3609–3614.
- Kramer BK, Bucher M, Sandner P, Effects of hypoxia on growth factor expression in the rat kidney in vivo. Kidney Int. 1997;51:444–447.
- Sandner P, Wolf K, Bergmaier U, Gess B, Kurtz A. Induction of VEGF and VEGF receptor gene expression by hypoxia: Divergent regulation in vivo and in vitro. Kidney Int. 1997;51:448–453.
- Katavetin P, Miyata T, Inagi R, High glucose blunts vascular endothelial growth factor response to hypoxia via the oxidative stress-regulated hypoxia-inducible factor/hypoxia-responsible element pathway. J Am Soc Nephrol. 2006;17: 1405–1413.
- Nabeshima M, Moriyasu F, Nishikawa K, Evaluation of protective effects of prostaglandin E1 on ischemic liver damage with in vivo 31P-MR spectroscopy. Magn Reson Med. 1995;34(3):457–461.
- Nakai M, Uchida H, Hanaoka T, Sugiyama S, Sano S, Shimizu N. Beneficial effects of prostaglandin E1 on ischemic colitis following surgery on the abdominal aorta. Surg Today. 1998;28(11):1146–1153.
- Han R, Gao B, Sheng R, Synergistic effects of prostaglandin E1 and lithium in a rat model of cerebral ischemia. Acta Pharmacol Sin. 2008;29(10):1141–1149.