Abstract
This study aimed to examine whether hepatocyte growth factor (HGF) can improve renal function in 5/6 nephrectomized rats and investigate whether this function is associated with a decrease in α-smooth muscle actin (α-SMA) expression in rat glomerulus mesangial cells and renal interstitium. Rats were randomly divided into the following groups: control, PCI-neo, sham-operation, 5/6 nephrectomy, and low-dose and high-dose PCI-neo-HGF. Rats were killed in the ninth week after 5/6 nephrectomy, and the kidney specimens were subjected to pathological examination by Hematoxylin–Eosin staining and detection of α-SMA expression by reverse transcriptase-polymerase chain reaction (RT-PCR), Western blot, and immunohistochemistry. The results showed that blood urea nitrogen and serum creatinine levels were increased, renal interstitium was injured, and α-SMA expression was elevated in 5/6 nephrectomized rats compared with that in control. The above changes were ameliorated in the rats injected with PCI-neo-HGF vector. At the molecular level we found that PCI-neo-HGF repressed α-SMA expression in mesangial cells stimulated by lipopolysaccharide. In conclusion, our data suggest that HGF can relieve chronic renal failure, and this protection is associated with the down-regulation of α-SMA expression in mesangial cells and renal interstitium.
INTRODUCTION
Chronic renal failure is a major disease that seriously endangers human health. Its pathological process is chronic and progressive, and results in glomerular sclerosis, tubular analosis, and renal interstitial fibrosis later in the disease process. A variety of mechanisms are responsible for the pathogenesis of chronic renal failure, such as excessive deposition of extracellular matrix, participation of some cytokines, restraining apoptosis, and tubular epithelial-myofibroblast transdifferentiation, in which tubular epithelial cells are activated and differentiated into myofibroblasts.Citation1–3 Alpha-smooth muscle actin (α-SMA) is a characteristic protein expressed in smooth muscle cells and myofibroblasts, and high expression of α-SMA in kidney has been proposed as a marker of tubular epithelial-myofibroblast transdifferentiation.Citation4 Hepatocyte growth factor (HGF) is a pleiotropic cytokine, which has multiple biological functions, such as promoting karyomitosis, accelerating cell locomotion, and anti-apoptotic characteristics.Citation5,6 In addition, HGF has reno-protective effects in many animal models including acute renal failure, and so on.Citation7,8 HGF is considered to promote reno-protection by accelerating the degradation of extracellular matrix,Citation9,10 restricting tubular epithelial-myofibroblast transdifferentiation, and promoting hyperplasia of tubular epithelial cells.Citation11–13
Recent research suggests that HGF can repress the hyperplasia of glomerulus mesangial cells induced by transforming growth factor (TGF)-β1.Citation14 However, it is unknown as to whether HGF can repress the growth of mesangial cells under normal conditions. Furthermore, the relationship between HGF and α-SMA in normal and hyperplastic states of glomerulus mesangial cells is unknown.
Hyperplasia of glomerulus mesangial cells and excessive deposition of extracellular matrix are basic pathological changes that cause renal interstitial fibrosis, glomerular sclerosis, and chronic renal failure. A prior study indicated that lipopolysaccharide (LPS) improved hyperplasia of glomerulus mesangial cells and increased deposition of extracellular matrix.Citation15
The 5/6 nephrectomized rat model is commonly used to study chronic renal failure. After 5/6 nephrectomy, the number of nephrons is reduced, which causes high glomerular infusion, high pressure, and high filtration. This leads to tubular atrophy, glomerular sclerosis, and renal interstitial fibrosis, culminating in chronic renal failure.Citation16,17
The aim of this study was twofold. First, we investigated whether HGF could improve renal function and decrease urinary protein excretion (UPE). Second, we assessed whether the functions of HGF were associated with a decrease in α-SMA mRNA and protein expression. Due to the short half-life of HGF, injection will not provide stable blood concentrations.Citation18 To overcome this hurdle we utilized PCI-neo-HGF vectorCitation19 to achieve relatively stable expression of HGF in glomerulus mesangial cells and rat tissues.
MATERIALS AND METHODS
Cell Culture and Plasmid Transfection
Rat glomerulus mesangial cells were purchased from Peking North Weiye (an agency of American Science Company) and cultured in RPMI-1640 medium supplemented with 10% fetal bovine serum (FBS) as previously described.Citation20 PCI-neo-HGF for human and PCI-neo plasmids (gifts of Prof. NU Jun-qi, The First Hospital of Jilin University) were amplified and purified with the kit (V-gene, Biotechnology Limited Company, Hangzhou, China). A mixture of liposome (15 μL) and aquae sterilisata (85 μL) was incubated for 10 min at room temperature, then mixed with PCI-neo (2 μg) or different doses of PCI-neo-HGF (2 μg or 8 μg), and incubated for 10 min at room temperature before being transfected into mesangial cells. Glomerulus mesangial cells were collected 48 h or 72 h after transfection. Mesangial cells unstimulated by LPS were divided into four groups: Ctrl, control; PCI-n, cells + PCI-neo (2 μg); P-n-H2, cells + PCI-neo-HGF (2 μg); and P-n-H8, cells + PCI-neo-HGF (8 μg). Mesangial cells stimulated by LPS were also divided into four groups: C + L, cells + LPS (10 μg/mL); PCI-n, cells + LPS (10 μg/mL) + PCI-neo (2 μg); P-n-H2, cells + LPS (10 μg/mL) + PCI-neo-HGF (2 μg); and P-n-H8, cells + LPS (10 μg/mL) + PCI-neo-HGF (8 μg). Cells were treated with LPS for 12 h prior to transfection. Glomerulus mesangial cells were divided into two groups when we detected the relationship between expression of α-SMA after LPS-treatment and inhibition of TGF-β1: C + L, cells + LPS (10 μg/mL); C + L + i-T-β1, cells + LPS (10 μg/mL) + inhibition of TGF-β1 (8 μg).
Animals and Experimental Protocol
All animal experiments were conducted in accordance with The Guide for the Care and Use of Laboratory Animals at Jilin University. Clean male rats, weighing 210–250 g, were housed in a temperature-controlled room and were given free access to water and standard laboratory chow during the study period.
Plasmids and aluminum hydroxide gel were blended (ratio, 1:4) in advance. The animals were randomized into six groups: control (n = 6, Ctrl), PCI-neo (n = 6, PCI-n), sham-operation (n = 6, Sham), 5/6 nephrectomy (n = 6, Neph), low-dose PCI-neo-HGF (n = 6, Low), and high-dose PCI-neo-HGF (n = 6, High). Two surgeries were performed after the rats were anesthetized with 2% Nembutal by intraperitoneal injection. In the first surgery the upper pole and under pole (1/3 kidney, respectively) of the left kidney were cut off. On the seventh day after the first operation, a second surgery was done to remove the right kidney. These surgeries were done in the Neph, Low, and High group rats. The Sham operation was carried out similarly, except neither the kidney poles nor the right kidney was removed. PCI-neo-HGF was administrated to the Low group (230 μg/week) and the High group (460 μg/week) rats by intramuscular injection (inner muscles of right hind) on the second, third, and fourth week following the second surgery. The PCI-n group rats were treated with PCI-neo (300 μg/week) and the Ctrl, Sham, and Neph groups were treated with aluminum hydroxide gel (0.5 mL) using the same method and at the same time as the PCI-neo-HGF treatment.
Rats were killed on the ninth week after the second surgery. Urine was collected 24 h before killing, and blood was collected at the time of killing. A part of left kidney was preserved in liquid nitrogen and the rest was fixed in 10% formalin for subsequent experiments.
Reverse Transcriptase-Polymerase Chain Reaction
Total RNA was isolated from cells or renal tissues using RNA-STAT60 reagent according to the manufacturer’s instructions. cDNA was synthesized with 1 μg of RNA using murine leukemia virus reverse transcriptase and random hexamers. Reverse transcriptase-polymerase chain reaction (RT-PCR) was performed as described previously.Citation21 Polymerase chain reaction (PCR) products were separated using 1% agarose electrophoresis, and DNA band intensities were quantified using Quantitation One software (Bio-Rad Laboratories, Inc., Hercules, CA, USA). Target band densities were normalized to β-actin. The primers and parameters used for PCR are listed in .
Table 1. Primer sequences and PCR parameters.
Western Blot Analysis
Cells and isolated renal tissue samples were lysed in a sodium dodecyl sulfate (SDS) sample buffer containing 2% SDS, 10 mmol/L Tris-HCl, pH 6.8, and 10% (vol/vol) glycerol. The lysates were centrifuged at 12,000 × g for 15 min at 4°C, and the supernatant was stored at −70°C. Protein concentrations were determined using a BCA kit (Bio-Rad Laboratories). Fifty micrograms of protein were loaded per lane, separated in a 10% SDS-PAGE gel, and transferred to a nitrocellulose membrane and immunoblotted with α-SMA antibody (1:1000, Boster Biological Technology Co. Ltd., Wuhan, China). After washing, the membranes were incubated for 1 h with a horseradish peroxidase-linked anti-rabbit secondary antibody (1:2000, Boster Biological Technology Co. Ltd.) and immunoreactive proteins were detected using Supersignal chemiluminescence reagent (Pierce, Rockford, IL, USA). The blots were stripped and then reprobed with β-actin antibody (1:5000, Boster Biological Technology Co. Ltd.). The immunoblots were scanned using a densitometer, and protein bands were quantified with Quantitation One software (Bio-Rad Laboratories).
Histology (Hematoxylin–Eosin Staining) and Immunohistochemistry
The renal tissues were fixed in 10% formalin, embedded in paraffin, cut into 2 μm-thick slices, and stained with Hematoxylin–Eosin using standard methods. Ten independent renal tubulointerstitial regions, randomly selected from each specimen, were examined using light microscopy (×100). The area of renal tubular atrophy, interstitial inflammation, and interstitial fibrosis was graded as follows: 1 point, none; 2 points, injury area <25%; 3 points, injury area between 25% and 49%; and 4 points, injury area >50%. An experienced renal pathologist, who was blinded to the samples, performed the histological examination.
Renal tissues for immunohistochemical staining were fixed in 10% neutral buffered formalin and paraffin embedded using standard techniques. Five micron-thick sections were cut and mounted on glass slides. α-SMA and type-I collagen (Col-I) staining were performed using a commercial kit (Dako Corporation, Carpinteria, CA, USA) as previously described.Citation22 The sections were examined (two specimens per sample) using a Leica DMRE light microscope (×200) and graded according to the intensity of staining and total stained area: 0 point, none or low staining intensity; 1 point, stained areas <25% or low staining intensity; 2 points, stained area 25–49% or high staining intensity; 3 points, stained area 50–75% or even higher intensity of staining; and 4 points, stained areas >75% or the highest staining intensity. An experienced renal pathologist, who was blinded to the groups, graded the sections.
Sandwich ELISA Assay
Serum HGF protein from 5/6 nephrectomized rats was detected using sandwich enzyme-linked immunosorbent assay (ELISA) (Invitrogen, Carlsbad, CA, USA) following the manufacturer’s instruction. The value A260/280 was detected using spectrophotometer and a standard curve was made to calculate HGF content (ng L−1).
Statistical Analysis
Results were presented as the mean ± standard error (SE). Factor analysis of variance was used to assess the differences among multiple groups. SPSS13.0 was used for data analysis. A p-value <0.05 was considered statistically significant.
RESULTS
PCI-neo-HGF Transfection Has No Effect on α-SMA Expression in Glomerulus Mesangial Cells
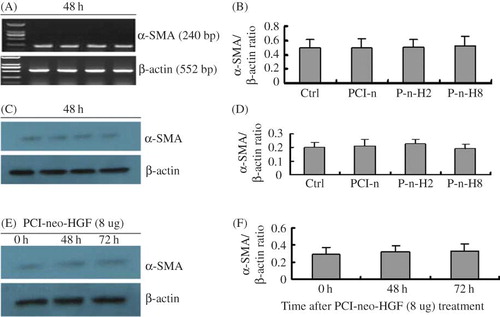
At 0 h, 48 h, and 72 h after transfection, there was no statistical difference in α-SMA expression at both mRNA and protein levels among the Ctrl, PCI-n, P-n-H2, and P-n-H8 groups. The relative expression of α-SMA mRNA and protein in different groups at 48 h is presented in A–D. In addition, α-SMA expression in the PCI-neo-HGF (8 μg) treatment group was not different in any of the time points after transfection (E and F). Thus, different doses of PCI-neo-HGF did not increase α-SMA protein expression in glomerulus mesangial cells.
Figure 1. PCI-neo-HGF transfection has no effect on α-SMA expression in glomerulus mesangial cells. (A) RT-PCR analysis of α-SMA mRNA levels 48 h after transfection. (B) Densitometric analysis of α-SMA mRNA normalized to β-actin. Compared with Ctrl, there was no statistical difference in the groups. (C) Representative Western blot analysis of α-SMA protein level 48 h after transfection. (D) Densitometric analysis of α-SMA protein normalized to β-actin. Compared with Ctrl, there was no statistical difference in the groups. (E) Western blot analysis of α-SMA protein level after transfection with PCI-neo-HGF (8 μg) at the different time points. (F) Densitometric analysis of α-SMA protein normalized to β-actin. Compared with Ctrl, there was no statistical difference at 48 h and 72 h. Ctrl, control; PCI-n, cells + PCI-neo (2 μg); P-n-H2, cells + PCI-neo-HGF (2 μg); and P-n-H8, cells + PCI-neo-HGF (8 μg).
PCI-neo-HGF Transfection Inhibits α-SMA Expression in Glomerulus Mesangial Cells Stimulated by LPS
At 48 h there were statistical differences in α-SMA expression at mRNA and protein levels in the glomerulus mesangial cells stimulated by LPS compared with unstimulated control cells, indicating that LPS stimulates α-SMA expression. However, after PCI-neo-HGF transfection α-SMA expression at both mRNA and protein levels decreased significantly compared with C + L. α-SMA expression in the P-n-H8 group was the lowest of all groups (A–D). Therefore, we concluded that HGF can inhibit LPS-induced α-SMA expression in a dose-dependent manner.
Figure 2. PCI-neo-HGF transfection inhibits α-SMA expression in glomerulus mesangial cells stimulated by LPS. (A) RT-PCR analysis of α-SMA mRNA level 48 h after transfection. (B) Densitometric analysis of α-SMA mRNA normalized to β-actin. (C) A representative Western blot analysis of α-SMA protein level 48 h after transfection. (D) Densitometric analysis of α-SMA protein normalized to β-actin. (E) Western blot analysis of α-SMA protein level after transfection with PCI-neo-HGF (8 μg) at different time points. (F) Densitometric analysis of α-SMA protein normalized to β-actin. α-SMA protein expression decreased gradually with time. Ctrl, contral; C + L, cells + LPS; PCI-n, cells + LPS + PCI-neo (2 μg); P-n-H2, cells + LPS + PCI-neo-HGF (2 μg); P-n-H8, cells + LPS + PCI-neo-HGF (8 μg). *p < 0.05 versus Ctrl group; **p < 0.05 versus C + L group, ***p < 0.05 versus 0 h.
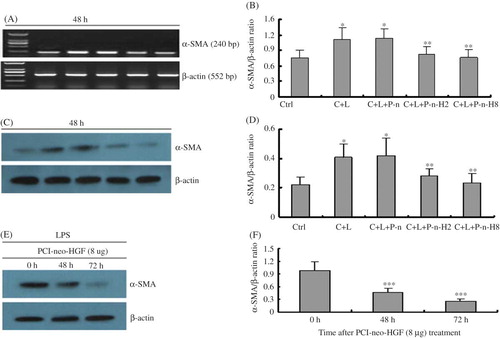
In addition, α-SMA protein expression decreased gradually in the P-n-H2 and P-n-H8 groups. This time was prolonged in mesangial cells that had been induced by LPS, and at 72 h α-SMA protein expression was the lowest. α-SMA protein expression in the PCI-neo-HGF (8 μg) treatment group is shown in E and F, which indicates that HGF can inhibit α-SMA expression in a time-dependent manner following LPS stimulation.
Inhibition of TGF-β1 Inhibits α-SMA Expression in LPS-Stimulated Glomerulus Mesangial Cells
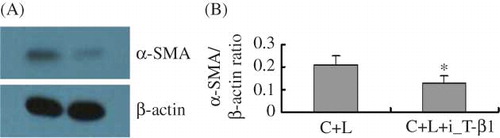
At 48 h after inhibition of TGF-β1, α-SMA protein expression decreased significantly compared with C + L (A and B). Therefore, we conclude that inhibition of TGF-β1 can inhibit LPS-induced α-SMA expression, suggesting a link between the increase in the expression of α-SMA after LPS treatment and the activation of TGF-β1.
Figure 3. Inhibition of TGF-β1 inhibits α-SMA expression in glomerulus mesangial cells stimulated by LPS. (A) Representative Western blot analysis of α-SMA protein level 48 h after addition of TGF-β1 inhibitor. (B) Densitometric analysis of α-SMA protein normalized to β-actin. C + L, cells + LPS; C + L + i-T-β1, cells + LPS + inhibition of TGF-β1 (8 μg). *p < 0.05 versus C + L group.
Serum HGF of 5/6 Nephrectomized Rats Detected Using Sandwich ELISA Assay
We examined serum HGF concentration in 5/6 nephrectomized rats using Sandwich ELISA assay 9 weeks after the second surgery. Although no significant differences were observed among the Ctrl, PCI-n, Sham, and Neph groups, HGF was significantly higher in the Low and High groups than the other four groups ().
Figure 4. Serum HGF level in 5/6 nephrectomized rats detected using ELISA. Ctrl, control group; PCI-n, PCI-neo group; Sham, sham-operation group; Neph, 5/6 nephrectomy group; Low, low-dose PCI-neo-HGF group; High, high-dose PCI-neo-HGF group. *p < 0.05 versus Ctrl group.
Biochemical Parameters in Different Groups of Rats
We examined the biochemical parameters in different groups of rats 9 weeks after the second surgery, including red blood cell, hemoglobin, plasma-albumin, blood urea nitrogen (BUN), serum creatinine, and 24 h UPE. No significant differences in these parameters were observed among the Ctrl, PCI-n, and Sham groups (). In contrast, BUN, creatinine, and 24 h UPE levels were significantly higher in the Neph group rats compared with that in the control group. Compared with the Neph group, BUN, creatinine, and 24 h UPE levels were lower in the Low and High groups and of the two the lowest values were observed in the High group ().
Table 2. Red blood cell, hemoglobin, plasma-albumin, BUN, plasma-albumin, and UPE levels in different groups of rats.
On the contrary, plasma-albumin, red blood cell, and hemoglobin levels in the Neph group rats were significantly decreased compared with the Ctrl group. Plasma-albumin, red blood cell, and hemoglobin levels were higher in the Low and High groups than in the Neph group rats, and the highest levels were found in the High group ().
Histology Examination in Different Groups of Rats
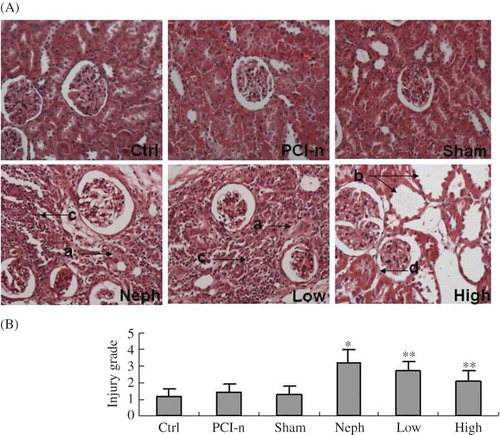
Hematoxylin–Eosin staining indicated that renal glomeruli, tubule, and interstitium were normal in Ctrl, PCI-n, and Sham rats. Large focal lesions were observed in the Neph group, and there was excessive accumulation of fibrous tissue and tubular atrophy. In the Low group rats, focal lesions and deposition of fibrous tissue improved significantly compared with the Neph group. In the High group rats, the injury decreased further. We observed tubular atrophy and vacuolar degeneration of tubular epithelial cells in some places. There was no statistical difference in the injury grade of renal tubulointerstitium between the Ctrl, PCI-n, and Sham group rats. Injury points in the Neph group rats were the highest and those in the High group were the lowest ().
Figure 5. Histology examination in rats. (A) Pathology examination by Hematoxylin–Eosin staining (200×). (B) Injury grade of renal tubulointerstitium. Ctrl, control group; PCI-n, PCI-neo group; Sham, sham-operation group; Neph, 5/6 nephrectomy group; Low, low-dose PCI-neo-HGF group; High, high-dose PCI-neo-HGF group. *p < 0.05 versus Ctrl group; **p < 0.05 versus Neph group. (a) Excessive accumulation of fibrous tissue; (b) tubular atrophy; (c) interstitial inflammation; and (d) vacuolar degeneration of tubular epithelial cells.
Immunohistochemical Staining of Col-I Protein
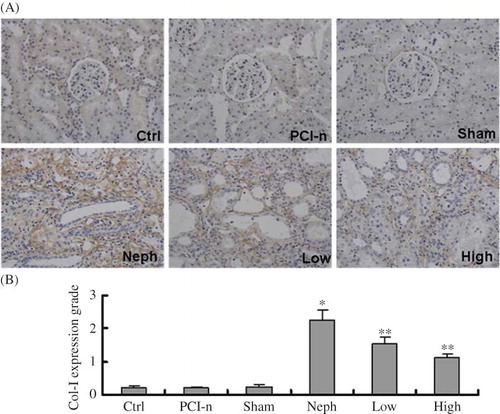
Immunohistochemical staining revealed that Col-I expression was the highest in renal interstitium in the injured section, and even stronger in the excessive accumulation of fibrous tissue. Col-I expression was the strongest in the Neph group rats. Compared with the Neph group, Col-I expression was weak in the Low and High group rats, and even weaker in the High group ().
Figure 6. Immunohistochemical staining of Col-I protein in different groups of rats. (A) Staining of injured renal tissues by Col-I antibody (200×); (B) Quantification of Col-I expression. Col-I expression was the strongest in the Neph group. Ctrl, control group; PCI-n, PCI-neo group; Sham, sham-operation group; Neph, 5/6 nephrectomy group; Low, low-dose PCI-neo-HGF group; High, high-dose PCI-neo-HGF group. *p < 0.05 versus Ctrl group; **p < 0.05 versus Neph group.
Immunohistochemical Staining of α-SMA Protein
Immunohistochemical staining revealed that α-SMA expression was highest in smooth muscles near tubule and renal interstitium in the injured section. α-SMA expression was the strongest in the Neph group rats. Compared with the Neph group, α-SMA expression was weak in the Low and High group rats, and even weaker in the High group ().
Figure 7. Immunohistochemical staining of α-SMA protein in different groups of rats. (A) Staining of injured renal tissues by α-SMA antibody (200×). (B) Quantification of α-SMA expression. α-SMA expression was the strongest in the Neph group. Ctrl, control group; PCI-n, PCI-neo group; Sham, sham-operation group; Neph, 5/6 nephrectomy group; Low, low-dose PCI-neo-HGF group; High, high-dose PCI-neo-HGF group. *p < 0.05 versus Ctrl group; **p < 0.05 versus Neph group.
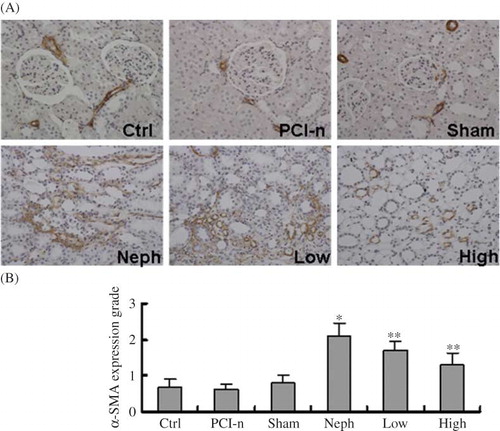
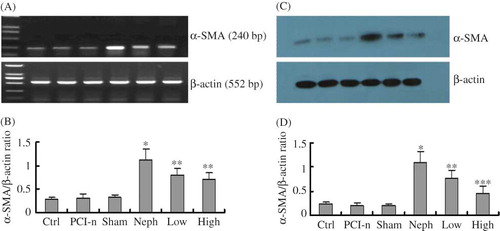
Figure 8. HGF mitigates renal injury induced α-SMA expression. (A) RT-PCR analysis of α-SMA mRNA level in different renal tissues. (B) Densitometric analysis of α-SMA mRNA normalized to β-actin. (C) A representative Western blot of α-SMA protein level in different renal tissues. (D) Densitometric analysis of α-SMA protein normalized to β-actin. Ctrl, control group; PCI-n, PCI-neo group; Sham, sham-operation group; Neph, 5/6 nephrectomy group; Low, low-dose PCI-neo-HGF group; High, high-dose PCI-neo-HGF group. *p < 0.05 versus Ctrl group; **p < 0.05, ***p < 0.01 versus Neph group.
HGF Mitigates α-SMA Expression Induced by Renal Injury
To further confirm the difference in α-SMA expression among different groups, renal tissues were subjected to RT-PCR and Western blot analysis. The results showed no statistical difference in α-SMA expression at both mRNA and protein levels among the Ctrl, PCI-n, and Sham group rats, consistent with immunohistochemical staining. These data indicate that PCI-neo control vector injection or sham-operation had no influence on α-SMA expression. In contrast, α-SMA expression was the strongest in the Neph group rats. Compared with the Neph group, α-SMA expression was weak in the Low and High group rats, and even weaker in the High group (), which was in agreement with the immunohistochemical staining. Taken together, these data demonstrate that renal injury induces α-SMA expression, which can be mitigated by HGF in a dose-dependent manner.
DISCUSSION
Chronic glomerulonephritis is the most common cause of chronic renal failure in China. Excessive proliferation of mesangial cells and excessive deposition of extracellular matrix are common manifestations of chronic renal failure. Glomerular injury can lead to excessive proliferation of mesangial cells,Citation23 and activated mesangial cells are the primary source of extracellular matrix deposition.Citation24 Together these events can contribute to the pathogenesis of chronic renal failure. Therefore, chronic renal disease can be delayed by inhibiting mesangial cell proliferation and extracellular matrix accumulation.Citation25 HGF is an antifibrotic factor and has potential use in treating kidney diseases by reducing extracellular matrix accumulation and promoting transdifferentiation and proliferation of tubular epithelial cells.Citation26
α-SMA is a characteristic protein of smooth muscle cells and myofibroblasts, and high expression of α-SMA in the kidney is the marker of tubular epithelial-myofibroblast transdifferentiation.Citation4 In addition, α-SMA-induced activation of mesangial cells contributes to the deposition of extracellular matrix and glomerulosclerosis.Citation14
In this study, we used LPS to stimulate the hyperplasia of glomerulus mesangial cells and increased the deposition of extracellular matrix.Citation15 Forty-eight hours after inhibition of TGF-β1 in the group of cells + LPS, α-SMA protein level decreased significantly compared with cells + LPS. Therefore, we conclude that inhibition of TGF-β1 could inhibit LPS-induced α-SMA expression. We examined α-SMA expression in mesangial cells transfected with different doses of a HGF expression vector. The results indicated that HGF can inhibit α-SMA expression in a dose- and time-dependent manner in LPS-stimulated mesangial cells, but not in unstimulated mesangial cells.
Furthermore, in the 5/6 nephrectomy in vivo model, we examined serum HGF concentration using Sandwich ELISA in different groups of rats 9 weeks after the second surgery and found that it was significantly higher in the Low and High groups than in the Ctrl, PCI-n, Sham, and Neph groups. BUN, serum creatinine, and 24 h UPE levels were significantly higher and plasma-albumin, red blood cell, and hemoglobin levels were lower than the Ctrl, PCI-n, and Sham groups, thus confirming the relevance of our kidney injury in the model. Injection of the HGF expression vector into the 5/6 nephrectomy model normalized the above biochemical parameters indicating improved renal function. Notably, higher doses of HGF yielded better improvement in renal function. Pathology examination further demonstrated alleviated interstitial inflammation and deposition of fibrous tissue, in HGF treated rats. Finally, by immunohistochemical staining, RT-PCR, and Western blot analysis we noted that α-SMA expression at both mRNA and protein levels was increased in the renal tissues 9 weeks after 5/6 nephrectomy, and HGF reduced α-SMA expression in accordance with the biochemical changes and pathological changes. α-SMA is an important factor in kidney injury, and high expression of α-SMA in kidney promotes the progression of renal disease.Citation27 Our experimental data provide strong evidence that HGF can improve renal function by protecting renal tissue against injury that was associated with down-regulation of α-SMA expression. Further preclinical studies are necessary to fully investigate HGF’s potential in treating chronic renal failure in humans.
ACKNOWLEDGMENT
Project was supported by Jilin Provincial Department of Health (No.2009ZC041).
Declaration of interest: The authors report no conflicts of interest. The authors alone are responsible for the content and writing of the paper.
REFERENCES
- Grupp C, Troche I, Klass C. A novel model to study renal myofibroblast formation in vitro. Kidney Int. 2001;59(2):543–553.
- Ruiz-Ortega M. Angtotensin regulates the synthesis of proinflammatory cytokines and chemokines in the kidney. Int Supply. 2002;8(2):12–22.
- Okada H, Inoue T, Suzuki H. Epithelial-mesenchymal transformation of renal tubular epithelial cells in vitro and in vivo. Nephrol Dial Transplant. 2000;15:44–46.
- Jiang T, Zhou QS, Pi L, Huang B. Role of angiotensin II and JAK2 signal pathway in transdifferentiation of renal tubular cells in mice after acute ischemic followed by reperfusion. Chinese J Pathol. 2009;38:466–471.
- Funakoshi H, Nakamura T. Hepatocyte growth factor from diagnosis to clinical applications. Clin Chim Acta. 2003;327:1–23.
- Forte G, Minieri M, Cossa P, . Hepatocyte growth factor effects on mesenchymal stem cells: Proliferation, migration, and differentiation. Stem Cells. 2006;24:23–33.
- Yamasaki N, Nagano T, Mori-Kudo I, . Hepatocyte growth factor protects functional and histological disorders of HgCl (2) – Induced acute renal failure mice. Nephron. 2002;90:195–205.
- Yang J, Liu Y. Delayed administration of hepatocyte growth factor reduces renal fibrosis in obstructive nephropathy. Am J Physiol Renal Physiol. 2003;284:349–357.
- Dai C, Liu Y. Hepatocyte growth factor antagonizes the profibrotic action of TGF-beta 1 in mesangial cells by stabilizing Smad transcriptional corepressor TGIF. J Am Soc Nephrol. 2004;15(6):1402–1412.
- Yang J, Dai C, Liu Y. Hepatocyte growth factor suppresses renal in Terstitial myofibroblast activation and intercepts Smad signal transduction. Am J Pathol. 2003;163(2):621–632.
- Li Y, Yang J, Dai C, . Role for integrin-linked kinase in mediating tubular epithelial tomesenchymal transition and renal interstitial fibrogenesis. J Clin Invest. 2003;112(4):503–516.
- Shimamura M, Sato N, Yoshimura S, . HVJ-based non-viral gene transfer method: Successful gene therapy using HGF and VEGF genes in experimental ischemia. Front Biosci. 2006;11:753–759.
- Wang W, Li C, Summer SN, . Role of AQP1 in endotoxemia-induced acute kidney injury. Am J Physiol Renal Physiol. 2008;294:1473–1480.
- Dai C, Yang J, Sheldon B, . Intravenous administration of hephtocyte growth factor gene ameliorates diabetic nephropathy in mice. J Am Soc Nephrol. 2004;15(10):2637–2647.
- Hao Z-H, Yu L, Wang L-N, . Effects of fosinopril on expression of transforming growth β1 of rat glomerular mesangial cell. Chin J Obs/Gyne &.Pediatr. 2008;4(3):191–195.
- Shen Y, Yang X, Chen Q-X, . Renal pathological changes in rats with 5/6 nephrectomy. Shanghai Lab Anim Sci. 2005;25:21–24.
- Zhao G, Zhao H, Tu L, . Effects and mechanism of irbesartan on tubulointerstitial fibrosis in 5/6 nephrectomized rats. J Huazhong Univ Sci Technol Med Sci. 2010;30:48–54.
- Yang J, Chen S, Huang L, . Sustained expression of naked plasmid DNA encoding hepatocyte growth factor in mice promotes liver and overall body growth. Hepatology. 2001;33:848–859.
- Li Y-X, Wang F, Niu J-Q, . Construction of hepatocyte growth factor expression vector and detection at its expression in COS7 cell line. J Jilin Univ (Med Ed). 2007;33:297–300.
- Kim YS, Xu ZG, Reddy MA, . Novel interactions between TGF-betal actions and the 12/15-lipoxygenase pathway in mesangial cells. J Am Soc Nephrol. 2005;16:352–362.
- Ionescu E, Sauter JF, Jeanrenaud B. Abnormal oral glucose tolerance in genetically obese (fa/fa) rats. Am J Physiol. 1995;248:500–506.
- Reddy MA, Adler SG, Kim YS, . Interaction of MARK and 12-lipoxygenase pathways in growth and matrix protein expression in mesangial cells. Am J Physiol Renal Physiol. 2002;283:985–994.
- Matsuo S. Multifunctionality of PAI-1 in fibrogenesis: Evidence from obstructive nephropathy in PAI-1-overexpressingmice. Kidney Int. 2005;67(6):2221–2238.
- Yamaguchi Y. Possible involvement of urokinase-type plasminogen activator release from human peripheral blood lymphocytes in the pathophysiology of chronic allograft nephropathy. Transplant Proc. 2005;37(10):4276–4281.
- Hayashida T, PonceletA C, Hubchak SC, . TGF-β1 activates M A P kinase in human mesangial cells: A possible role in collagen expression. Kidney Int. 1999;56(5):1710–1720.
- Lesko E, Majka M. The biological role of HGF-MET axis in tumor growth and development of metastasis. Front Biosci. 2008;13:1271–1280.
- Liu Y. Epithelial to mesenchymal transition in renal fibrosis pathologic significance, molecular mechanism, and therapeutic intervention. J Am Soc Nephrol. 2002;13:151–152.