Abstract
Objective: The effects of inhibition of monocyte chemoattractant protein-1 (MCP-1) on a rat model of mesangial proliferative glomerulonephritis (MsPGN) were evaluated. Methods: The anti-Thy-1 MsPGN model was developed by intravenously injecting anti-Thy-1 monoclonal antibodies into rats, followed by an injection of mesangial cells transfected with antisense MCP-1 into the renal artery. Exogenous cells were detected by in situ hybridization. Rats (40 total) were randomly divided into five groups: SO (sham operation), TG (Thy-1 glomerulonephritis model), MC (non-transfected normal rat mesangial cell), BC (pLXSN empty vector or blank control), and AM (antisense MCP-1 transfection) groups. Effects of exogenous MCP-1 on urinary protein excretion rate, biochemical parameters, and pathological changes were evaluated. Expression of MCP-1 and transforming growth factor-β1 (TGF-β1) were detected by immunohistochemistry. mRNA expression of MCP-1, TGF-β1, and CC chemokine receptor 2 (CCR2) were detected by RT-PCR. Results: Exogenous MCP-1 cDNA was successfully transfected into mesangial cells. Exogenous mesangial cells were detected in glomeruli by in situ hybridization. Glomerular mesangial cell proliferation, 24-h urinary protein excretion rate, mRNA expression of MCP-1, TGF-β1, and CCR2, and protein expression of MCP-1 all decreased in the AM group as compared to the control group (p < 0.05), but there was no significant difference in the expression level of TGF-β1 protein. Conclusions: (1) Mesangial cells can be used as a vector to transfect exogenous genes into kidneys; (2) antisense MCP-1 decreases mesangial cell proliferation and pathological injury in MsPGN model rats by decreasing expression of MCP-1 and CCR2; and (3) antisense MCP-1 suppressed mesangial cell proliferation and matrix accumulation in anti-Thy-1 MsPGN model rats, which did not entirely depend on TGF-β1.
Introduction
Mesangial proliferative glomerulonephritis (MsPGN) is one of the most common forms of glomerulonephritis in humans. A retrospective study of 13,519 cases of renal biopsy in patients with kidney disease from the Chinese Research Institute of Nephrology demonstrated that primary glomerulonephritis (PGN) remained the most important and prevalent renal disease in China, with MsPGN constituting 17.6% of total kidney diseases and ranking only second to IgA nephropathy.Citation1 Whatever the origins of primary glomerular disease, any inflammation involving mesangial cells can lead to mesangial cell proliferation and extracellular matrix accumulation, resulting in glomerular sclerosis. Therefore, excessive mesangial cell proliferation and matrix expansion are hallmarks and common features in a number of glomerular diseases, including MsPGN.Citation2 Various cells can synthesize and secrete monocyte chemoattractant protein-1 (MCP-1), a potent chemotactic factor for monocytes, which can both induce the chemotactic effects of monocytes and activate them to promote the production of oxygen-free radicals and the release of lysosomes. These effects aggravate tissue damage. Under the action of inflammatory factors, mesangial cells can release MCP-1.Citation3 Cell-to-cell contacts between monocytes and mesangial cells can also induce MCP-1 expression.Citation4 Furthermore, human mesangial cells can express MCP-1 receptor CCR2 (CC chemokine receptor 2),Citation5 through which MCP-1 can activate mesangial cells. Consequently, MCP-1 not only can induce the chemotactic effects of monocytes, but also have an effect on glomerular mesangial cells. To date, no specific anti-proliferative treatment for MsPGN is available for human renal disease. In vitro, we have discovered that antisense MCP-1 can inhibit mesangial cell proliferation under the stimulation of lipopolysaccharide (LPS). It is unclear, however, whether antisense MCP-1 has the same effect in vivo.
Extracellular matrix (ECM) expansion and mesangial cell proliferation always follow and promote each other. Transforming growth factor-β1 (TGF-β1) is thought to be the key mediator of matrix accumulation in many renal disorders.Citation6 Increasing expression of TGF-β1 in mesangial cells promotes the synthesis of matrix proteins and the inhibition of matrix turnover. With the increased expression of TGF-β1 in mesangial cells, expression of fibronectin (FN), laminin, collagen, and extracellular matrix (ECM) was also increased to different degrees in various human glomerular diseases, including glomerulosclerosis.Citation7,Citation8 Further research found that TGF-β1 not only plays an autocrine function in glomerular mesangial cells, but can regulate ECM synthesis by adjusting and controlling activation of the mesangial cell TGF-β1 receptor.Citation9–11 However, it is still unclear whether antisense MCP-1 can affect mesangial ECM expansion or TGF-β1 secretion. We established an MsPGN animal model to investigate whether antisense MCP-1 can modulate mesangial cell proliferation and ECM secretion in vivo. At present, the anti-Thy-1 nephritis model is a well-established and frequently used rat model for studying inhibitors of mesangial cell proliferation and matrix expansion in vivo.Citation12 This model, characterized by rapidly developing marked mesangial lesions, is reproducible and very similar to human MsPGN; the latter is characterized by glomerular hypercellularity, variable amounts of proteinuria and a marked increase of extracellular matrix proteins.Citation13 Most importantly, the operation to establish this model is simple, convenient, and feasible. Therefore, we used the anti-Thy-1 nephritis rat model to study the effects of antisense MCP-1 on the expression of MCP-1 and TGF-β1, nephritis pathology, mesangial cell proliferation, and ECM accumulation. Furthermore, we sought to provide a theoretical basis for the therapeutic use of antisense MCP-1 in MsPGN.
Materials and methods
Construction of recombinant retrovirus antisense pLXSN/MCP-1 plasmid expressing the MCP-1 gene
MCP-1 cDNA fragments were amplified by reverse transcription-polymerase chain reaction (RT-PCR) using the primers 5′-CAGGTCTCTGTCACGTTCT-3′ (forward primer P1 in 4-23 bp site) and 5′-AGTATTCATGGAAGGGAATAG-3′ (reverse primer P2 in the 510–530 bp site) (synthesized by Cell Bioengineering Co., Shanghai, China) from cultured rat mesangial cells, which were provided by the Molecular Biology Teaching and Research Section of Xiangya School of Medicine, Central South University, China. The experimental process was performed according to the manufacturer’s instructions. RT-PCR amplification involved a 3-min pre-heating at 95 °C followed by 35 cycles of DNA denaturation at 94 °C for 30 s, annealing at 56 °C for 30 s, and polymerization at 72 °C for 30 s followed by a 5-min final extension at 72 °C. The resulting product was observed by using 1.5% agarose gel electrophoresis. Reaction product was then inserted into the pGEM-TE (Promega, Madison, WI) plasmid for DNA sequencing. Construction of the recombinant retrovirus antisense pLXSN/MCP-1 (pLXSN is a retroviral empty vector, which contains elements derived from Moloney murine leukemia virus and Moloney murine sarcoma virus and is designed for retroviral gene delivery and expression) plasmid was confirmed with the restriction enzyme EcoRI (TaKaRa Bio, Otsu, Shiga, Japan) on pTE-MCP-1 and retrovirus plasmid pLSXN (kindly provided by Dr. A. D. Miller, University of Washington, Seattle, WA) and with the action of T4DNA ligase (Promega). The orientation of the MCP-1 in the plasmid was confirmed by digestion with Bgl II and Xho I (TaKaRa Bio).
In vitro transfection into mesangial cells with retroviruses
The MCP-1 gene was transfected into mesangial cells using retroviruses as previously described.Citation14 Rat mesangial cells were routinely maintained in Dulbecco’s Modified Eagle’s Medium (DMEM) (GIBCO, Carlsbad, CA) containing 10% calf serum (Ding Guo, Beijing, China), incubated in an incubator at 5% CO2 and 37 °C, and passaged once or twice each week. We used retrovirus pseudotype viral particles to transfect rat mesangial cells. At 24 h before transfection, the cultured rat glomerular mesangial cells were grown overnight to 50% confluency in six-well tissue culture plates, supplemented with 2 ml DMEM containing 10% calf serum at 37 °C in a humidified atmosphere of 5% CO2, and allowed to grow to 80% confluency. Before transfection, the cultured cells were washed twice with serum-free DMEM medium supplemented with 10% calf serum. Empty vector (100 µl), pseudovirions (100 µl) and 4 mg/l polybrene (Sigma Chemical Co., St. Louis, MO) were then added to the cultured cells in the six-well plates. After 24 h, the samples were added to 2 ml DMEM containing 10% calf serum. After 48 h, the cells (diluted 1:20) were transfected with G418 plasmid (800 mg/l; GIBCO). Cells were harvested 2 weeks later and assayed for positive clones of MCP-1 transfection. Scale-up culture was performed after cloning.
Detection of transfected mesangial cells by PCR
The cells were divided into three groups: (1) non-transfected normal rat mesangial cell group (MC) as a control group; (2) pLXSN empty vector group as a blank control group (BC); and (3) antisense MCP-1 transfection group (AM). Integration of the neor gene and MCP-1 cDNA in rat mesangial cells was detected by PCR. The neor gene in the vector was amplified by PCR, using the following primers: Forward – 5′-AGATGGATTGCACGCAGGTT-3′ (bp 2077-2096) and reverse – 5′-GAAGGCGATAGAAGGCGATG-3′ (bp 2824–2843) (synthesized by AuGCT DNA-SYN Biotechnology Co., Ltd., Beijing, China). The amplification product was 767 bp in length. PCR amplification was performed with 35 cycles of DNA denaturation at 94 °C for 30 s, annealing at 60 °C for 45 s, and polymerization at 72 °C for 60 s followed by a 7-min final extension at 72 °C. MCP-1 cDNA fragments were amplified by PCR (by the same method).
Animal experiment
Animals
A total of 60 four-to-six-week-old adult female Sprague–Dawley (SD) rats weighing 90 to 110 g (animal license No. SYXK (Xiang), 2004-0013) were obtained from the Animal Center, Xiangya School of Medicine, Central South University (Changsha, Hunan Province, China). Rats were housed in temperature- (22 ± 2 °C) and humidity-controlled (55 ± 5%) rooms with a 12-h on, 12-h off light cycle. They were fed with standard food and had free access to tap water. All animal experiments were performed according to the guiding principles for research involving animals and human beings of the American Physiological SocietyCitation15 and duly approved by local government authorities. Experimental protocols were reviewed and approved by the Ethics Committee for Animal Research of Xiangya School of Medicine, Central South University.
Experimental protocol
Twenty SD rats were divided into two groups: disease model (n = 16) and normal controls (n = 4). The disease was induced by a single intravenous injection of anti-Thy-1.1 monoclonal antibody (200 µg/kg body weight; PharMingen International; San Diego, CA). A total of four SD rats were then sacrificed on Day 1, Day 2, Day 4, and Day 7 after injection. As a control (Day 0, n = 4), the same volume of normal saline was injected instead of anti-Thy-1.1 monoclonal antibodies. After injection, the rats were sacrificed and renal tissues and 24-h urine samples were collected and tested.
The remaining 40 animals were divided into five groups: SO (sham operation, n = 8), TG (Thy-1 glomerulonephritis model, n = 8), MC (non-transfected normal rat mesangial cell, n = 8), BC (pLXSN empty vector or blank control, n = 8), and AM (antisense MCP-1 transfection, n = 8) groups. Equal randomization methods were used as follows: 40 adult female SD rats were assigned a number of 1 to 40 according to body weight, from the lightest to the heaviest. The number 1 to number 40 rats then received a three-digit number in order from a three-digit random number table. The 40 three-digit numbers were then reordered from the 1st to the 40th. Rats that matched the 1st to the 8th were assigned to the SO group; those that matched the 9th to the 16th were assigned to the TG group; those that matched the 17th to the 24th were assigned to the MC group; those that matched the 25th to the 32nd were assigned to the BC group; those that matched the 33rd to the 40th were assigned to the AM group.
In the SO group, 0.5 ml of normal saline was injected into the caudal vein instead of anti-Thy-1.1 monoclonal antibodies and 0.5 ml DMEM was injected into the renal artery on the second day after the saline injection. In the TG group, anti-Thy-1.1 monoclonal antibodies (Antibody Solutions, PharMingen International) were injected intravenously into rats (200 µg/kg body weight) and 0.5 ml DMEM was injected into the renal artery on the second day after injection of the antibodies. In the MC group, anti-Thy-1.1 monoclonal antibodies were injected intravenously into rats (200 µg/kg body weight) and 106 normal mesangial cells were injected into the renal artery on the second day after injection of the antibodies. In the BC group, anti-Thy-1.1 monoclonal antibodies were injected intravenously into rats (200 µg/kg body weight) and 106 pLXSN empty vector transfected mesangial cells were injected into the renal artery on the second day after injection of the antibodies. In the AM group, anti-Thy-1.1 monoclonal antibodies were injected intravenously into rats (200 µg/kg body weight) and 106 antisense MCP-1 transfected mesangial cells were injected into the renal artery on the second day after injection of the antibodies. All rats were sacrificed on Day 7 after initial injections. The kidneys were perfused with saline and removed. Blood, urine, and fresh kidney tissue were collected to evaluate renal function and for renal biopsy.
Urinary protein excretion
Urinary protein in 24-h urine samples was measured with a Beckman DU-7 spectrophotometer (Beckman Coulter; Brea, CA) using the double wavelength method. Urinary protein concentration was evaluated with the following formula: Urinary protein concentration (mg/ml) = (1.45 × D280 – 0.741 × D260) × dilution coefficient. D280 and D260 represent the absorbance of specimens at 280 and 260 nm, respectively.
Blood biochemical analyses
Blood samples were obtained by aortic puncture on the day of sacrifice. Serum creatinine (SCr), blood urea nitrogen (BUN), albumin, and cholesterol concentrations were detected with a Hitachi 7150 automatic biochemical analyzer (Hitachi, Tokyo, Japan).
Renal histology
Briefly, kidneys were harvested and renal tissue was fixed in 10% formalin. After dehydration through a graded series of ethanol solutions, the tissue was embedded in paraffin. Paraffin sections (3 µm) were stained with hematoxylin-eosin (HE) and periodic acid-Schiff (PAS) base and examined by normal light microscopy. The number of glomerular cells of each section was counted in 20 randomly selected glomeruli (light microscopy, 400 × magnification). The karyocyte count was measured in each glomerulus. The average karyocyte count of the 20 random glomeruli was then calculated, giving the number of glomerular cells of each section. A detailed microscopic examination for the number of glomerular cells was performed by two pathologists. All morphological quantitation was performed by observing the whole section under an Eclipse E400 light microscope (Nikon, Tokyo, Japan). Semi-quantitative morphological studies of glomerular lesions on 20 glomeruli, randomly selected from each specimen, were performed by two pathologists who were blinded to sample identity. The presence of lesions (glomerular mesangial cellularity or matrix expansion) was studied separately and graded according to the percentage of glomeruli showing each lesion. The percentage of glomeruli showing lesions was detected in each glomerulus. The average percentage of glomeruli showing lesions of the 20 glomeruli was then calculated, giving the percentage of glomeruli showing lesions in each section.
Scores of glomerular lesions were between 0 and 18. For this purpose, the following evaluation criteria were used to determine mesangial cellularity scoring, based on the number of mesangial cells per mesangial area: 0 (<3 cells), 1 (3 cells), 2 (4 cells), and 3 (more than 4 cells).
The extent of widening of the mesangial matrix and diameter of capillary lumens and its extent of openness, were scored as: 0, good degree of capillary lumen and lack of obvious mesangial matrix hyperplasia; 1, segmental mesangial matrix hyperplasia with the width of the mesangial matrix being slightly less than the diameter of capillary lumens; 2, diffuse mesangial matrix hyperplasia, with the width of the mesangial matrix being slightly larger than the diameter of capillary lumens and hyperplastic mesangial matrix having a modest degree of damage to capillary lumens; and 3, diffuse mesangial matrix hyperplasia, with most of the capillary lumens being closed and hyperplastic mesangial matrix having a serious degree of damage to capillary lumens.
Glomerulosclerosis was based on the percentage of glomeruli showing segmental adhesions or sclerosis and was scored as: 0 (absent); 1 (<30% of all biopsied glomeruli); 2 (30%–60% glomeruli); and 3 (>60% glomeruli). Severe glomerulosclerosis was defined as ≥30% glomeruli showing segmental adhesions or sclerosis (glomerulosclerosis score ≥2). “Segmental” refers to a lesion involving less than half of the glomerular tuft. Adhesion is defined as an area of continuity between the glomerular tuft and Bowman’s capsule with associated ECM. Sclerosis is defined as obliteration of the capillary lumen by increased ECM.Citation16–18
Thickened glomerular basement membrane, stenosis, or damage of capillary loop and adhesion of capsule wall were scored as: 0 (absent); 1 (<30% of all biopsied glomeruli); 2 (30%–60% glomeruli); and 3 (>60% glomeruli).
Semi-quantitative morphological studies of renal interstitial lesions were performed on 20 random fields. A semi-quantitative scoring for assessment of tubulo-interstitial damage (TID) was developed. The range of lesions of the renal interstitium was detected in each field. The extent of tubulo-interstitial lesions was scored as follows: 0, lesions absent; 1, focal, extent of lesions was <20% of the biopsy area; 2, diffuse, extent of lesions was 20%–40% of the biopsy area; and 3, diffuse and intensive, extent of lesions was >40% of the biopsy area. The following evaluation criteria were used to grade the renal interstitial lesions: the extent of widening of renal tubules, the extent of tubular atrophy, the extent of vacuolar degeneration in renal tubular epithelia, the extent of necrosis in renal tubular epithelia, the extent of interstitial fibrosis, and the extent of infiltration of inflammatory cells in renal interstitium. These criteria were scored as follows: (1) focal infiltration of inflammatory cells; (2) diffuse infiltration of inflammatory cells; and (3) diffuse and extensive infiltration of inflammatory cells. Tubular atrophy was defined by thick, irregular tubular basement membranes with decreased tubule diameter. Interstitial fibrosis was defined as increased ECM separating tubules in the cortical area. Interstitial inflammation was defined as an excess of inflammatory cells within the cortical interstitium. Taking together all of the evaluation criteria, renal interstitial lesions scores were graded on a scale of from 0 to 18.
Detection of neor gene by in situ hybridization
Primers of the neor gene were amplified by PCR using the pLXSN plasmid as templates to produce the 767-bp fragments of the neor gene, which were then purified by using a gel DNA extraction kit (Roche Diagnostic Gmbh, Mannheim, Germany). The manufacturer’s instructions were stringently followed by using a digoxin marker and hybridization detection kit (Boshide Biological Engineering Co., Ltd., Wuhan, China).
Renal immunohistochemistry
Immunohistochemical staining was stringently determined by using MCP-1 antibody (rabbit anti-rat polyclonal antibody; Boshide Biological Engineering Co., Ltd.), TGF-β antibody (rabbit anti-rat polyclonal antibody; Boshide Biological Engineering Co., Ltd.), SABC immunohistochemical kit (Boshide Biological Engineering Co., Ltd.), and DAB color reagent (Boshide Biological Engineering Co., Ltd.). Negative controls were incubated without primary antibody. MCP-1 positive and TGF-β1 positive cells were counted in 20 glomeruli from each section.
Detection of expression of MCP-1, CC chemokine receptors 2, and TGF-β1 in renal tissue by semi-quantitative RT-PCR
Total RNA of the renal cortex was extracted by using the TRIzol kit (GIBCO, Carlsbad, CA). First strand cDNA was synthesized using the Reverse Transcription System from Promega according to the manufacturer’s instructions. A reaction containing 1 µl of oligo-dT, 1 µl of RNAsin, 10 µl of DEPC-treated water, and 5 µl of extracted rat RNA was placed into a centrifuge tube for centrifugation after uniform mixing. Reactions were incubated at 70 °C for 10 min and were rapidly cooled on ice for 5 min. Afterwards, 2 µl of dNTP mix, 5 µl of 10× reverse transcription buffer and 1 µl AMV reverse transcriptase (Promega) were added to the same tubes, followed by centrifugation after uniform mixing. Final reaction mixtures were incubated at 42 °C for 60 min, 95 °C for 5 min, and then cooled on ice for 10 min.
PCR analyses were performed with the following conditions: for MCP-1 – 30 cycles of 94 °C for 30 s, 56 °C for 45 s and 72 °C for 1 min; for CCR2 – 35 cycles of 94 °C for 30 s, 56 °C for 30 s, and 72 °C for 1 min; for TGF-β1 – 30 cycles of 94 °C for 30 s, 60 °C for 45 s, and 72 °C for 1 min. Each 50 µl of master mix contained 7 µl of cDNA 5 µl of 10× Taq polymerase buffer, 2 µl of 10 mmol/L dNTPs, 3 µl of magnesium chloride, and either 40 pmol (2 µl) of MCP-1 and 2 µl of GAPDH primers, 46 pmol (2 µl) of CCR2 and 2 µl of GAPDH primers, or 40 pmol (2 µl) of TGF-β1 and 2 µl of GAPDH forward and reverse primers (synthesized by AuGCT DNA-SYN Biotechnology Co., Ltd.), in nuclease-free water. Forward and reverse primers for MCP-1 were: 5′-CTTCACCACCACCATGGAGAAGG-3′ and 5′-CTTACTCCTTGGAGGCCAT-3′, respectively. Forward and reverse primers for CCR2 were 5′-GGAATCCTCCACACCCTGTTTC-3′ and 5′-ACCCAACTGAGACTTCTTGCTCCC-3′, respectively; those for TGF-β1 were 5′-CTTCAGCTCCACAGAGAAGAACTGC-3′ and 5′-CACGATCATGTTGGACAACTGCTCC-3′, respectively; those for GAPDH were 5′-CTTCACCACCACCATGGAGAAGG-3′ and 5′-CTTACTCCTTGGAGGCCAT-3′, respectively. The specificity of each primer pair was confirmed by melting curve analysis. The amplified products were examined by agarose gel electrophoresis and analyzed using an image processing system (Bio-Rad; Hercules, CA). All reactions were carried out in duplicate and the relative mRNA expression levels of MCP-1, CCR2, and TGF-β1 were determined spectrophotometrically by measuring the absorbance of GAPDH as a reference, with an ultraviolet transmission imaging system.
Statistical analysis
Data were analyzed with SPSS 10.0 (SPSS Inc.; Chicago, IL) for Windows. All values were presented as the mean ± SD. Statistical comparisons were performed by a one-way analysis of variance and the Bonferroni test when appropriate, followed by the SNK-q test for homogeneity of variance and the Game–Howell test for heterogeneity of variance. Correlation analysis was conducted by Pearson correlation analysis. All p values <0.05 (two-tailed) were considered statistically significant.
Results
Integration of neor gene and MCP-1 cDNA into rat mesangial cells
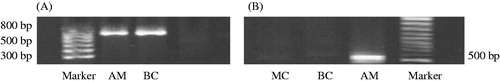
Mesangial cells, transfected by two kinds of virus particles, clonally grew with G418 screening. A positive band at 767 bp, showing the presence of mesangial cells, was only found for rats in the BC and AM groups (). A positive band of 527 bp being detected in mesangial cells transfected with the antisense MCP-1. The MCP-1 primer demonstrated specific amplification of MCP-1 cDNA, rather than the MCP-1 gene ().
Figure 1. Integration of exogenous MCP-1 cDNA into the mesangial cells of rats. (A) The neor sequence of DNA on transfected pLXSN vector in mesangial cells by PCR; (B) the MCP-1 fragment of DNA amplified by PCR in mesangial cells.
Ant-Thy-1.1 antibody induces renal lesions
Examination of HE staining on the first day after injection of anti-Thy-1.1 showed dissolution of glomerular mesangial cells, infiltration of inflammatory cells, and decreased numbers of karyocytes, which was also accompanied by accumulation of white blood cells, red blood cells, and plasma components. The amounts of glomerular cells in the model group were significantly decreased as compared to those in the control group (31.6 ± 9.4 versus 42.4 ± 9.9, respectively, p < 0.05). On the fourth day after injection of anti-Thy1.1, the extent of mesangial cell dissolution gradually decreased and the amount of nucleated cells of glomeruli increased with more hyperplasia of mesangial cells. However, there was no significant difference compared with the control group (41.3 ± 12.1 versus 42.4 ± 9.9, respectively). The number of glomerular cells significantly increased in the model group as compared to the control group, with moderate expansion of mesangial areas on the seventh day after injection, as determined by PAS staining (55.5 ± 11.9 versus 42.4 ± 9.9, respectively, p < 0.01).
Mild hematuresis, which was demonstrated at 24 h after antibody injection (2-6 RBC/HPF), reached a peak on the second day, and returned to normal by the fourth day. Proteinuria began to increase on the first day (11.4 ± 2.5 mg/24 h) and reached a peak on the fourth day (37.5 ± 7.1 mg/24 h).
Growth of injected mesangial cells in rat kidney
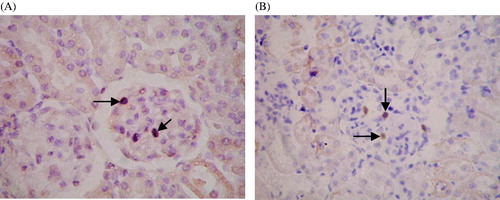
The distribution of cells with positive expression of the neor gene was observed; the cells were mainly located in glomeruli in the BC and AM groups. There was no expression of positive cells in kidney tubules, renal interstitium, or blood vessels (). There was no significant difference between the percentage of positive cells in the BC and AM groups (3.88 ± 1.55% versus 4.12 ± 1.25%, respectively).
Figure 2. Growth of exogenous mesangial cells in the rat kidney. Paraffin sections of renal tissue in the BC and AM groups were detected by in situ hybridization. The distribution of cells with positive expression of the neor gene was mainly in the glomeruli. There was no expression of positive cells in kidney tubules, renal interstitium, or blood vessels. ISH ×400. (A) BC group; (B) AM group. Black arrows indicate positive cells expressing the neor gene.
The effect of exogenous MCP-1 on urinary protein excretion rate, biochemical parameters, and pathological changes in MsPGN rats
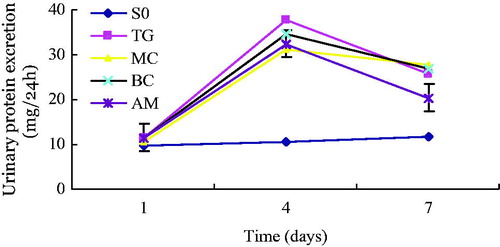
There was no significant difference in the body weight of rats among the four groups, nor were there significant differences in 24-h urinary volume on the first, fourth, and seventh day. On the first day after injection of Thy-1.1, urinary protein excretion rate immediately increased in each group, except for the SO group. Although 24-h urinary protein quantification in the SO group was not significantly different than that in the other groups, this parameter increased on the fourth day after injection of antibody in the TG, MC, BC, and AM groups, compared with that in the SO group (p < 0.05). On the seventh day after injection, urinary protein excretion rate in the TG, MC, BC, and AM groups were still higher than that in the SO group (p < 0.05), but was slightly lower than that in the SO group on the fourth day. Levels of 24-h urinary protein in the AM group were equivalent to those in the other three groups (TG, MC, BC) on the fourth day. However, the decrease in levels of 24-h urinary protein on the seventh day was greater in the AM group than that in the other groups (AM versus TG, p < 0.05; AM versus MC, p < 0.01; AM versus BC, p < 0.01) ().
Figure 3. Time-dependent changes in 24-h proteinuria in rats of each experimental group. Urinary protein was measured in 24-h urine samples were collected at one, four, and seven days after treatment with saline or Thy-1.1 antibody. Results represent the mean ± SD of measurements from eight rats in each group. Groups: SO, sham-operation; TG, Thy-1 glomerulonephritis; MC, non-transfected normal rat mesangial cell; BC, pLXSN empty vector or blank control; AM, antisense MCP-1 transfection. All measurements at Day 4 and 7 in the TG, MC, BC, and AM groups were significantly (p < 0.05) higher than those at the corresponding time point in the SO group. The decrease in levels of 24-h urinary protein on the seventh day was greater (p < 0.05) in the AM group than those of the other nephritis groups.
There was no significant difference in BUN or SCr among groups. Concentration of serum albumin was not significantly lower in the other four groups, but the level of serum cholesterol in the other four groups were markedly and significantly higher than that in the SO group (p < 0.05). Levels of albumin and serum cholesterol showed few changes after injection of different mesangial cells in the four groups of animals with nephritis. Light microscopy showed that the amounts of cells in glomeruli were normal and the mesangial matrix did not increase in area in the SO group. Compared with the SO group, the number of glomerular cells increased significantly in the other four groups (p < 0.05). However, the number of glomerular cells decreased more in the AM group than in any of the other three groups (AM versus MC, p < 0.01; AM versus BC, p < 0.01; AM versus TG, p > 0.05). The glomerular lesion scores in the other four groups were much higher than that in the SO group (p < 0.05) and the score in the AM group was much lower than that in the other three groups (AM versus TG, p < 0.05; AM versus MC, p < 0.05; AM versus BC, p > 0.05). In terms of renal interstitial lesion scores, there was no significant difference among the different groups ().
Table 1. Comparison of kidney lesion scores among different groups (mean ± SD).
Protein expression of MCP-1 and TGF-β1
Immunohistochemistry showed that MCP-1 was mainly localized in the cytoplasm. Within the kidneys, staining was mainly focused in glomerular mesangial cells and glomerular visceral epithelial cells, but also in tubular epithelial cells (). There were scarcely any positive MCP-1 cells found in the SO group, which was lower than that in the other four groups (p < 0.05). In terms of positive MCP-1 cells, there was a significant difference between the AM and MC groups (p < 0.01), but no significant difference between the TG and BC groups (shown in ).
Figure 4. Expression of MCP-1 and TGF-β1 detected by immunohistochemical staining. (A) Negative controls for immunohistochemical staining. IHC ×400. (B) Expression of MCP-1 in positive cells of renal tissue. (C) Expression of TGF-β1 in positive cells of renal tissue. IHC ×400. Black arrows indicate cells exhibiting positive expression in glomeruli.
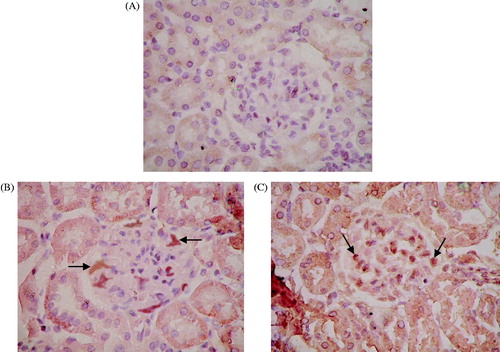
Figure 5. Percentage of positive cells showing expression of MCP-1 (A) and TGF-β1 (B) in each experimental group. Renal tissue from each experimental group was stained with the appropriate antibody, the SABC immunohistochemical kit, and DAB color reagent. The percentage of positively stained cells was counted under normal light microscopy in 20 glomeruli from each group at seven days after administration Results represent the mean ± SD of measurements from eight animals per group. Groups: SO, sham-operation; TG, Thy-1 glomerulonephritis; MC, non-transfected normal rat mesangial cell; BC, pLXSN empty vector or blank control; AM, antisense MCP-1 transfection. Panel A shows that the number of positive MCP-1 cells in the TG, MC, BC, and AM groups were significantly (p < 0.05) higher than those in the SO group. The number of positive MCP-1 cells in the AM group was significantly (p < 0.01) lower than that in the MC group, but there was no significant difference between the TG and BC groups (p > 0.05). Panel B shows that the number of positive TGF-β1 cells in the TG, MC, BC, and AM groups was significantly (p < 0.05) higher than that in the SO group, but there was no significant difference among the TG, MC, BC, and AM groups.
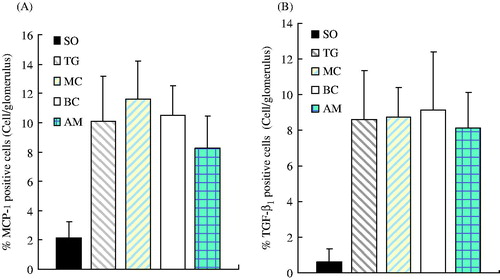
In addition, staining for TGF-β1 was mainly found in the cytoplasm, but was also observed in the nucleus. Staining of TGF-β1 was not observed in tubules of the renal cortex or glomeruli in the SO group, but positive granules were observed in epithelial cells of kidney tubules around the shallow medulla area. Significant positive staining of TGF-β1 was observed in the renal cortex and tubules of medulla in all four nephritis groups, whereas lightly stained granules were observed in the glomerulus (). Positively stained granules of TGF-β1 were shown in the renal cortex and medullary tubules in the AM group, whose area was also larger than that in the SO group. Although the staining area and intensity in AM group appeared to be weaker than those in the other three groups (TG, BC, MC), no significance was found (p > 0.05) (). Occasionally, positively stained granules of TGF-β1 were observed in the glomerulus.
mRNA expression of MCP-1, TGF-β1, and CCR2
Little mRNA expression of MCP-1 was found in the SO group, which was lower than that in the other four groups (p < 0.01) ( and ). mRNA expression of TGF-β1 was scarcely detected in the SO group, which was lower than that in the other four groups (p < 0.01). Compared with the AM group, there were significant differences in mRNA expression of TGF-β1 with the other three groups (AM versus TG, p < 0.01; AM versus MC, p < 0.01; AM versus BC, p < 0.05) ( and ).
Figure 6. mRNA expression of MCP-1 (A), TGF-β1 (B), and CCR2 (C). mRNA levels were determined by semi-quantitative RT-PCR. GAPDH was used as a loading control. Groups: SO, sham-operation; TG, Thy-1 glomerulonephritis; MC, non-transfected normal rat mesangial cell; BC, pLXSN empty vector or blank control; AM, antisense MCP-1 transfection.
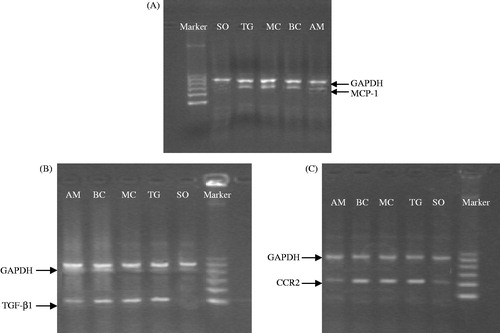
Figure 7. Comparison of mRNA expression of MCP-1, TGF-β1, and CCR2 among different groups and the correlation between mRNA levels of MCP-1 and CCR2. Panels A–C represent the alteration of mRNA expression of MCP-1, TGF-β1, and CCR2 in each experimental group, respectively. Results represent the mean ± SD of measurements from eight animals per group. All measurements in the TG, MC, BC, and AM groups were significantly (p < 0.05) higher than those at the corresponding time point in the SO group. All measurements in the TG, MC, and BC groups were significantly (p < 0.05) higher than those at the corresponding time point in the AM group. Panel D shows the correlation between mRNA expression of MCP-1 and CCR2, illustrating a parallel increase in both levels. Groups: SO, sham-operation; TG, Thy-1 glomerulonephritis; MC, non-transfected normal rat mesangial cell; BC, pLXSN empty vector or blank control; AM, antisense MCP-1 transfection.
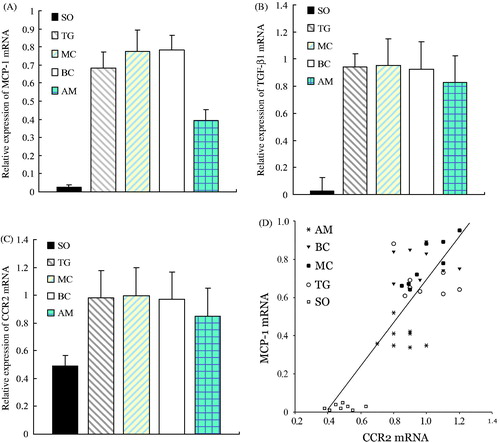
There was a small amount of CCR2 mRNA expression observed in the SO group, which was lower than that in other four groups (p < 0.01). The expression of CCR2 mRNA was lower in the AM group, which was also significantly different compared with the other three groups (AM versus TG, p < 0.05; AM versus MC, p < 0.05; AM versus BC, p < 0.05) ( and ). Correlation analysis was performed on the mRNA expression between MCP-1 and CCR2; the Pearson correlation coefficient was r = 0.830 (p < 0.01), which indicated a positive correlation of expression between the two ().
Discussion
MsPGN is characterized by proliferation of mesangial cells with increase in mesangial matrix and/or deposits in the mesangial region.Citation19,Citation20 To date, no specific anti-proliferative treatment for MsPGN has been established in humans. Therefore, development of an animal model that closely replicates effects that are observed in the clinic will provide new therapeutic options and improve the theoretical basis for clinical treatment of MsPGN to ultimately improve cure rates. In the early 1980’s, Ishizaki et al.Citation21 initially characterized a MsPGN rat model induced by rat thymus cell antibody. Presently, most MsPGN models have involved anti-Thy1.1 antibody administration, including the monoclonal antibody and anti-thymus serum methods.Citation22,Citation23 In the present study, we used the monoclonal antibody method to induce mesangial lesions in SD rats. After intravenous injection of anti-Thy1.1 antibody (200 µg/kg body weight), urinary protein began to rise on Day 1 and peaked on Day 4. The number of glomerular cells initially decreased and then increased on Day 4. HE staining showed that the number of nucleated glomerular cells decreased on the first day after anti-Thy1.1 monoclonal antibody administration. However, mesangial cell dissolution gradually decreased and the number of nucleated glomeruli increased, accompanied by proliferation of mesangial cells with an increase in mesangial matrix on Days 4–7. These pathological changes in our model rats were consistent with the results of previous studies,Citation13 which suggested that our model successfully mimicked the disease.
Chemokines constitute a family of chemoattractant cytokines and are subdivided into four families on the basis of the number and spacing of the conserved cysteine residues in the N-terminus of the protein. Chemokines play a major role in selectively recruiting monocytes, neutrophils, and lymphocytes, as well as in inducing chemotaxis through the activation of G-protein-coupled receptors. The monocyte chemoattractant protein-1 (MCP-1/CCL2) is a member of the C–C chemokine family and a potent chemotactic factor for monocytes. MCP-1 mediates its effects through its receptor CCR2 which are mainly distributed in the infiltrating lymphocytes of the kidney.Citation24–26 Induction of both MCP-1 and its receptor CCR2 and their involvement in various diseases, including nephropathy, have been demonstrated.24 It is reported that MCP-1 plays an important role in the pathology of human kidney disease and in various animal kidney injury models.Citation27–29 Our study found that the expression of MCP-1 mRNA and MCP-1 protein in rats from the TG group were both significantly higher than those in the SO group. These results indicated that MCP-1 had a close relationship with the pathological process occurring in the kidneys. Our data also demonstrated a significant positive correlation between the mRNA expression of MCP-1 and CCR2, both being detected by semi-quantitative RT-PCR (r = 0.830, p < 0.01).
In view of the importance of MCP-1 and CCR2 in the pathogenesis of glomerulonephritis, inhibition of their function may be a useful approach to slow the progress of kidney disease. Previous work30 demonstrated increased expression of MCP-1 in the kidneys in renal artery stenosis, which was associated with decreased renal blood flow and glomerular filtration rate and impaired endothelial function. These pathological responses were significantly improved after treatment with bindarit, a MCP-1 inhibitor, by markedly decreasing tubulointerstitial oxidative stress, inflammation, and fibrosis, and by improving renovascular endothelial function. Shimizu et al.31 used the strategy of anti-MCP-1 gene therapy involving the transfection of a mutant human MCP-1 gene into skeletal muscle to block the signaling pathway involving MCP-1 and its receptor (CCR2); the group demonstrated that intramuscular transfer of a mutant MCP-1 gene inhibits the MCP-1/CCR2 signaling pathway and significantly attenuates glomerulonephritis in minimal residual leukemia (MRL)/lymphoproliferation (Lpr) mice.
In our study, we injected antisense MCP-1, transfected the mesangial cells into the renal artery of rats with the neor gene in the retrovirus vector, and detected it by in situ hybridization. We found that neor gene positive cells were mainly distributed in the glomeruli and demonstrated that exogenous mesangial cells were growing in the kidneys. These results suggest that the transfection of antisense MCP-1 in our experimental rats was successful. Our research showed that 24-h urinary protein of rats on Day 7 in the AM group was markedly decreased, compared with that in the TG, MC, and BC groups (all p < 0.05). Thus, antisense MCP-1 can reduce proteinuria in MsPGN model rats. There were no statistically significant differences among the groups (p > 0.05) with respect to BUN or SCr levels, which indicated that the renal function of the rats in the five groups was not affected by transfection. Compared with the SO group, the other four groups exhibited an increase in cholesterol levels (p < 0.05). This result may be due to the loss of plasma albumin and other regulatory proteins from the urine, resulting in hypoalbuminemia and leading to metabolic disorders of cholesterol and lipoproteins. There was a significant difference in pathological changes among the five groups. Compared with the TG, MC and BC groups, the AM group had a decrease in the number of glomerular cells and the scores of glomerular lesions, which indicated antisense MCP-1 significantly reduced the extent of glomerular lesions. Compared with the TG, MC, and BC groups, the AM group had a remarkable decrease in mRNA expression of MCP-1 and CCR2, as detected by RT-PCR. Immunohistochemistry findings also showed that the AM group had a significant decrease in the protein expression of MCP-1, which indicates that antisense MCP-1 inhibits the progression of nephritis through reducing the expression of MCP-1 and CCR2. Therefore, we provided the first experimental evidence that antisense MCP-1 has a renal protective function in MsPGN rats.
It is, therefore, concluded that antisense MCP-1 can reduce mesangial cell proliferation and inhibit ECM hyperplasia. In contrast, TGF-β1 is a pro-fibrotic cytokine and an important mediator of kidney fibrosis,32,33 which is characterized by the accumulation of ECM components in glomeruli (glomerular fibrosis, glomerulosclerosis) and the tubular interstitium (tubulointerstitial fibrosis). Increased expression of TGF-β1 in mesangial cells promotes the synthesis of matrix proteins and the inhibition of matrix turnover. In our study, the expression of TGF-β1 was also detected in the five experimental groups. The levels of TGF-β1 mRNA in the nephritis groups were higher than those in the SO group. This was consistent with the results of previous studies.34 Meanwhile, we also noticed the score of glomerular lesions was lower and the extent of ECM hyperplasia dropped significantly in the AM group as compared to the other nephritis groups. However, there were no statistically significant differences in the expression of TGF-β1 protein, which was different from the results of previous studies.35 In the AM group, it is unclear why mesangial cell proliferation and accumulation of ECM were reduced, but there was no decrease observed in the expression of TGF-β1. This may be due to the mechanism of TGF-β1 as a multifunctional growth factor, having a bidirectional regulatory effect that can either inhibit or stimulate cell proliferation and growth. TGF-β1 initiates a number of changes in all responsive cells, some of which may lead to proliferation and in others to growth arrest, depending on the type, origin, and differentiation status of the cells and the experimental conditions.36 Thus, TGF-β1 may play dual roles in the renal inflammatory process. Inflammatory stimuli cause an increase in the secretion of TGF-β1, thereby promoting cell proliferation and accumulation of extracellular matrix, which is the normal process of the inflammatory response.37 If the inflammation persists, excessive secretion of TGF-β1 may reduce the inflammatory response by inhibiting the production of a variety of proinflammatory cytokines and chemokines.38–40
In conclusion, the present study demonstrated that: (1) antisense MCP-1 can inhibit the expression of MCP-1, but cannot reduce the expression of TGF-β1, which may be due to the bidirectional regulatory effect of TGF-β1; and (2) antisense MCP-1 suppressed mesangial cell proliferation and mesangial matrix accumulation in anti-Thy1 MsPGN model rats, which did not entirely depend on the role of TGF-β1 and may involve other mechanisms. Therefore, our data indicate that antisense MCP-1 may be a potent therapeutic target for the treatment of MsPGN. Despite reaching the stated goals of the study, there were some limitations. For example, only a small number of cells expressing antisense to MCP-1 were observed in the glomeruli. It is possible that MCP-1 activation of mesangial cells leads to secretion of a soluble factor that in turn acts on the surrounding cells in the glomeruli. Further study is required to assess this possibility. In addition, other methods, such as the use of Western blots, should be used to explain the discrepancy in the expression levels of MCP-1, TGF-β1, and CCR2 to support the conclusions.
Declaration of interest
The authors report no conflicts of interest. The authors alone are responsible for the content and writing of the paper.
This work was supported by the National Natural Science Foundation of China (39970776).
Related Research Data
References
- Li LS, Liu ZH. Epidemiologic data of renal diseases from a single unit in China: analysis based on 13,519 renal biopsies. Kidney Int. 2004;66(3):920–923
- Cove-Smith A, Hendry BM. The regulation of mesangial cell proliferation. Nephron Exp Nephrol. 2008;108(4):e74–e79
- Iyoda M, Shibata T, Kawaguchi M, et al. IL-17A and IL-17F stimulate chemokines via MAPK pathways (ERK1/2 and p38 but not JNK) in mouse cultured mesangial cells: synergy with TNF-alpha and IL-1beta. Am J Physiol. 2010;298(3):F779–F787
- Hisada Y, Sakurai H, Sugaya T. Cell to cell interaction between mesangial cells and macrophages induces the expression of monocyte chemoattractant protein-1 through nuclear factor-kappa B activation. Biochem Biophys Res Commun. 2000;269(2):309–316
- Janssen U, Sowa E, Marchand P, Floege J, Phillips AO, Radeke HH. Differential expression of MCP-1 and its receptor CCR2 in glucose primed human mesangial cells. Nephron. 2002;92(4):797–806
- Sharma K, Ziyadex FN. Hyperglycaemia and diabetic kidney disease: the case for transforming growth factor-β1 as a key mediator. Diabetes. 1995;44:1139–1146
- Ban CR, Twigg SM. Fibrosis in diabetes complications: pathogenic mechanisms and circulating and urinary markers. Vasc Health Risk Manag. 2008;4(3):575–596
- Chen S, Jim B, Ziyadeh FN. Diabetic nephropathy and transforming growth factor-beta: transforming our view of glomerulosclerosis and fibrosis build-up. Semin Nephrol. 2003;23(6):532–543
- Yevdokimova N, Wahab NA, Mason RM. Thrombospondin-1 is the key activator of TGF-β1 in human mesangial cells exposed to high glucose. J Am Soc Nephrol. 2001;12(4):703–712
- Poncelet AC, Schnaper HW, Tan R, Liu Y, Runyan CE. Cell phenotype-specific down-regulation of Smad3 involves decreased gene activation as well as protein degradation. J Biol Chem. 2007;282(21):15534–15540
- Cristovam PC, Carmona AK, Arnoni CP, Maquigussa E, Pereira LG, Boim MA. Role of chymase indiabetic nephropathy. Exp Biol Med (Maywood). 2012;237(8):985–992
- Ketteler M, Westenfeld R, Gawlik A, de Heer E, Distler A. Acute glomerular upregulation of ornithine decarboxylase is not essential for mesangial cell proliferation and matrix expansion in anti-Thy-1-nephritis. Nephrol Dial Transplant. 2000;15(1):16–22
- Jefferson JA, Johnson RJ. Experimental mesangial proliferative glomerulonephritis (the anti-Thy-1.1 model). J Nephrol. 1999;12:297–307
- Ausubel F, Brent R, Kingston RE. Short Protocols in Molecular Biology. Beijing: Science Press; 1998
- World Medical Association, American Physiological Society. Guiding principles for research involving animals and human beings. Am J Physiol. 2002;283(2):R281–R283
- , Working Group of the International IgA ephropathy Network and the Renal Pathology SocietyRoberts IS, Cook HT, et al. The Oxford classification of IgA nephropathy: pathology definitions, correlations, and reproducibility. Kidney Int. 2009;76(5):546–556
- , Working Group of the International IgA Nephropathy Network and the Renal Pathology SocietyCattran DC, Coppo R, Cook HT, et al. The Oxford classification of IgA nephropathy: rationale clinicopathological correlations, and classification. Kidney Int. 2009;76(5):534–545
- Feehally J, Barratt J, Coppo R, et al. International IgA nephropathy network clinico-pathological classification of IgA nephropathy. Contrib Nephrol. 2007;157:13–18
- D'Amico G. Influence of clinical and histological features on actuarial renal survival in adult patients with idiopathic IgA nephropathy, membranous nephropathy, and membranoproliferative glomerulonephritis: survey of the recent literature. Am J Kidney Dis. 1992;20(4):315–323
- Woo KT, Chan CM, Mooi CY, et al. The changing pattern of primary glomerulonephritis in Singapore and other countries over the past 3 decades. Clin Nephrol. 2010;74(5):372–383
- Ishizaki M, Sato S, Sano J, et al. The presence of Thy 1.1 antigen in rat glomerular mesangial cells. Biomed Res. 1980;1:438–442
- Hohenstein B, Daniel C, Wittmann S, Hugo C. PDE-5 inhibition impedes TSP-1 expression, TGF-beta activation and matrix accumulation in experimental glomerulonephritis. Nephrol Dial Transplant. 2008;23(11):3427–3436
- Panzer U, Steinmetz OM, Turner JE, et al. Resolution of renal inflammation: a new role for NF-kappa B1 (p50) in inflammatory kidney diseases. Am J Physiol. 2009;297(2): F429–F439
- Deshmane SL, Kremlev S, Amini S, Sawaya BE. Monocyte chemoattractant protein-1 (MCP-1): an overview. J Interferon Cytokine Res. 2009;29(6):313–326
- Segerer S, Cui Y, Hudkins KL, et al. Expression of the chemokine monocyte chemoattractant protein-1 and its receptor chemokine receptor 2 in human crescentic glomerulonephritis. J Am Soc Nephrol. 2000;11(12):2231–2242
- Vielhauer V, Anders HJ, Mack M, et al. Obstructive nephropathy in the mouse: progressive fibrosis correlates with tubulointerstitial chemokine expression and accumulation of CC chemokine receptor 2- and 5-positive leukocytes. J Am Soc Nephrol. 2001;12(6):1173–1187
- Paul LC, Rennke HG, Milford EL, Carpenter CB. Thy-1.1 in glomeruli of rat kidneys. Kidney Int. 1984;25:771–777
- Rennke HG, Anderson S, Brenner BM. The progression of renal disease: structural, and functional correlations. In: Tisher CC, Brenner BM, eds. Renal Pathology. Philadelphia, PA: Lippincott; 1994:116
- Karihaloo A, Koraishy F, Huen SC, et al. Macrophages promote cyst growth in polycystic kidney disease. J Am Soc Nephrol. 2011;22(10):1809–1814
- Zhu XY, Chade AR, Krier JD, et al. The chemokine monocyte chemoattractant protein-1 contributes to renal dysfunction in swine renovascular hypertension. J Hypertens. 2009;27(10):2063–2073
- Shimizu S, Nakashima H, Masutani K, et al. Anti-monocyte chemoattractant protein-1 gene therapy attenuates nephritis in MRL/lpr mice. Rheumatology (Oxford). 2004;43(9):1121–1128
- Brujin JA, Roos A, de Geus B, de Heer E. Transforming growth factor-β and the glomerular extracellular matrix in renal pathology. J Lab Clin Med. 1994;123:34–47
- Border WA, Noble NA. TGF-beta in kidney fibrosis: a target for gene therapy. Kidney Int. 1997;51:1388–1396
- Kashiwagi M, Shinozaki M, Hirakata H, et al. Locally activated rennin–angiotensin system associated with TGF-beta1 as a major factor for renal injury induced by chronic inhibition of nitric oxide synthase in rats. J Am Soc Nephrol. 2000;11(4):616–624
- Border WA, Okuda S, Languino LR, et al. Suppression of experimental glomerulonephritis by antiserum against transforming growth factor beta 1. Nature. 1990;346(6282):371–374
- Nilsen-Hamilton M. Transforming growth factor-beta and its action on cellular growth and differentiation. Curr Top Dev Biol. 1990;24:95–136
- Lawrance IC, Maxwell L, Doe W. Inflammation location, but not type, determines the increase in TGF-beta1 and IGF-1 expression and collagen deposition in IBD intestine. Inflamm Bowel Dis. 2001;7(1):16–26
- Huang XR, Chung AC, Zhou L, Wang XJ, Lan HY. Latent TGF-beta1 protects against crescentic glomerulonephritis. J Am Soc Nephrol. 2008;19(2):233–242
- Qian L, Wei SJ, Zhang D, et al. Potent anti-inflammatory and neuroprotective effects of TGF-beta1 are mediated through the inhibition of ERK and p47phox-Ser345 phosphorylation and translocation in microglia. J Immunol. 2008;181(1):660–668
- Dai C, Wen X, He W, Liu Y. Inhibition of proinflammatory RANTES expression by TGF-beta1 is mediated by glycogen synthase kinase-3beta-dependent beta-catenin signaling. J Biol Chem. 2011;286(9):7052–7059