
Abstract
Objective: To determine functional and structural alterations of peritoneum and fibrotic cytokines expression in peritoneal dialysis (PD) rats. Methods: 28 Sprague–Dawley (S-D) rats were randomly divided into four groups and dialyzed with various solutions daily for four weeks: (1) no solution (CON group), (2) 0.9% Saline solution (NS group), (3) 1.5% Dianeal (LG group), (4) 4.25% Dianeal (HG group). Peritoneal equilibration tests, ultrafiltration function and effluent protein quantification were measured. Peritoneum morphology was studied and immunohistochemistry were performed for detection of transforming growth factor β1 (TGF-β1), connective tissue growth factor (CTGF), and fibronectin (FN) proteins. Reverse transcriptional-polymerase chain reaction was used to analyze the expression of TGF-β1, CTGF mRNA. Results: Administration of 4.25% Dianeal caused functional and structural changes of peritoneum, including protein loss through the transport process, decrease of peritoneal solute transport rate and ultrafiltration capacity. The collagen of peritoneum in the HG group was thicker than the other groups. The levels of CTGF, TGF-β1, and FN proteins were significantly the highest in the HG group, followed by the LG group. The liner correlation analysis showed positive correlations between the levels of CTGF, TGF-β1, and FN proteins and the collagen thickness. The expression of TGF-β1 and CTGF mRNA in the HG group were significantly higher than those in the other groups and were indicated positive correlation. Conclusion: Using high glucose peritoneal dialysis solutions in rats may not only lead to processing of peritoneal fibrosis, which is promoted by ectopic expression of TGF-β1, but also increase the expression of CTGF. CTGF is an important fibrotic media of peritoneal fibrosis in PD rats.
Introduction
Peritoneal dialysis (PD) is an alternative treatment of patients with end-stage renal disease but limited by progressive changes in the peritoneal membrane. The long-term exposure to traditional non-physiological PD solutions and repeated episodes of peritonitis cause injury of the peritoneum, which progressively becomes loss or degeneration of the mesothelial cells and undergoes fibrosis and angiogenesis.Citation1–4 These changes in the peritoneal membrane are considered the major cause of ultrafiltration dysfunction and loss of dialysis efficacy.Citation2–5
There is accumulating evidence that overexpression of transforming growth factor β1 (TGF-β1) plays a key role in the observed long-term changes in peritoneal functionCitation6–9 and is correlated with worse PD outcomes.Citation9,Citation10 Experiments showed that inhibition of TGF-β1 bioactivity can attenuate extracellular matrix (ECM) deposition and the progression of tissue fibrosis in different experimental models.Citation11–13 Nevertheless, TGF-β1 plays a complicated and controversial role in an immune regulation due to its highly pleiotropic properties and the presence of TGF-β1 receptors on most cell types. As one of the key negative regulators of immune homeostasis, the absence of TGF-β1 leads to activation of a self-targeted immune response, raising concern about the long-term consequence of its suppression.Citation14,Citation15
Connective tissue growth factor (CTGF) is a newly identified growth factor which belongs to the CCN gene family.Citation16,Citation17 It is a potent profibrotic factor that act as a crucial downstream mediator of the profibrotic effects of TGF-β1 on ECM regulation. In contrast to the pleiotropic effects of TGF-β1, CTGF only mediates the profibrotic effects of TGF-β1, and the anti-inflammatory and anti-proliferative effects of TGF-β1 are not mediated by CTGF.Citation18 Recent report has shown the expression of CTGF by HPMC and its presence in the peritoneal cavity of PD patients. The marked increase in CTGF levels by TGF-β1 suggests its involvement in the development of peritoneal fibrosis over long-time PD.Citation19,Citation20
The research on CTGF expression in peritoneal fibrosis is limited to vitro cells at present. The aim of this study was to determine the functional and structural alterations of the peritoneal membrane in long-term PD model of rats and fibrotic cytokines and to explore the role of CTGF in peritoneal fibrosis.
Materials and methods
Animals and establishment of PD rat model
Twenty-eight adult specified pathogen-free male Sprague–Dawley (S-D) rats weighing 180–240 g were placed in cages with free access to water and food, at a temperature of 18 °C–22 °C, controlled lighting, with light/dark cycle of 12 h. They were evaluated daily and weighed. All animal procedures complied with published recommendations for use of laboratory animals by the government. The animals were randomly divided into (1) control group (no solution, n = 7), (2) 0.9% Saline solution (NS group, n = 7), (3) 1.5% Dianeal solution with a glucose concentration of 1.5% (Baxter) (LG group, n = 7), (4) 4.25% Dianeal solution with a glucose concentration of 4.25% (Baxter) (HG group, n = 7). They were subjected daily to abdominal puncture with 20 mL various solution infusion into the left lower quadrant for 28 days.
All rats were treated with intraperitoneal injection of 20 mL 4.25% Dianeal on day 29. Four hours later, they were anesthetized with pentobarbital sodium at a dose of 0.3 mL/100 g, at the same time the dialysis effluent was carefully collected through a venous indwelling needle with sided holes which punctured into the right lower abdomen. The volume of the drainage effluent was recorded respectively. The abdominal cavity was opened through the ventral white line; gauze was used to absorb the residual liquid in the abdominal cavity and weighed. Then a needle was pierced into the heart to collect 6–8 mL blood. The drainage solution and a part of parietal peritoneum were stored in a refrigerator; the left peritoneum was fixed in 10% buffered formalin solution for histological analysis. Later the count of leukocyte, the creatinine concentration, the glucose concentration and the protein quantities per dialysis effluent sample, as well as the concentration of creatinine of blood were measured (Hitachi 7060 Automatic Biochemical Analyzer, Sysmex SF 3000 blood analyzer, Japan). Dialysate-to-plasma ratios (D/P cr) for creatinine at 4 h and the ratio of glucose at 4 h to the dialysate glucose concentration at time zero (D/D0 glucose) were both calculated. Ultrafiltration volume was calculated using the formula: (weight of gauze absorbing the residual liquid-weight of gauze) × 1 mL/mg + drainage volume −20 mL.
Peritoneum morphologic studies
Dissected peritoneum fixed for 24 h in 10% saline formalin were gradually dehydrated using serial ethanol concentrations 90%, 95%, and 100%. Dehydrated peritoneum were cleared two times using xylene (20 min each). Infiltration was performed by exposing peritoneum to wax two times for 90 min each. Paraffin sections (4 μm thick) were prepared using rotary microtome (LEICA, Wetzlar, Germany). Sections were attached to clean slides using egg albumin. Standard hematoxylin--eosin and Van Gieson procedure were used to stain peritoneum sections for histological examination.
Hematoxylin--eosin staining was performed as follows: Deparaffinize sections were cleared 2 changes of xylene, 10 min each, then rehydrated in 2 changes of absolute alcohol, 95% and 70% alcohol for 5 min each, and washed briefly in distilled water. Peritoneum was stained in Harris hematoxylin solution for 8 min, and washed in running tap water for 5 min; then differentiated in 1% acid alcohol for 30 s, and washed in running tap water for 1 min. Stain blue in 0.2% ammonia water for 30 s to 1 min. Wash in running tap water for 5 min. Rinse in 95% alcohol, 10 dips. Counterstain in eosin-phloxine B solution (or eosin Y solution) for 30 s to 1 min. Dehydrate through 95% alcohol, 2 changes of absolute alcohol, and 5 min each. Clear in 2 changes of xylene, 5 min each. Mount with xylene-based mounting medium.
Van Gieson staining was performed as follows: Deparaffinize and hydrate to distilled water. Stain nuclei with Weigert’s Working Hematoxylin for 10–20 min. Wash in distilled water. Stain 1–3 min in Van Gieson’s Solution. Dehydrate rapidly in 95% alcohol, absolute alcohol, two changes each, clear and mount. Finally, slides were examined under the light microscope (Olympus, Tokyo, Japan), and the images were analyzed using a MIAS medical image analysis system. The thickness of the peritoneum was measured. Weigert’s Working Solution is prepared by mixing equal parts of Weigert’s Iron Hematoxylin A (hematoxylin 1 g dissolve in absolute alcohol 100 mL before one month) and Weigert’s Iron Hematoxylin B (30% ferric chloride 4 mL, distilled water 95 mL and hydrochloric acid 1 mL mix well). Van Gieson’s Solution is prepared by mixing 1.22% picric acid 9 mL and 1% acid fuchsin. Peritoneal collagen thickness was measured.
Tissue immunohistochemistry staining
Immunohistochemistry was performed on peritoneum for detection of TGF-β1, CTGF, and fibronectin (FN) expression (the above primary antibodies were bought from Santa Cruz, R&D and Santa Cruz, respectively). Paraffin sections of peritoneum were subjected to xylene (20 min), followed by decreasing ethanol concentrations 100%, 95%, and 70% (20 min each), and then distilled water. Sections were dried and exposed to bacterial gram stain using standard protocol. Briefly, sections were stained using crystal violet (2 min), followed by Gram's iodine (1 min) and then decolorized using acetone (few seconds). Safranin was applied as a counterstain (2 min) before washing with water. Finally, slides were dried and examined under the light microscope (Olympus, Japan).
RT-PCR analysis
Taking weight of about 100 mg of peritoneal tissue to extract RNA enzymes, total RNA (1 μg per sample) was isolated using TRIzol (Invitrogen, Carlsbad, CA). and cDNA was synthesized with 5 mg total RNA in a reaction volume of 25 μL containing 0.5 μL oligonucleotide (dT); 20 mM dNTPs; 0.5 μL RNasin; 0.1 M DTT; 5 μL buffer; and 1 μL M-MLV reverse transcriptase (Gibco BRL, Gaithersburg, MD). The final RT product mix of 1 μL was then amplified with PCR. Specific oligonucleotide primers were designed from the published genomic sequences (Gene Bank, National Center for Biotechnology Information (NCBI), USA). The PCR primers were as follows:
The PCR conditions were 95 °C for 5 min to activate the polymerase and each cycle consisted of 30 s at 95 °C, 30 s at 56 °C and 50 s at 72 °C (total 21 cycles), followed by the extension at 72 °C for 10 min. Control reactions were carried out in parallel using non-reversed transcribed RNA, and on reaction mixtures in which target RNA was omitted. Amplification products were resolved by electrophoresis on a 6% PAGE, and their optical densities were scanned using computer processed image with the absorbance value of β-actin product serving as the control.
Statistics
Statistical analysis was performed using SPSS13.0 software. Descriptive statistics are presented as means and standard deviation (mean ± SD). One-way analysis of variance and t-test were used to compare the difference among groups and p Value less than 0.05 was considered significant.
Results
Alternation of peritoneal function in PD rats
After administration of PD for 4 weeks, the WBC Counts of PD effluents were tested for all groups and were all less than 1000 cells/mm3, indicating no occurrence of peritonitis (p > 0.05). Then peritoneal equilibration tests, ultrafiltration function (UF) and effluent protein quantification were performed. The results showed that D/D0 glucose ratio (p < 0.05) decreased, D/P cr (p < 0.05) increased, and net ultrafiltration was significantly impaired (p < 0.05). In addition, lower protein level in PD effluents was detected in the HG group, which indicated that PD solutions containing high glucose could alter the functional characteristics of the peritoneum ( and ).
Figure 1. Alternation of peritoneal function in peritoneal dialysis rats. (A) WBC Count of peritoneal dialysis effluents. (B) The ultrafiltration volume. (C) Peritoneal equilibration tests. (D) Protein loss of groups. Data presented as mean ± SD. *Denotes p < 0.05 versus the control group. #Denotes p < 0.05 versus the NS group. &Denotes p < 0.05 versus the LG group.
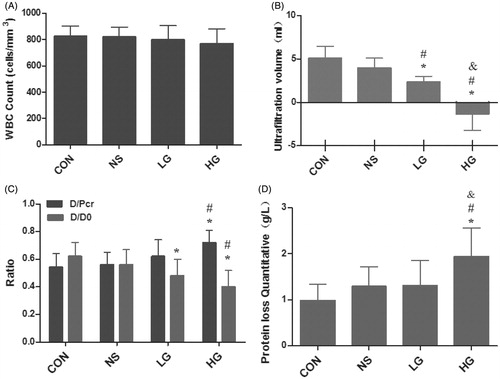
Table 1. Alternation of peritoneal function in PD rats.
A – WBC Count of PD effluents. B – The ultrafiltration volume. C – Peritoneal equilibration tests. D – Protein loss of groups. Data presented as mean ± SD. *Denotes p < 0.05 versus the control group. #Denotes p < 0.05 versus the NS group. &Denotes p < 0.05 versus the LG group.
Pathological variation of peritoneal tissues in PD rats
Four weeks after PD, pathological changes of peritonea were observed by using hematoxylin--eosin and Van Gieson staining, and meantime peritoneal collagen thickness was measured. In the control group, the peritoneal tissues had smooth surface, the visible flat mesothelial monolayer cells covered loose connective tissues, containing a small amount of vessels, and no obvious fibrous tissues were observed. Peritoneal tissues of the NS group were mildly thickened, with a smooth surface; mesothelial cells were monolayer and flat; the number of fibrous tissues increased slightly, with a small amount of new vessels. While in the LG group, peritoneal mesothelial cells were swelling, shedding, and moderately thickened, with moderate deposition of collagen fibrous tissues. Angiogenesis and inflammatory cell infiltration were observed. The peritonea of the HG group were markedly thickened, with rough surface, and mesothelial cells were swelling and lost. There was extensive angiogenesis and collagen deposition under mesothelial cells, along with visible mononuclear cell infiltration of inflammatory cells. The collagen of peritoneum was also thicker than the other groups ( and , and ).
Figure 2. Pathological variation of peritoneal tissue in PD rats (HE staining and VG staining, ×400).
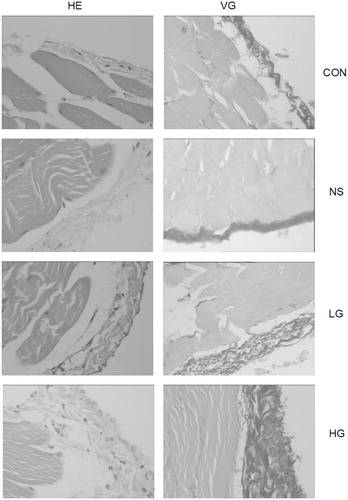
Figure 3. Collagen thickness of peritoneal tissue. Data presented as mean ± SD. *Denotes p < 0.05 versus the control group. #Denotes p < 0.05 versus the NS group. &Denotes p < 0.05 versus the LG group.
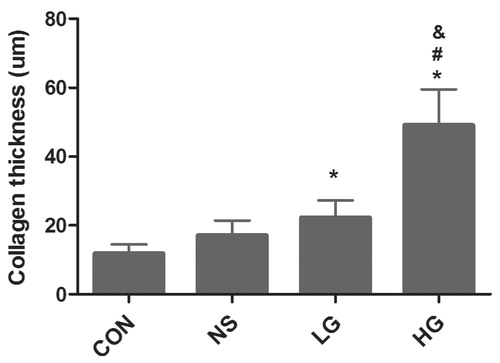
Table 2. Collagen thickness of peritoneal tissue (VG, ×400).
Data presented as mean ± SD. *Denotes p < 0.05 versus the control group.
#Denotes p < 0.05 versus the NS group. &Denotes p < 0.05 versus the LG group.
The levels of CTGF, TGF-β1, FN proteins of peritoneal tissue in PD rats
TGF-β1 and CTGF were mainly expressed in the cytoplasm, but slightly or not expressed in the mesothelial cells of the control group. There was a small quantity of expression in the NS group. In the LG group, TGF-β1 and CTGF expressions were found in most of mesothelial cells and leukocytes. The HG group showed notable diffuse proliferation of mesothelial cells and infiltration of leukocytes, which is the most prominent group. FN is expressed mostly in mesenchyma cells, but also can be detected in vascular endothelial and mesothelial cells. The HG group is significantly the highest (). The levels of CTGF, TGF-β1, and FN proteins were significantly the highest in the HG group, followed by the LG group (). The linear correlation analysis indicated positive correlations between the levels of CTGF, TGF-β1, and FN proteins and the collagen thickness, with correlation coefficients of 0.741 (r = 0.734, p = 0.000), 0.734 (r = 0.727, p = 0.000), and 0.727 (r = 0.741, p = 0.000), respectively ().
Figure 4. The expression of CTGF, TGF-β1, and FN proteins of peritoneal tissue by Immunohistochemical methods (×400).
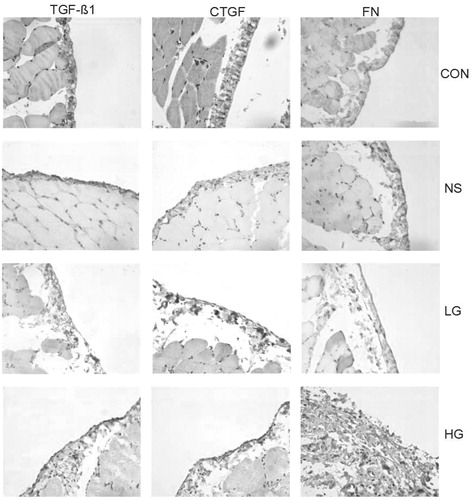
Figure 5. The quantitative of CTGF, TGF-β1, and FN proteins by Immunohistochemical methods. (A) The levels of CTGF, TGF-β1, and FN proteins. (B--D) The liner correlation analysis between the levels of CTGF, TGF-β1, and FN proteins and the collagen thickness. The correlation coefficients were 0.741 (r = 0.734, p = 0.000), 0.734 (r = 0.727, p = 0.000), and 0.727(r = 0.741, p = 0.000), respectively. Data presented as mean ± SD. *Denotes p < 0.05 versus the control group. #Denotes p < 0.05 versus the NS group. &Denotes p < 0.05 versus the LG group.
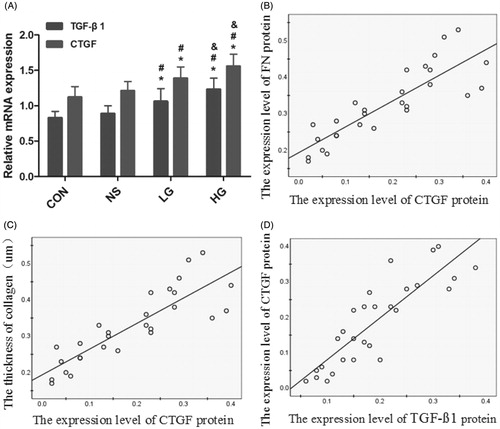
Table 3. The quantitative of CTGF, TGF-β1, and FN proteins by Immunohistochemical methods.
#Denotes p < 0.05 versus the NS group. & Denotes p < 0.05 versus the LG group.
A – The levels of CTGF, TGF-β1, and FN proteins. B, C, D – The linear correlation analysis between the levels of CTGF, TGF-β1, and FN proteins and the collagen thickness. The correlation coefficients were 0.741 (r = 0.734, p = 0.000), 0.734 (r = 0.727, p = 0.000), and 0.727 (r = 0.741, p = 0.000), respectively. Data presented as mean ± SD. *Denotes p < 0.05 versus the control group. # Denotes p < 0.05 versus the NS group. & Denotes p < 0.05 versus the LG group.
Analysis of the TGF-β1 mRNA, CTGF mRNA expression in peritoneal tissue by RT-PCR
The semi-quantitative results showed that the levels of TGF-β1 and CTGF mRNA in the HG group were significantly higher than those in the other groups. The levels of CTGF and TGF-β1 mRNA in the LG group were significantly higher than those in the NS group and the control group, and p < 0.05. The linear correlation analysis indicated positive correlations between the levels of TGF-β1 mRNA and CTGF mRNA, with correlation coefficient of 0.69 ( and ).
Figure 6. Analysis of the TGF-β1mRNA, CTGF mRNA expression in peritoneal tissue by RT-PCR. (A--C) The image of mRNA by RT-PCR. (D) The semi-quantitative results of TGF-β1, CTGF mRNA expression. (E) The liner correlation analysis of expression level of TGF-β1 mRNA and CTGF mRNA, the Correlation coefficients was 0.78 (r = 0.69, p = 0.000). Data presented as mean ± SD.*Denotes p < 0.05 versus the control group. #Denotes p < 0.05 versus the NS group. &Denotes p < 0.05 versus the LG group.
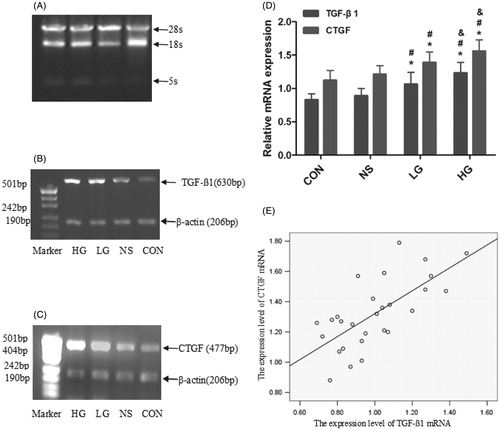
Table 4. TGF-β1mRNA and CTGF mRNA expression in peritoneal tissue by RT-PCR.
A, B, C – The image of mRNA by RT-PCR. D – The semi-quantitative results of TGF-β1, CTGF mRNA expression. E – The linear correlation analysis of expression level of TGF-β1 mRNA and CTGF mRNA, the correlation coefficients was 0.78 (r = 0.69, p = 0.000). Data presented as mean ± SD. *Denotes p < 0.05 versus the control group. #Denotes p < 0.05 versus the NS group. &Denotes p < 0.05 versus the LG group.
Discussion
Peritoneal fibrosis is a major complication in patients with chronic renal failure treated with continuous ambulatory peritoneal dialysis (CAPD). Long-term exposure to hyperosmotic, hyperglycemic, and low-pH dialysis solutions and repeated episodes of peritonitis or hemoperitoneum can cause injury to the peritoneum, which will progress into denuded MCs, fibrosis and neovascularization.Citation1–4 Such structural alterations are considered as the major cause of ultrafiltration failure.Citation2–5 In this study, hyperglycemic dialysis solutions were observed to dramatically affect the functions of peritoneal tissues, such as protein loss through the transport, decrease of peritoneal solute transport rate, and decrease in ultrafiltration capacity. The morphologic studies of the peritoneum by using hematoxylin--eosin and Van Gieson staining presented the structural changes of peritoneum after 4-week exposure to hyperglycemic solutions. The peritonea of the HG group were markedly thickened, with rough surface, and swelling and loss of mesothelial cells. There was extensive angiogenesis and collagen deposition under mesothelial cells, along with visible infiltration of mononuclear inflammatory cells. The peritoneal collagen was also thicker than the other groups.
The establishment of peritoneal fibrosis suggests that peritoneal mesothelial cells produce TGF-β1 after stimulation with high concentrations of glucose, bacterial lipopolysaccharide, PD solute and many other stimuli.Citation21 TGF-β1 appears to be the most important molecule in the fibrotic process in CAPD, and downregulation of TGF-β1 turns out to be effective in preventing or delaying peritoneal fibrosis in vivo and in vitro.Citation22–24
However, total suppression of TGF-β1 will cause serious side-effects because it also acts as a pivotal modulator in immunologic defense and many other aspects. Connective tissue growth factor belongs to the CCN gene family of secreted ECM-associated proteins that are involved in the complex processes of angiogenesis and fibrosis. The CTGF promoter contains a TGF-β responsive element,Citation25 and the CTGF molecule can positively modulate the interaction of TGFβ-1 with its cognate receptor.Citation18 In contrast to the pleiotropic effects of TGF-β1, CTGF specifically targets the fibrotic pathway, and the anti-inflammatory and anti-proliferative effects of TGF-β1 are not mediated by CTGF. For this reason, it may be a more specific target for angiofibrotic therapy.
In the present study, we found hyperglycemic PD solutions may promote the secretion of fibrotic cytokines. TGF-β1, CTGF mRNA, and proteins were low in peritoneal tissues under non-stimulated conditions, but rose to high levels with stimulation by high glucose. And up-regulated CTGF expression was positively correlated with the peritoneal thickness in dialysis groups. This result agrees with other reports and suggests that CTGF, as well as TGF-β1, is involved in the fibrosis of peritoneal tissues under the exposure to high glucose. These findings indicate that CTGF is likely to be an attractive candidate for inhibiting damage to peritonea. Down-regulation of CTGF expression could be a therapeutic target of peritoneal fibrosis and membrane failure.
Declaration of interest
There is no conflict of interest.
References
- Davies SJ, Bryan J, Phillips L, et al. Longitudinal changes in peritoneal kinetics: the effects of peritoneal dialysis and peritonitis. Nephrol Dial Transplant. 1996;11(3):498–506
- Williams JD, Craig KJ, Topley N, et al. Morphologic changes in the peritoneal membrane of patients with renal disease. J Am Soc Nephrol. 2002;13(2):470–479
- Mateijsen MA, Van Der Wal AC, Hendriks PM, et al. Vascular and interstitial changes in the peritoneum of CAPD patients with peritoneal sclerosis. Perit Dial Int. 1999;19(6):517–525
- Aroeira LS, Aguilera A, Sanchez-Tomero JA, et al. Epithelial to mesenchymal transition and peritoneal membrane failure in peritoneal dialysis patients: pathologic significance and potential therapeutic interventions. J Am Soc Nephrol. 2007;18(7):2004–2013
- Plum J, Hermann S, Fussholler A, et al. Peritoneal sclerosis in peritoneal dialysis patients related to dialysis settings and peritoneal transport properties. Kidney Int Suppl. 2001;78:S42–S47
- Yao Q, Pawlaczyk K, Ayala ER, et al. The role of the TGF/Smad signaling pathway in peritoneal fibrosis induced by peritoneal dialysis solutions. Nephron Exp Nephrol. 2008;109(2):e71–e78
- Yung S, Liu ZH, Lai KN, et al. Emodin ameliorates glucose-induced morphologic abnormalities and synthesis of transforming growth factor beta1 and fibronectin by human peritoneal mesothelial cells. Perit Dial Int. 2001;21(Suppl 3):S41–S47
- Beavis MJ, Williams JD, Hoppe J, et al. Human peritoneal fibroblast proliferation in 3-dimensional culture: modulation by cytokines, growth factors and peritoneal dialysis effluent. Kidney Int. 1997;51(1):205–215
- Yao Q, Pawlaczyk K, Ayala ER, et al. The role of the TGF/Smad signaling pathway in peritoneal fibrosis induced by peritoneal dialysis solutions. Nephron Exp Nephrol. 2008;109(2):e71–e78
- Gangji AS, Brimble KS, Margetts PJ. Association between markers of inflammation, fibrosis and hypervolemia in peritoneal dialysis patients. Blood Purif. 2009;28(4):354–358
- Imai H, Nakamoto H, Fucshima R, et al. Glucocorticoid protects against the development of encapsulating peritoneal sclerosis on peritoneal dialysis. Adv Perit Dial. 2002;18:124–130
- Hung KY, Chen CT, Huang JW, et al. Dipyridamole inhibits TGF-beta-induced collagen gene expression in human peritoneal mesothelial cells. Kidney Int. 2001;60(4):1249–1257
- Zhu F, Li T, Qiu F, et al. Preventive effect of Notch signaling inhibition by a gamma-secretase inhibitor on peritoneal dialysis fluid-induced peritoneal fibrosis in rats. Am J Pathol. 2010;176(2):650–659
- Border WA, Noble NA. TGF-beta in kidney fibrosis: a target for gene therapy. Kidney Int. 1997;51(5):1388–1396
- Gorelik L, Flavell RA. Abrogation of TGFbeta signaling in T cells leads to spontaneous T cell differentiation and autoimmune disease. Immunity. 2000;12(2):171–181
- Lee HB, Yu MR, Song JS, et al. Reactive oxygen species amplify protein kinase C signaling in high glucose-induced fibronectin expression by human peritoneal mesothelial cells. Kidney Int. 2004;65(4):1170–1179
- Brigstock DR. The connective tissue growth factor/cysteine-rich 61/nephroblastoma overexpressed (CCN) family. Endocr Rev. 1999;20(2):189–206
- Abreu JG, Ketpura NI, Reversade B, et al. Connective-tissue growth factor (CTGF) modulates cell signalling by BMP and TGF-beta. Nat Cell Biol. 2002;4(8):599–604
- Zarrinkalam KH, Stanley JM, Gray J, et al. Connective tissue growth factor and its regulation in the peritoneal cavity of peritoneal dialysis patients. Kidney Int. 2003;64(1):331–338
- Mizutani M, Ito Y, Mizuno M, et al. Connective tissue growth factor (CTGF/CCN2) is increased in peritoneal dialysis patients with high peritoneal solute transport rate. Am J Physiol Renal Physiol. 2010;298(3):F721–F733
- Kothapalli D, Grotendorst GR. CTGF modulates cell cycle progression in cAMP-arrested NRK fibroblasts. J Cell Physiol. 2000;182(1):119–126
- Loureiro J, Aguilera A, Selgas R, et al. Blocking TGF-beta1 protects the peritoneal membrane from dialysate-induced damage. J Am Soc Nephrol. 2011;22(9):1682–1695
- Liu FY, Ling GH, Liu H, et al. Inhibiting effect of short hairpin RNA on expression of transforming growth factor-beta1 in human peritoneal mesothelial cells induced by peritoneal dialysis solution. Chin Med J (Engl). 2005;118(18):1552–1556
- Imai H, Nakamoto H, Fucshima R, et al. Glucocorticoid protects against the development of encapsulating peritoneal sclerosis on peritoneal dialysis. Adv Perit Dial. 2002;18:124–130
- Holmes A, Abraham DJ, Sa S, et al. CTGF and SMADs, maintenance of scleroderma phenotype is independent of SMAD signaling. J Biol Chem. 2001;276(14):10594–10601