
Abstract
Background: Treatment of uremia is now dominated by dialysis; in some cases, patients are treated with dialysis for decades, but overall outcomes are disappointing. A number of studies have confirmed the relevance of several experimental insights to the pathogenesis of uremia, but the specific biomarkers of uremia have not been fully elucidated. To date, our knowledge about the alterations in DNA 5-hydroxymethylcytosine (5-hmC) in uremia is unclear, to investigate the role of DNA 5-hmC in the onset of uremia, we performed hMeDIP-chip between the uremia patients and the normal controls from the experiment to identify differentially expressed 5-hmC in uremia-associated samples. Methods: Extract genomic DNA, using hMeDIP-chip technology of Active Motif companies for the analysis of genome-wide DNA 5-hmC, and quantitative real-time PCR confirmation to identify differentially expressed 5-hmC level in uremia-associated samples. Results: There were 1875 genes in gene Promoter, which displayed significant 5-hmC differences in uremia patients compared with normal controls. Among these genes, 960 genes displayed increased 5-hmC and 915 genes decreased 5-hmC. 4063 genes in CpG Islands displayed significant 5-hmC differences in uremia patients compared with normal controls. Among these genes, 1780 genes displayed increased 5-hmC and 2283 genes decreased 5-hmC. Three positive genes, HMGCR, THBD, and STAT3 were confirmed by quantitative real-time PCR. Conclusion: Our studies indicate the significant alterations of 5-hmC. There is a correlation of gene modification 5-hmC in uremia patients. Such novel findings show the significance of 5-hmC as a potential biomarker or promising target for epigenetic-based uremia therapies.
Introduction
UremiaCitation1,Citation2 is the consequence of intoxication in chronic renal failure with substances that are renally cleared in healthy individuals, it is also a complex metabolic state marked by derangement of many signaling molecules and metabolic intermediates. Acute uremia is a syndrome of gastrointestinal symptoms, pericarditis, pleuritis, and central nervous system alterations ending with coma.Citation3,Citation4
Epigenetics, which is the study of changes in gene expression that occur without changes in the DNA sequence, have been proposed to underlie age-related dysfunction and associated disorders. Chronic kidney disease (CKD)Citation5,Citation6 is an example of complex disease in which the phenotype arises from a combination of environmental and heritable factors.Citation7 The major epigenetic mechanisms include DNA methylation,Citation8 histone modifications, and microRNAs. Many studies have shown that epigenetic abnormalities are closely correlated with the pathogenesis of uremia.Citation9 Epigenetic studies may provide clues to elucidate the pathogenesis of uremia and develop new strategies to treat this disease.
DNA hydroxymethylation (5-hydroxymethylcytosine, 5-hmC)Citation10,Citation11 is a newly described epigenetic modification. Genome-wide profiling of 5-hmC thus far indicates 5-hmC may not only be an intermediate form of DNA demethylation, but could also constitute an epigenetic mark per se.Citation12 It is an oxidative product of the well-known DNA methylation (5-methylcystosine, 5mC) and catalyzed by the ten of the 11 translocation (TET) family of enzymes,Citation13 a family of enzymes dependent on 2-oxoglutarate and Fe(II) both in vitro and in vivo, suggest that TET1 or TET2 are involved in active demethylation and in the formation of stable 5-hmC residues.Citation14
The methylation of cytosine-guanine dinucleotide (CpG) with CCitation15 is a common epigenetic modification in mammals and is also an epigenetic mark that is widespread in both animals and plants, and appears to play important roles in various biological processes, such as gene silencing and imprinting. As an important epigenetic modification, 5mC regulates genomic functions, such as gene transcription, X-chromosome inactivation, imprinting, genetic mutation and chromosome stability.Citation16–18 5-mC is just one component of a dynamic epigenetic regulatory network of DNA modifications that also includes 5-hmC, 5-formylcytosine and 5-carboxylcytosine. Recently, reversible methylation of N6-methyladenosine in RNA has also been demonstrated.Citation19
5-hmC was first discovered in bacteriophage DNA in 1952; although it was discovered several decades ago, only after its recent identification in DNA from murine brain and stem cells, 5-hmC has become a major focus of epigenomic research.Citation20 The lower affinity of methyl-binding proteins to 5-hmC compared with 5-mC suggests that this modification might have a distinct role in gene expression regulation, yet 5-hmC is also implicated in the DNA demethylation process.Citation21,Citation22
To obtain a deeper understanding of the role of 5-hmC in the onset of uremia, we have generated genome-wide maps of 5-hmC in patients with uremia and healthy controls by performing hydroxymethyl-DNA immunoprecipitation followed by massively parallel sequencing with an Illumina Genome Analyzer (hMeDIP-chip) (San Diego, CA).
Materials and methods
Patients and controls
Thirty subjects were enrolled in this study, which included 15 uremia patients on dialysis and 15 healthy volunteers. All uremia patients were recruited from the inpatient unit in the Department of Nephrology in the 181st Hospital of PLA and free of active infections, diabetes mellitus as well as autoimmune diseases. Age-, race-, and sex-matched healthy controls were recruited by advertising. This study abides by the Helsinki Declaration on ethical principles for medical research involving human subjects.
Genomic DNA extraction and fragmentation
Blood samples were obtained from uremia patients (n = 15, 5 µL per subject, pooled into one blood sample) and normal healthy donors (n = 15, 5 µL per subject, pooled into one blood sample). Genomic DNA (gDNA) was extracted from the two blood samples using a DNeasy Blood & Tissue Kit (Qiagen, Fremont, CA). The purified gDNA was then quantified and quality assessed using a Nanodrop ND-1000 (Waltham, MA) (). The genomic DNA from each sample pool was sonicated to approximately 200–1000 bp using a Bioruptor sonicator (Diagenode, Seraing, Belgium) on the “Low” setting for 10 cycles of 30 s “ON” and 30 s “OFF”. The gDNA and each sheared DNA samples were analyzed on an agarose gel.
Table 1. DNA quantification and quality assurance by NanoDrop spectrophotometer.
Immunoprecipitation
One microgram of the genomic DNA was used for immunoprecipitation using a mouse monoclonal anti-5-hmC antibody (Diagenode). Before immunoprecipitation, the spike-in control sequences were mixed with the genomic DNA fragments. The DNA was then heat-denatured at 94 °C for 10 min, rapidly cooled on ice, and immunoprecipitated with 1 μL of primary antibody overnight at 4 °C with rocking agitation in 400 μL of immunoprecipitation buffer (0.5% BSA in PBS). To recover the immunoprecipitated DNA fragments, 200 μL of anti-mouse IgG magnetic beads were added and incubated for an additional 2 h at 4 °C with agitation. After immunoprecipitation, a total of five immunoprecipitation washes were performed with ice-cold immunoprecipitation buffer. The washed beads were resuspended in TE buffer with 0.25% SDS and 0.25 mg/mL proteinase K for 2 h at 65 °C and then allowed to cool to room temperature. The hMeDIP DNA fragments were purified using Qiagen MinElute columns (Qiagen).
DNA labeling and array hybridization
The purified DNA was quantified using a nanodrop ND-1000. For DNA labeling, the NimbleGen Dual-Color DNA Labeling Kit was used according to the manufacturer’s guidelines that are detailed in the NimbleGen hMeDIP-chip protocol (Nimblegen Systems, Inc., Madison, WI). One microgram of DNA from each sample was incubated for 10 min at 98 °C with 1 OD of Cy5-9mer primer (IP sample) or Cy3-9mer primer (Input sample). Next, 100 pmol of deoxynucleoside triphosphates and 100 U of the Klenow fragment (New England Biolabs, Ipswich, MA) were added, and the mixture was incubated at 37 °C for 2 h. The reaction was stopped by adding 0.1 × volume of 0.5 M EDTA, and the labeled DNA was purified by isopropanol/ethanol precipitation. The microarrays were hybridized at 42 °C for 16 to 20 h with Cy3/5 labeled DNA in Nimblegen hybridization component A in a hybridization chamber (Hybridization System – Nimblegen Systems, Inc., Madison, WI). Following hybridization, washing was performed using the Nimblegen Wash Buffer kit (Nimblegen Systems, Inc., Madison, WI). For array hybridization, Roche NimbleGen's Promoter plus CpG Island Array was used, which is a 385 k array containing 28,226 CpG islands and all well-characterized promoter regions (approximately −800 bp to +200 bp of relative to TSSs) completely covered by approximately 385,000 probes.
Quantitative real-time PCR verification of 5-hmC
The DNA was reverse transcribed to cDNA using gene-specific primers (). The cycle parameters for the PCR reactions were 95 °C for 10 min followed by 40 cycles of a denaturing step at 95 °C for 10 s and an annealing/extension step at 60 °C for 60 s. The relative amount of each gene was described using the equation: 2 − ΔCt, where ΔCt = (CtmiRNA − CtU6). The genes that were analyzed included HMGCR, THBD, and STAT3.
Table 2. Reverse-transcribe and QRT-PCR primers.
Results
hMeDIP-chip
Using specific antibodies, we performed hMeDIP-chipCitation23 on two samples: normal controls and uremia patients. To determine the 5-hmC status of a comprehensive set of human promoters, we enriched the DNA from whole blood samples for hydroxymethylated DNA using hMeDIP-chip methodology22 combined with microarray detection. The chosen platform is a single array design that includes 28,226 CpG islands and all the RefSeq gene promoter regions (approximately −800 bp to +200 bp relative to the TSSs) completely covered by approximately 385,000 probes. The median probe spacing is 101 bp.
DMR analysis using the MEDME method
To accurately quantify the CpG 5-hmC levels, we used a new analytical methodology, modeling experimental data with hMeDIP enrichment (MEDME), to improve the evaluation and interpretation of the hMeDIP-derived 5-hmC estimates. MEDME utilizes the absolute hydroxymethylation score (AHS) as the value for DNA hydroxymethylation, which is calculated based on the weighted count of the hydroxymethylated CpG dinucleotides in a 1 kb window centered at each probe. The AHS has been verified to be a more accurate and sensitive measure of 5-hmC levels than the log-ratio. The MEDME method also provides a relative 5-hmC score (RHS) that normalizes the AHS to the total number of CpGs represented by CpGw. This method allows the researchers to obtain a relative measure of the 5-hmC that is independent of the CpG density of the corresponding region. The RMS is especially useful when comparing regions with different CpG densities.
Promoter classes in relation to CpG frequency
Approximately 70% of human genes are associated with promoter CpG islands, whereas the remaining promoters tend to be depleted in CpGs21. The presence of 5-hmC in promoter regions is associated with high levels of transcription, which is consistent with a role for 5-hmC in the maintenance and promotion of gene expression. This effect is also partially dependent on the CpG density of the promoter. Based on the CpG density, CpG ratio and length of the CpG-rich region, the promoters are subdivided into three classes: high (HCP), low (LCP), and intermediate (ICP) CpG density. These classes are defined as follows: (i) High-CpG-density promoters (HCP) are promoters containing a 500 bp interval within the region from 0.7 kb upstream to 0.2 kb downstream of the TSS with a GC percentage greater than or equal to 55% and a CpG observed-to-expected ratio (O/E) great than or equal to 0.6. (ii) Low-CpG-density promoters (LCP) are promoters containing no 500 bp interval with a CpG O/E greater than or equal to 0.4. (iii) Intermediate-CpG-density promoters (ICP) include the remaining promoters that do not fall into either the HCP or LCP classification.
CpG island 5-hmC
Mammalian genomes are punctuated by DNA sequences that contain an atypically high frequency of CpG sites termed CpG islands (CGIs). These sequences are characterized as at least 200 bp in length with a GC content of 50% and a CpG O/E of 0.6. All CpG islands can be grouped into three classes based on their distance to RefSeq annotated genes: (i) Promoter islands occur from about −10 kb to +0.5 kb around the transcription start site. (ii) Intragenic islands occur from 0.5 kb downstream of the transcription start site to the site of transcription termination. (iii) Intergenic islands include all other CpG islands that do not fall into either the promoter or intragenic category.
Genome-wide profiling of promoter DNA 5-hmC
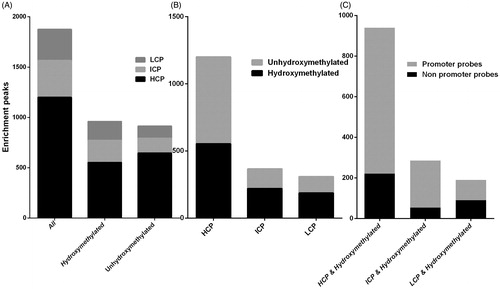
Based on our data, we examined the CpG content in the pool of hydroxymethylated promoters compared to non-hydroxymethylated promoters that displayed significant differences in 5-hmC levels between the uremia patients and the normal controls. We found that 57.60% of hydroxymethylated genes belonged to the HCP cluster, which is similar to the average occurrence of HCP genes genome-wide (64.00%) (). Similarly, 70.71% of the non-hydroxymethylated genes were associated with HCPs (). A detailed analysis of the distribution of the hydroxymethylated probes over these promoters, which should contain at least one CpG island by definition, indicated that 76.49% of the HCP genes have a hydroxymethylated probe that overlaps with the CpG island itself ( and ). In contrast, approximately 60% of the ICP and LCP genes were characterized as hydroxymethylated genes (). We conclude that DNA hydroxymethylation in the blood of uremia patients primarily occurs at HCP promoters or at non-promoter-CpG islands within HCP genes.
Figure 1. The definition of relationship between CPG and transcript regions.
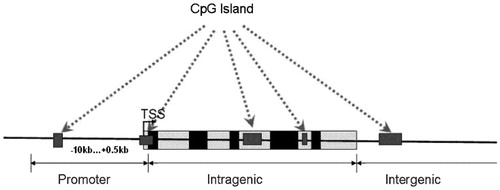
Figure 2. DNA 385K Promoter of hydroxymethylated and unhydroxymethylated promoters. (A) Classification of all promoters, hydroxymethylated promoters, or unhydroxymethylated promoters with high (HCP), intermediate (ICP), and low (LCP) CpG content. (B) Breakdown of hydroxymethylation status for HCP, ICP, and LCP promoters. (C) Percentage of genes with hydroxymethylated promoters in CpG islands.
Comparison of 5-hmC status between uremia patients and normal controls
By applying the analysis procedure described above to the sequencing results, we found that 1875 genes promoter regions showed significantly different levels of 5-hmC in the uremia patients compared with the normal controls. Among these genes, 960 exhibited increased 5-hmC and 915 exhibited decreased 5-hmC (). The CpG islands of 4063 genes showed significant differences in 5-hmC levels in the uremia patients compared with the normal controls. Among these genes, 1780 exhibited increased 5-hmC and 2283 exhibited decreased 5-hmC (). Pie chart (A) shows the chromosomal locations of the 960 genes that were hyper-hydroxymethylated within the promoter region in the uremia patients compared with the normal controls (clockwise from chromosome 1 to the X and Y sex chromosomes). The percentage of genes hyper-hydroxymethylated on the chromosome 1 and 19 is 8.96% (). Pie chart (B) shows the chromosomal locations of 1780 genes that were hyper-hydroxymethylated within the CpG islands in the uremia patients compared with the normal controls (clockwise from chromosome 1 to the X and Y sex chromosomes). The percentage of genes hyper-hydroxymethylated on 19 chromosomes is 9.66% (). The 5-hmC modifications of 15 selected genes are presented in . These selected genes showed the greatest differences. Detailed lists of the genes with 5-hmC modifications are provided in Table 3. Among these genes, we selected three positive genes, 3-hydroxy-3-methylglutaryl-CoA reductase (HMGCR), thrombomodulin (THBD) and signal transducer and activator of transcription 3 (STAT3) for verification. The microarray data were consistent with the qRT-PCR results () showing that HMGCR, THBD, and STAT3 exhibited significantly increased levels of 5-hmC. These three genes showed the largest differences and they may be associated with uremia.
Figure 3. Different DNA hydroxymethylation level in the whole blood cells of uremia patients compared with the normal controls. (A) Different DNA hydroxymethylation level in Gene Promoter (−800 bp to +200 bp): in the whole blood cells of uremia patients compared with the normal controls. (B) Different DNA hydroxymethylation level in CpG Islands: in the whole blood cells of uremia patients compared with the normal controls.
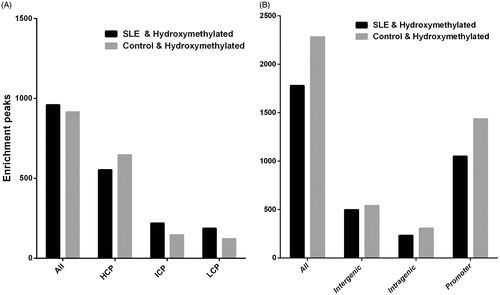
Figure 4. Pie charts showing the chromosomal location of the upregulated genes in uremia patients that compared to normal controls. (A) Pie charts showing the chromosomal location of the 960 genes that are upregulated in Gene Promoter (clockwise from chromosome 1 to X and Y sex chromosomes). The percentage of genes upregulated on the chromosome 1 and 19 is 8.96%. (B) Pie charts showing the chromosomal location of the 1780 genes that are upregulated in CpG Islands (clockwise from chromosome 1 to X and Y sex chromosomes). The percentage of genes upregulated on the 19 chromosome is 9.66%.
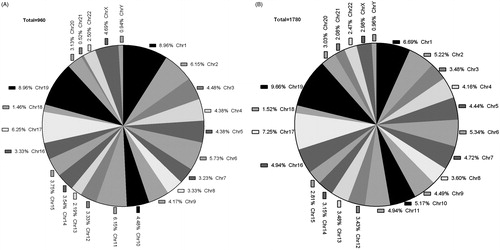
Table 3. The selected 15 genes with hydroxymethylation alterations between uremia and normal controls, identified by hMeDIP-chip.
Table 4. QRT-PCR verification results.
Discussion
The 5-hmC modification has been discovered in mammalian DNA,Citation24 but its broader role in epigenetics remains a mystery today. Early evidence suggests a few putative mechanisms that could have important implications:Citation10,Citation25
Conversion of methylcytosine (5-mC) to 5-hmC could displace methyl binding proteins (MBPs). MeCP2, for instance, will not bind to 5-hmC.
5-hmC may induce demethylation by interfering with the methylation maintenance function of DNMT1 during cell division.
5-hmC may have its own specific binding proteins that alter chromatin structure or DNA methylation patterns.
5-hmC was observed several years ago, but little is known about its subtle interrelationship with other epigenetic modifications and potential functional significance in human disease. In this study, we selected 5-hmC as the target, performed an investigation using hMeDIP-chip, and explored the hypothesis that 5-hmC are associated with the pathogenesis of uremia. We mainly analyzed the levels of 5-hmC in uremia patients and normal controls. The identified candidate genes with significant differences in 5-hmC levels are shown in Table 3. Overall, this list includes those genes associated with immunity, cell signal transduction, protein transcription, synthesis ion channels and transporters, and the extracellular matrix.
Among the identified candidate genes, we found that 3-hydroxy-3-methylglutaryl-CoA reductase (HMGCR) displayed increased 5-hmC between uremia patients and the normal controls. HMGCR is located on chromosome 5q13.3-q14 and is also known as LDLCQ3. HMG-CoA reductase is the rate-limiting enzyme for cholesterol synthesis and is regulated via a negative feedback mechanism mediated by sterols and non-sterol metabolites derived from mevalonate, the product of the reaction catalyzed by reductase. Normally in mammalian cells this enzyme is suppressed by cholesterol derived from the internalization and degradation of low density lipoprotein (LDL) via the LDL receptor. Competitive inhibitors of the reductase induce the expression of LDL receptors in the liver, which in turn increases the catabolism of plasma LDL and lowers the plasma concentration of cholesterol, an important determinant of atherosclerosis. Alternatively spliced transcript variants encoding different isoforms have been found for this gene [provided by RefSeq, Aug 2008].
In order to identify genes differentially methylated in CKD, Zawada et al.Citation26 conducted a genome-wide analysis of DNA methylation using SuperTAG methylation-specific digital karyotyping. Analysis of 27,043,436 tags revealed 4288 genomic loci with differential DNA methylation (p < 10–10) between hemodialysis patients and control subjects. Annotation of UniTags to promoter database allowed us to identify 52 candidate genes, these candidate genes include HMGCR. The results provide a comprehensive analysis of genome-wide epigenetic alterations in CKD, identifying candidate genes associated with proatherogenic and inflammatory processes. These results may spur further research in the field of epigenetics in kidney disease and point to new therapeutic strategies in CKD-associated atherosclerotic disease.
We also observed that the other candidate gene thrombomodulin (THBD) and activator of transcription 3(STAT3) was significantly hypo-hydroxymethylated in the uremia patients compared with the normal controls. The thrombomodulin (THBD) gene is located on chromosome 20p11.2 and is also known as TM; THRM; AHUS6; BDCA3; CD141 or THPH12. The protein encoded by this intronless gene is an endothelial-specific type I membrane receptor that binds thrombin. This binding results in the activation of protein C, which degrades clotting factors Va and VIIIa and reduces the amount of thrombin generated. Mutations in this gene are a cause of thromboembolic disease, also known as inherited thrombophilia [provided by RefSeq, Jul 2008].
THBDCitation27 is an endothelial membrane protein that has anticoagulation and anti-inflammatory effects, including the suppression of complement activity. Atypical hemolytic uremic syndrome (aHUS) is a rare disease characterized by microangiopathic hemolytic anemia, thrombocytopenia, and acute renal failure. Mutations in genes encoding regulators of the alternative complement pathway (CFH, MCP, C3, CFI, CFB, THBD, and CFHR1-5) are connected with this disease.
The activator of transcription 3(STAT3) gene is located on chromosome 17q21.31 and is also known as APRF; HIES. The protein encoded by this gene is a member of the STAT protein family. In response to cytokines and growth factors, STAT family members are phosphorylated by the receptor-associated kinases, and then form homo- or heterodimers that translocate to the cell nucleus where they act as transcription activators. This protein is activated through phosphorylation in response to various cytokines and growth factors including IFNs, EGF, IL5, IL6, HGF, LIF, and BMP2. This protein mediates the expression of a variety of genes in response to cell stimuli, and thus plays a key role in many cellular processes such as cell growth and apoptosis. The small GTPase Rac1 has been shown to bind and regulate the activity of this protein. PIAS3 protein is a specific inhibitor of this protein. Three alternatively spliced transcript variants encoding distinct isoforms have been described [provided by RefSeq, Jul 2008].
Set out to determine whether the resistance could be caused by a defect in GH-mediated janus associated kinase-signal transducers and activators of transcription (STAT) signaling as occurs in uremia, Schaefer et al. Citation28 conducted the animal experiments and the result suggests the presence of a defect distal to the nuclear binding of STAT or, alternatively, a defect in a STAT-independent GH-activated signaling pathway.
Chronic renal failure (CRF) is associated with resistance to the growth-promoting and anabolic actions of growth hormone (GH).Citation29 GH-induced tyrosine phosphorylation of JAK2, STAT5, and STAT3 was 75% lower in the CRF animals. Phosphorylated STAT5 and STAT3 were also diminished in nuclear extracts. The expression of the suppressor of cytokine signaling-2 (SOCS-2) was increased two-fold in GH-treated CRF animals, and SOCS-3 mRNA levels were elevated by 60% in CRF, independent of GH treatment. In conclusion, CRF causes a post-receptor defect in GH signal transduction characterized by impaired phosphorylation and nuclear translocation of GH-activated STAT proteins, which is possibly mediated, at least in part, by overexpression of SOCS proteins.
STAT3Citation30 is involved in indoxyl sulfate-induced inflammatory and fibrotic gene expression and cellular senescence in proximal tubular cells. STAT3 small interfering RNA suppressed indoxyl sulfate-induced expression of an inflammation marker gene (monocyte chemotactic protein-1), fibrosis marker genes (TGF-beta(1), alpha-smooth muscle actin) and a subunit of nuclear factor-kB (p65), and attenuated a cellular senescence marker, senescence-associated beta-galactosidase activity.
In this study, we systematically evaluated the genome-wide levels of 5-hmC in the DNA of uremia patients and gained new insights into the links between key genes and 5-hmC in the context of uremia. Our results indicate that 5-hmC is involved in the disease state and these novel candidate genes may become potential biomarkers or future therapeutic targets. Further investigations are needed to clarify the roles of the identified hydroxymethylated candidate genes in the pathogenesis of uremia.
Declaration of interest
The authors report no conflicts of interest. The authors alone are responsible for the content and writing of the paper.
This research was supported by the Guangxi Natural Science Foundation (No. 2012GXNSFDA053017 and No. 12-071-32).
Acknowledgements
The authors are deeply grateful to all the volunteers.
References
- Shalhoub V, Shatzen EM, Ward SC, et al. FGF23 neutralization improves chronic kidney disease-associated hyperparathyroidism yet increases mortality. J Clin Invest. 2012;122(7):2543–2553
- Haddy FJ, Meyer TW, Hostetter TH. Uremia. N Engl J Med. 2008;358(1):95 . doi: 10.1056/NEJMc073016
- Girndt M. Clinical issues with uremia. Internist (Berl). 2012;53(7):817–822
- Gernsheimer T, James AH, Stasi R. How I treat thrombocytopenia in pregnancy. Blood. 2013;121(1):38–47
- Liakopoulos V, Georgianos PI, Eleftheriadis T, Sarafidis PA. Epigenetic mechanisms and kidney diseases. Curr Med Chem. 2011;18(9):1733–1739
- Zawada AM, Rogacev KS, Heine GH. Clinical relevance of epigenetic dysregulation in chronic kidney disease-associated cardiovascular disease. Nephrol Dial Transplant. 2013;28(7):1663–1671
- Stenvinkel P, Ekström TJ. Epigenetics and the uremic phenotype: a matter of balance. Contrib Nephrol. 2008;161:55–62
- Zawada AM, Rogacev KS, Hummel B, et al. SuperTAG methylation-specific digital karyotyping reveals uremia-induced epigenetic dysregulation of atherosclerosis-related genes. Circ Cardiovasc Genet. 2012;5(6):611–620
- Ingrosso D, Perna AF. Epigenetics in hyperhomocysteinemic states. A special focus on uremia. Biochim Biophys Acta. 2009;1790(9):892–899
- Tahiliani M, Koh KP, Shen Y, et al. Conversion of 5-methylcytosine to 5-hydroxymethylcytosine in mammalian DNA by MLL partner TET1. Science. 2009;324(5929):930–935
- Huang Y, Pastor WA, Shen Y, Tahiliani M, Liu DR, Rao A. The behavior of 5-hydroxymethylcytosine in bisulfite sequencing. PLoS One. 2010;5(1):e8888. doi: 10.1371/journal.pone.0008888
- Gao F, Xia Y, Wang J, et al. Integrated detection of both 5-mC and 5-hmC by high-throughput tag sequencing technology highlights methylation reprogramming of bivalent genes during cellular differentiation. Epigenetics. 2013;8(4) [Epub ahead of print]
- Ito S, D'Alessio AC, Taranova OV, Hong K, Sowers LC, Zhang Y. Role of TET proteins in 5mC to 5hmC conversion, ES-cell self-renewal and inner cell mass specification. Nature. 2010;466(7310):1129–1133
- Tsumagari K, Baribault C, Terragni J, et al. Early denovo DNA methylation and prolonged demethylation in the muscle lineage. Epigenetics. 2013;8(3):317–332
- Yamaguchi S, Hong K, Liu R, et al. Dynamics of 5-methylcytosine and 5-hydroxymethylcytosine during germ cell reprogramming. Cell Res. 2013;23(3):329–339
- Jin SG, Kadam S, Pfeifer GP. Examination of the specificity of DNA methylation profiling techniques towards 5-methylcytosine and 5-hydroxymethylcytosine. Nucleic Acids Res. 2010;38(11):e125. doi: 10.1093/nar/gkq223
- Wu SC, Zhang Y. Active DNA demethylation: many roads lead to Rome. Nat Rev Mol Cell Biol. 2010;11(9):607–620
- Williams K, Christensen J, Helin K. DNA methylation: TET proteins-guardians of CpG islands? EMBO Rep. 2011;13(1):28–35
- Song CX, Yi C, He C. Mapping recently identified nucleotide variants in the genome and transcriptome. Nat Biotechnol. 2012;30(11):1107–1116
- Stroud H, Feng S, Morey Kinney S, Pradhan S, Jacobsen SE. 5-Hydroxymethylcytosine is associated with enhancers and gene bodies in human embryonic stem cells. Genome Biol. 2011;12(6):R54. doi: 10.1186/gb-2011-12-6-r54
- Xu Y, Wu F, Tan L, et al. Genome-wide regulation of 5hmC, 5mC, and gene expression by Tet1 hydroxylase in mouse embryonic stem cells. Mol Cell. 2011;42(4):451–464
- Gao Y, Chen J, Li K, et al. Replacement of Oct4 by Tet1 during iPSC induction reveals an important role of DNA methylation and hydroxymethylation in reprogramming. Cell Stem Cell. 2013;12(4):453–469
- Thomson JP, Lempiäinen H, Hackett JA, et al. Non-genotoxic carcinogen exposure induces defined changes in the 5-hydroxymethylome. Genome Biol. 2012;13(10):R93. doi: 10.1186/gb-2012-13-10-r93
- Jackson SA, Sridharan R. The nexus of Tet1 and the pluripotency network. Cell Stem Cell. 2013;12(4):387–388
- Honda T, Ogata S, Mineo E, et al. A novel strategy for hemolytic uremic syndrome: successful treatment with thrombomodulin α. Pediatrics. 2013;131(3):e928–e933
- Zawada AM, Rogacev KS, Hummel B, et al. SuperTAG methylation-specific digital karyotyping reveals uremia-induced epigenetic dysregulation of atherosclerosis-related genes. Circ Cardiovasc Genet. 2012;5(6):611–620
- Zoja C, Locatelli M, Pagani C, et al. Lack of the lectin-like domain of thrombomodulin worsens Shiga toxin-associated hemolytic uremic syndrome in mice. J Immunol. 2012;189(7):3661–3668
- Schaefer F, Yoon SA, Nouri P, et al. Growth hormone-mediated janus associated kinase-signal transducers and activators of transcription signaling in the growth hormone-resistant potassium-deficient rat. J Am Soc Nephrol. 2004;15(9):2299–2306
- Rabkin R, Sun DF, Chen Y, Tan J, Schaefer F. Growth hormone resistance in uremia, a role for impaired JAK/STAT signaling. Pediatr Nephrol. 2005;20(3):313–318
- Shimizu H, Yisireyili M, Nishijima F, Niwa T. Stat3 contributes to indoxyl sulfate-induced inflammatory and fibrotic gene expression and cellular senescence. Am J Nephrol. 2012;36(2):184–189