
Abstract
Purpose This study was performed to assess the effect of resveratrol on the expression of eukaryotic initiation factor 2α (eIF2α) and activating transcription factor 4 (ATF4) in renal tissues of rats with unilateral ureteral obstruction (UUO). Methods Using UUO animal model, after 14 days of surgery, pathological changes were detected by HE staining, renal tubular damage index, renal interstitial collagen deposition area were evaluated by Masson staining, in situ cell apoptosis in renal tissue was analyzed by TUNEL assay, and protein expression of eIF2α and ATF4 in renal tissue was analyzed using western blot detection. Results After comparison of the treatment groups with model group, we observed that the degree of renal tubular damage, relative area of renal interstitial collagen and eIF2α, ATF4 protein expression were also significantly reduced (p<0.05, p <0.01) in the high-dose resveratrol group. Conclusion Resveratrol can reduce the level of eIF2α protein expression, which further reduces the ATF4 levels.
Introduction
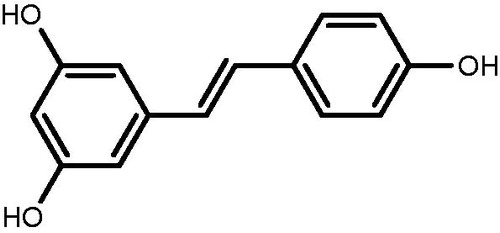
Chronic kidney disease (CKD) has become a public health problem because of its wide prevalence in the general population.Citation1 CKD ultimately leads to end stage renal failure by inducing the development of renal interstitial fibrosis (RIF). In recent years, in depth stress response studies have found a close relationship between endoplasmic reticulum stress (ERS) and development of RIF.Citation2 The key factors modulating the Unfolded Protein Response (UPR) pathway are eukaryotic translation initiation factor 2α (eIF2α), activin transcription factor 4 (ATF4) and protein kinase-like endoplasmic reticulum kinase (PERK).Citation3 Recent studies have shown that a wide variety of plants consumed by humans like Polygonum cuspidatum, grapes, peanuts, berries and pine, all have a natural polyphenol, resveratrol (RSV).Citation4 This RSV can effectively suppress obstructive RIF.Citation5 Its molecular structure is shown in . The study by Liu et al. has suggested that RSV can inhibit the eIF2α and ATF4 expression.Citation6 But there are no studies linking RSV to both ER stress and suppression of obstructive RIF. Therefore, this study was designed to investigate the role of RSV in regulation of eIF2α and activating transcription factor 4 protein expressions and identify how RSV intervention in renal tissue of rats with unilateral ureteral obstruction (UUO) can affect the development of RIF. This information would eventually help to provide a new strategy in combating RIF and chronic renal failure.
Figure 1. Molecular structure of resveratrol.
Materials
Animals and reagents
For this study, a total of 60 clean healthy male Wistar rats weighing 180–220 mg were obtained from the Experimental Animal Center, Jilin University, Peoples Republic of China (certificate of conformity SCXK (Kyrgyzstan) -2011-0004); Resveratrol (99% content, batch 326001) was purchased from Shanghai Dibo Chemical Technology Co. Ltd.; Enalapril maleate (batch 120201) was purchased from Shanghai Modern Pharmaceutical Co. Ltd.; Scr Kit (Lot number 122,321) and BUN kit (Lot number 120,891) were purchased from BIOSINO Biotechnology Co. Ltd.; TUNEL kit (batch 11684817910) was purchased from Roche, Germany; alkaline phosphatase esterase labeled horse anti-mouse IgG (H + L) (ZB-2310) and alkaline phosphatase labeled goat anti-rabbit IgG (H + L) (ZB-2308) were purchased from ZSGB-BIO; Actin antibody (AA128) was purchased from Beyotime; Phospho-eIF2α (Ser51) (D9G8) XPTM Rabbit mAb (#3398) and ATF-4 (D4B8) Rabbit mAb (#11815) were purchased from Cell Signaling Technology.
The instruments that were used for this study were procured from following sources, Low-speed centrifuge sigma3K30 from SIGMA Company; OLYMPUS Biological microscope from Olympus Corporation of Japan; Nikon DXM1200F automatic camera system from Japan Nikon Corporation; Leica paraffin tissue slicer from Germany Leica company; PHY-III pathological drift bake instrument from Changzhou Granville Electronic Instrument; BM-VII water bath biological tissue embedding machine from Xiaogan Hongye Medical Instrument Co. Ltd.; YT-6C biological tissue booth roast machine from Xiaogan City, Matt Medical Institute of Electronic Technology; Glamor 2000-type full automatic biochemical analyzer from American MD Instruments; Mini-PROTEAN Tetra electrophoresis tank and semi-dry blotting tank were from BIO-RAD company.
Methods
Rats grouping and drug treatments
The 60 rats were randomly divided into following six groups, each with 10 rats, 1) sham treated group, 2) model group, 3) enalapril group, 4) high-dose RSV group, 5) middle-dose RSV group, and 6) low-dose RSV group. Sham group and model group were given an equal volume of normal saline; enalapril group received a dose of 0.45 mg kg−1 d−1;Citation7 high-dose RSV group had a dose of 40 mg kg−1 d−1; the medium-dose RSV group had a dose of 20 mg kg−1 d−1 Citation8 and the low-dose group was administered a dose of 10 mg kg−1 d−1. Each group was gavaged once daily for 14 days until the day before surgery.
Establishing UUO model
The current study adopted the method of UUO to establish an animal model of RIF. The animals were fasted for 24 h and later anesthetized with 10% chloral hydrate 0.3 mL/100 g. Following the routine disinfection, to hair, retroperitoneal cut under sterile conditions was made. The skin and the muscle below the left rib cage from the rat were separated. The upper and lower ends of the left side ureter were surgically ligated and the abdominal wall and skin from the middle were sutured. Ureteral stripping in sham group (but not ligated and cut the ureter) was done after suturing the abdominal cavity.
Kidney function detection
The kidney functions were analyzed by using automatic biochemical analyzer to detect the levels of Scr and Bun.
HE staining
The tissue sections were HE stained and analyzed under a light microscope at 400× magnification. From each section, 10 fields were randomly selected to visualize the glomeruli. According to HE staining parameters, rating of 0 represented normal, while 1 suggested mild injury, 2 pointed to moderate damage and 3 depicted severe injury. Following this, semi-quantitative analysis of the tubulointerstitial pathological changes was made.
Masson staining
The Masson stained sections were observed under a 400× magnification and 10 randomly selected fields were analyzed for the percentage of the total inter-quality area between the tubes measuring fibrosis. The average of the percentage of renal interstitial relative area from each slice was calculated and used as a measure for renal tubular injury.
In situ TUNEL assay
After TUNNEL staining, the renal tissue sections were observed under a light microscope. The cells depicting brownish yellow to yellow-brown positive nucleus were determined as apoptotic cells. The images were captured from a randomly selected 10 non-overlapping high power fields (400×) of the glomerulus. Large blood vessels were avoided. The rate of apoptotic index (%) was calculated by counting the ratio of positive cells over the total number of cells as observed by pro-multimedia color pathological image analysis software.
Expression of eIF2α and ATF4 in renal tissue
The small sections of the renal tissue were incubated in the lysis buffer and were lysed by homogenizer grinding. Next, the cell lysates were centrifuged at 12,000 rpm for 10 min and the supernatant was transferred to 0.5 mL EP tubes. This was followed by the estimation of protein concentration by BCA protein assay kit. Subsequently, the equal amount of protein was mixed in 5:1 ratio with SDS-PAGE sample buffer, denatured for about 5 min and then loaded onto 12% SDS-PAGE gel for separation according to their molecular weight. Later, the proteins were transferred to the membrane and the membranes were incubated with primary antibody, overnight. The next day, after washing the membrane, they were incubated with secondary antibody for 1 h at RT. This was followed by incubation of the membranes with BCIP/NBT alkaline phosphatase coloring kit. The developed signals (color) were recorded and analyzed further.
Statistical analysis
All data were statistically analyzed using SPSS19.0 statistical software. The results were represented as mean ± SEM. Comparisons between two groups were done using ANOVA and within groups were done using t-test. The p values of <0.05 were considered statistically significant.
Results
Scr and BUN determination
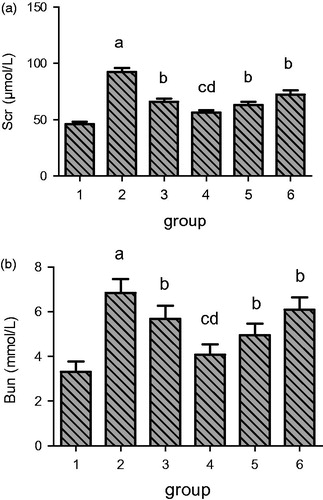
The Scr and BUN levels were measured from the serum of rats from each group. As seen in , UUO model rats (lane 2) have higher Scr and BUN levels as compared to sham group (lane 1), which does not represent UUO model. But, different treatments resulted in significant decrease in Scr and BUN levels when compared with the model group. The group with highest RSV dose in lane 4 resulted in the maximum reduction in Scr and BUN levels.
Figure 2. Effects of resveratrol on Scr and BUN levels in UUO rats. A, Scr. B, BUN. Lane 1 represents the data as mean ± SEM, from sham treated group; lane 2 from model group; lane 3 from enalapril group; lane 4 from high-dose resveratrol group; lane 5 from middle-dose resveratrol group and lane 6 from low-dose resveratrol group. The differences are significant as “a” depicts p values of <0.01 versus the sham group, “b” represents p values of <0.05 versus model group, “c” represents p values of <0.01 versus model group while “d” represents p values of <0.05 versus enalapril group.
Renal pathological changes
Kidney weight changes
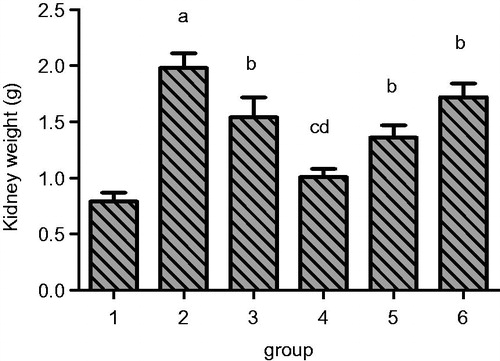
The analysis of kidney weights (g) in rats from different groups revealed that rats from all treatment groups have significantly lower weights when compared with model group as shown in . The weight of the kidney from rats of sham group was obviously less than the model group as there is no renal obstruction. Here again, the highest RSV treatment group in lane 4 resulted in the maximum reduction in kidney weight even better than enalapril.
Figure 3. Effect of resveratrol on weight of kidney in UUO rats. Lane 1 represents the data as mean ± SEM, from sham treated group; lane 2 from model group; lane 3 from enalapril group; lane 4 from high-dose resveratrol group; lane 5 from middle-dose resveratrol group and lane 6 from low-dose resveratrol group. The differences are significant as “a” depicts p values of <0.01 versus the sham group, “b” represents p values of <0.05 versus model group, “c” represents p values of <0.01 versus model group while “d” represents p values of <0.05 versus enalapril group.
Tubular injury index and collagen distribution area
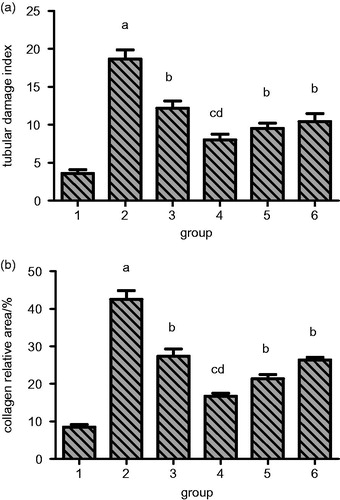
HE and Masson staining showed that the model group has pyelectasis, renal atrophy, interstitial fibrosis, focal tubular atrophy, dilation, inflammatory cell infiltration, distal convoluted tubule degeneration, proximal tubule granular degeneration and vacuolar degeneration. When this phenotype was assessed and compared with other treatment groups, it was observed that the impact of renal tubular damage index of each treatment group was significantly reduced in comparison to model group as shown in and (a). Similarly, the interstitial collagen also has a significantly reduced relative area in the treatment groups as seen in and (b). Herein, again the higher RSV treatment resulted in maximum reduction in renal tubular damage and collagen distribution. It has better effect than enalapril.
Figure 4. Effect of resveratrol on rat renal tubular damage index. The tissue sections from different groups were stained with HE staining and observed under light microscope at 400× magnification. Panel a represents sham group; panel B represents model group; panel c represents enalapril group; panel d represents high-dose resveratrol group; panel e represents middle-dose resveratrol group and panel f represents low-dose resveratrol group.
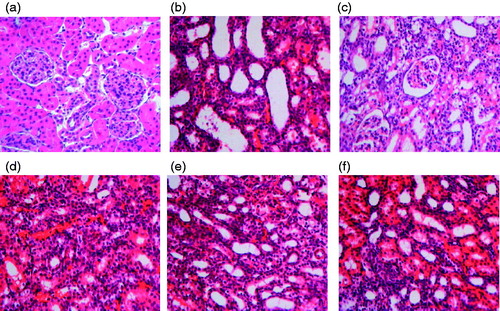
Figure 5. Effect of resveratrol on collagen distribution area in UUO rats. The tissue sections from different groups were stained with Masson staining and observed under light microscope at 400× magnification. Panel a represents sham group; panel b represents model group; panel c represents enalapril group; panel d represents high-dose resveratrol group; panel e represents middle-dose resveratrol group and panel f represents low-dose resveratrol group.
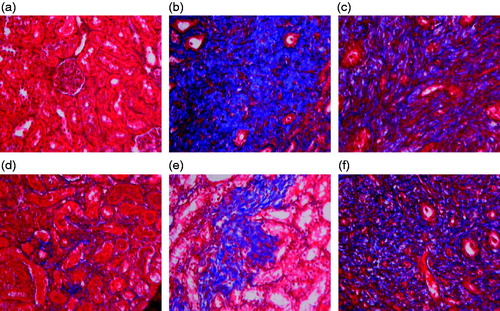
Figure 6. Quantitation of the effect of resveratrol on rat renal tubular damage index and collagen distribution area in UUO rats. Lane 1 represents the data as mean ± SEM, from sham treated group; lane 2 from model group; lane 3 from enalapril group; lane 4 from high-dose resveratrol group; lane 5 from middle-dose resveratrol group and lane 6 from low-dose resveratrol group. The differences are significant as “a” depicts p values of <0.01 versus the sham group, “b” represents p values of <0.05 versus model group, “c” represents p values of <0.01 versus model group while “d” represents p values of <0.05 versus enalapril group.
Tubular epithelial cell apoptosis
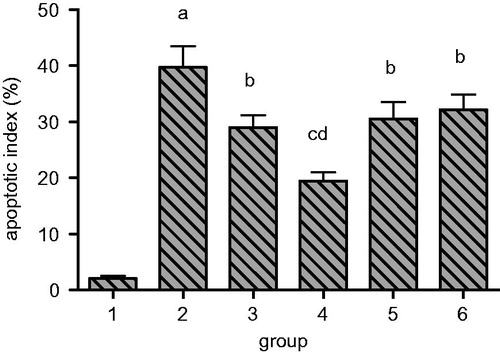
Furthermore, analysis of apoptosis by TUNNEL staining of renal tissue in model group rats, revealed an increased number of dark brown nuclei representing the apoptotic cells, when compared to sham group as seen in . Moreover, when the TUNNEL staining from renal tissue sections from each treatment group was compared with the model group, a significantly reduced apoptosis index was observed. The higher concentration group of RSV showed the minimum apoptosis index followed by enalapril group as seen in .
Figure 7. Effect of resveratrol on renal tubular epithelial cell apoptosis index in UUO rats. The tissue sections from different groups were stained with TUNNEL staining and observed under light microscope at 400× magnification. Panel a represents sham group; panel b represents model group; panel c represents enalapril group; panel d represents high-dose resveratrol group; panel e represents middle-dose resveratrol group and panel f represents low-dose resveratrol group.
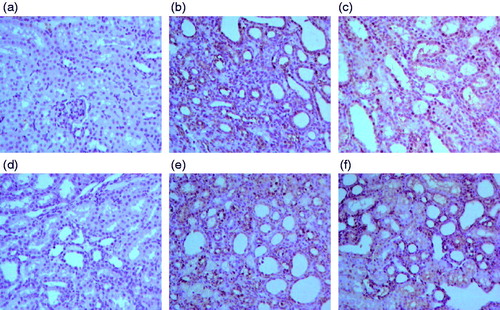
Figure 8. Quantitation of the effect of resveratrol on renal tubular epithelial cell apoptosis index in UUO rats. Lane 1 represents the data as mean ± SEM, from sham treated group; lane 2 from model group; lane 3 from enalapril group; lane 4 from high-dose resveratrol group; lane 5 from middle-dose resveratrol group and lane 6 from low-dose resveratrol group. The differences are significant as “a” depicts p values of <0.01 versus the sham group, “b” represents p values of <0.05 versus model group, “c” represents p values of <0.01 versus model group while “d” represents p values of <0.05 versus enalapril group.
Effects of RSV on eIF2α and ATF4 protein expression
Next, we analyzed the effect of RSV on the expression of eIF2α and ATF4 protein expression as these are important molecules involved in ER stress. We observed that sham group rats have very less expression eIF2α protein in the cytoplasm but in model group, its expression increased significantly as seen in and . But, in the treatment groups, the eIF2α protein expression levels decreased significantly in comparison to the model group levels. The high RSV treatment group has the minimum levels in UUO rats.
Figure 9. Western blot analysis of eIF2α and ATF4 protein levels. Lane 1 represents the data as mean ± SEM, from sham treated group; lane 2 from model group; lane 3 from enalapril group; lane 4 from high-dose resveratrol group; lane 5 from middle-dose resveratrol group and lane 6 from low-dose resveratrol group. Top panel represents an expression by western blot from the kidney lysates isolated, from different treatment groups. Bottom panel represents β-actin protein expression and is an internal control for equal loading of protein.
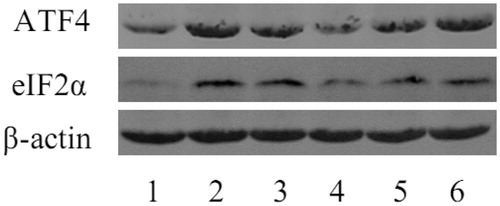
Figure 10. Quantitation of the effect of resveratrol on eIF2α and ATF4 protein expression in renal tissue of UUO rats. A, eIF2α. B, ATF4. Lane 1 represents the data as mean ± SEM, from sham treated group; lane 2 from model group; lane 3 from enalapril group; lane 4 from high-dose resveratrol group; lane 5 from middle-dose resveratrol group and lane 6 from low-dose resveratrol group. The differences are significant as “a” depicts p values of <0.01 versus the sham group, “b” represents p values of <0.05 versus model group, “c” represents p values of <0.01 versus model group while “d” represents p values of <0.05 versus enalapril group.
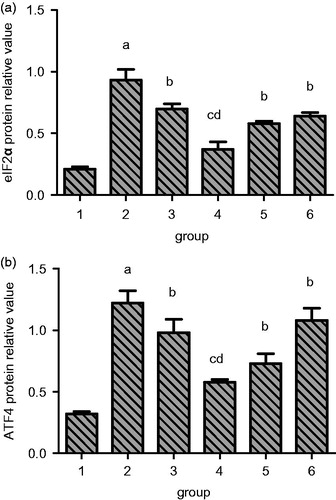
Similarly, the expression profile of ATF4 also followed a similar trend as shown in and . There was a significant increase in its expression in model group rats compared to sham group but different treatments resulted in reduction of its expression. The high-dose RSV group displayed the maximum reduction in its expression when compared with model group rats.
Discussion
ER stress induced cellular dysfunction and cell death has been implicated in the progression of many diseases. Thus it makes regulators of ER stress as major therapeutic targets. Under normal physiological conditions, ER stress is regulated by UPR, which clears the unfolded proteins and maintains ER homeostasis. But during pathological conditions, due to enhanced ER stress for a long time, this ER stress signaling pathway is switched to the apoptotic pathway, resulting in increased apoptosis.Citation9 The apoptosis of renal tubular epithelial cells not only promote renal tubular atrophy but can also cause extracellular matrix deposition in apoptotic cells, thus leading to the injury in the structure and function of the kidney.Citation10,Citation11
eIF2α and ATF4 are the important transcription factors involved in the ER induced apoptotic pathway. Phosphorylation of eIF2α not only leads to inhibition of protein translation in general, but also enhances the expression of specific genes like ATF4.Citation12 So eIF2α phosphorylation mediated suppression of protein translation results in overall reduction in the ER stress. In addition, eIF2α phosphorylation decreases translation of most of the mRNAs but translation of some of the mRNAs like ATF4 is enhanced and thus result in increased expression of ATF4 protein levels.Citation13 ATF4 controls the expression of important genes during apoptosis, including CHOP (CCAAT enhancer binding protein with the original protein) and GADD34 (DNA damage-inducing agent 34).Citation14 CHOP is involved in growth arrest and induction of apoptosis. GADD34 promotes protein synthesis, increases oxygen free radicals induced apoptosis,Citation15 strengthens the ERS and causes fibrosis. After induction of ATF4 expression, apoptosis factor expression is the most important trigger of apoptosis signaling pathways.Citation16 This study found that eIF2α and ATF4 protein levels in high-dose RSV group were lower as compared with enalapril group and were significantly different (p<0.05). Therefore, reduced levels of eIF2α and ATF4, which are involved in apoptosis pathway will result in slow down of ERS-induced apoptosis and will thus reduce RIF.
The severity of worsening of renal function in CKD depends largely on the quality of renal damage.Citation17 In this study, by measuring the apparent Scr and BUN levels, we found that RSV high, medium and low-dose group could reduce nitrogen hyperlipidemia and lead to renal protection. HE and Masson staining showed that model group has more serious RIF, more tubular injury, a large area of collagen distribution. The fibrosis in each of the RSV group was reduced. Even the high-dose RSV group had less fibrosis as compared to enalapril group. This suggests that RSV high dose is more effective than enalapril in reducing fibrosis. TUNEL staining further showed that RSV can effectively reduce the renal tubular epithelial cell apoptosis, and increased as the concentration of RSV is reduced. Thus it would be safe to conclude that the intervention of RSV reduces excessive ER stress and protects renal tissue.
The results of this study also indicate that eIF2α and ATF4 protein levels were significantly higher in the model group than in the sham group, indicating that UUO leads to phosphorylation of eIF2α, inhibition of protein synthesis and activation of ATF4 expression. This eventually results in the induction of tubular epithelial cell apoptosis pathway. High-dose RSV group in comparison to the enalapril group, results in decrease of eIF2α and ATF4 protein levels. It suggests that the effect of high-dose of RSV on inhibition of apoptosis pathway is stronger than enalapril. Therefore, we can conclude that RSV helps in managing the ERS by blocking the expression of eIF2α and ATF4 protein and subsequently prevents the excessive apoptosis of renal tubular epithelial cells and delays the renal fibrosis development.
Disclosure statement
The authors report no conflicts of interest.
References
- Zhang L, Wang F, Wang L, et al. Prevalence of chronic kidney disease in China: A cross-sectional survey. Lancet. 2012;379:815–817.
- Zhang C, Gao J, Zhang L. Effect of laminarin on the expression of GRP78 and GRP94 in rat after unilateral ureteral obstruction. Scand J Urol Nephrol. 2012;46:267–272.
- Hong P, Jun W, Xiu-Li C, et al. Effect of Shenfu injection on eIF2α (p) and ATF4 of neonatal rats with hypoxic ischemic brain damage. China Matern Child Health. 2011;26:5429–5432.
- Chun-Fu W, Jing-Yu Y, Fang W, Xiao-Xiao W. Resveratrol: Botanical origin, pharmacological activity and applications. Chin J Nat Med. 2013;11:0001–0015.
- Li P, Liang M-L, Zhu Y, et al. Resveratrol inhibits collagen I synthesis by suppressing IGF-1R activation in intestinal fibroblasts. World J Gastroenterol. 2014;16:4648–4661.
- Liu LQ, Fan ZQ, Tang YF, Ke ZJ. The resveratrol attenuates ethanol-induced hepatocyte apoptosis via inhibiting ER-related caspase-12 activation and PDE activity in vitro. Alcohol Clin Exp Res. 2014;38:683–693.
- Zhang C, Lu Y, Tong Q-Q, et al. Effect of stachydrine on endoplasmic reticulum stress-induced apoptosis in rat kidney after unilateral ureteral obstruction. J Asian Nat Prod Res. 2013;15:373–381.
- Yong-Heng B, Yong L, Bo S, et al. Resveratrol attenuates renal interstitial fibrosis by inhibiting activation of sonic hedgehog signaling in rats with unilateral ureteral obstruction. Chin J Pharmacol Toxicol. 2014;28:718–724.
- Zhuang J. Endoplasmic reticulum stress. Biol Teach. 2012;37:2–4.
- Yuan Y, Ding G, Zhang A, et al. Endoplasmic reticulum stress and kidney damage. Chin J Nephrol. 2011;27:949–952.
- Ji-Shi L. Research of Niban in Renal Interstitial Fibrosis. Central South University, China Academic Journal (CD) and Electronic Magazine Company Limited. 2014:143.
- Cameron NE. Role of endoplasmic reticulum stress in diabetic neuropathy. Diabetes. 2013;62:696–697.
- Yanfeng Z. Eukaryotic Initiation Factor-2α Phosphorylation Mediates Foam Cell Formation Induced by Apolipoprotein E-Deficient Lipoproteins. Wuhan University; 2010:117.
- Guo Y, Ren F, Duan Z-P, et al. Endoplasmic reticulum stress-induced unfolded protein response in medicine. J Clin Hepatol. 2015;18:92–96.
- Yang F, Mu M, Xiao J, Lin S. Progress in the mechanism of apoptosis induction of endoplasmic reticulum stress. J Med Res. 2014;43:176–180.
- Yifei Y, Dingping Y, Ruhan J, Guohua D. Effect of endoplasmic reticulum stress on the apoptosis of contrast media-induced renal tubular cells. Med J Wuhan Univ. 2013;34:507–511.
- Tang J. The Mechanism of Adenosine Signaling Mediated Renal Interstitial Fibrosis. Central South University, China Academic Journal (CD) and Electronic Magazine Company Limited. 2013:115.