
Abstract
Aim: Estimation of eGFR in children with normal kidney function using the Schwartz equations results in underestimating real GFR. Materials and methods: We propose modification of three Schwartz equations – two based on creatinine concentration (eGFRScrBS bedside) and (eGFRScr) and one 3-marker based on creatinine, urea and cystatin C concentrations (eGFRS3M). The iohexol test (reference method) was performed 417 times in 353 children >2 years with mean GFR: 98 ± 31.6 ml/min/1.73m2. The assessment included also the Filler and Zappitelli equations. The modification was performed using methods: (1) based on equation, eGFRcor = a [eGFR − T] + T, where T = 50, if eGFR > T, and a equals for: eGFRScrBS 1.4043, for eGFRScr 2.0048, for eGFRS3M 1.2951, and (2) based on correction of all coefficients of the original equation. Results: For comparison of all the results and for children with GFR< 60, 60-90, 90-135 and > 135 ml/min/1.73m2 the correlation coefficient, relative error (RE) and root mean square relative error (RMSRE) was employed and revealed improvement of RE from 25.9 to 6.8 and 3.9% (depending on the correction method) for eGFRScr; from 19 to 8.1 and 3.9% for eGFRScrBS and: from 11.6% to 2.0 and 2.3% for eGFRS3M (respectively). The RMSRE values changed from 30 to 21.3 and 19.8% for eGFRScr, from 25.1 to 21.6 and 19.8% for eGFRScrBS and from 19.1 to 15.8 and 15.3 % for eGFRS3M. Conclusions: Modifications of Schwartz equations at GFR > 60 ml/min/1.73m2 significantly improves the accuracy of calculating eGFR. The 3-markers equation is more accurate and should be employed frequently.
Introduction
Calculating a reliable GFR employing a noninvasive method poses a problem to nephrologists, what is illustrated by an increasing number of eGFR equations.Citation1–12 In addition to creatinine concentration, cystatin C have become increasingly more common and is supposed to be a better marker of kidney functionCitation9,Citation13–15,Citation16 although contrary opinions have been also expressed.Citation17,Citation18,Citation19 Also multi-marker formulas have become well known as they are believed more accurate.Citation20–22 Examples of such equations can be found for adult patients, such as MDRD,Citation23 and CKD-EPI and Donadio’s et al. formulas.Citation19,Citation22 In 2009, Schwartz et al. published the tri-marker equation for children, corrected in 2012 following verification of cystatin C determination by the nephelometric method.Citation2,Citation20 The equation, developed in chronic kidney disease (CKD) patients with mean eGFR value of approximately 43 mL/min/1.73 m2 is characterized by a very good compatibility with the iohexol method at GFR from 15 to 75 mL/min/1.73 m2.Citation9,Citation20 In 2006, Zappitelli and Bouvet proposed the bi-marker equations for children.Citation3,Citation5 All the above equations (except Bouvet equation) have been developed in CKD children. Validating these equations in children with normal kidney function is considered necessary.Citation20,Citation24,Citation25 The 2009 shortened equation of Schwartz has been evaluated in children with high GFR values,Citation1,Citation4,Citation12,Citation26–28 but only isolated papers estimated the accuracy of the tri-marker equation.Citation29 Chehade et al. noted a high conformity of that tri-marker equation as compared to inulin clearance at the mean GFR value of 87 mL/min/1.73 m2.Citation30 Contrary tendencies were observed by Gao et al.Citation1
The objective of this study is to compare the eGFR values calculated by the selected equations for children to GFR results from the iohexol method and to present own modifications of the Schwartz equations for GFR > 60 mL/min/1.73 m2.
Material and methods
The study group consisted of 353 pediatric patients of the Department of Nephrology, University Children’s Hospital of Cracow. Detailed anthropometric data are presented in .
Table 1. The basic anthropometric data and filtration markers for all children and subgroups at different CKD stages, based on GFRI results (mean value ± SD).
The height and weight of all the patients were routinely taken at the hospital by qualified nurses (using the accurate hospital weight and stadiometer – SECA 213, produced by Seca GmbH & Co with appropriate certification).
In the study group, only 31 children (7.5%) did have the Z-score for height < 2 (calculated relative to data for the European population according to the 4C study: www.4c-study.org).Citation31,Citation32 Only 15 children (3.6%) from the entire group had the Z-score for BMI < 2. The body surface area was calculated using the Haycock formula.Citation33 The detailed description of iohexol serum clearance test (reference method) was precisely described in the recent publicationCitation34 and is included in Appendix.
Serum creatinine levels were determined by the enzymatic method (VITROS FS Ortho Clinical Diagnostics). Until 1 March 2010, the method was validated relative to HPLC. From March 2014, it was validated according to isotype dilution mass spectroscopy (IDMS). The detailed explanation may be found in previous publication.Citation34 The total imprecision for low creatinine serum concentration (99 μmol/L) was 3.5% and, for high creatinine serum concentration (478 μmol/L), 2.6%.
Concentrations of cystatin C were determined using the nephelometric method (a Siemens N-Latex diagnostic set was used). The total imprecision of cystatin C determination for low cystatin C concentration (1.0 mg/L) was 2.6%, and 2.9% for high cystatin C concentration (8.4 mg/L). Serum urea concentration was determined by the enzymatic method (VITROS FS Ortho Clinical Diagnostics). The implementation of the study and iohexol test was approved by the Bioethical Committee, Jagiellonian University Medical College.
Based on the GFRI, the children were divided into four groups.
Group I: with GFR ≥135 mL/min/1.73 m2
Group II: with GFR 90–135 mL/min/1.73 m2, corresponding to CKD stage 1
Group III: with GFR 60–90 mL/min/1.73 m2, corresponding to CKD stage 2
Group IV: with GFR ≤60 mL/min/1.73 m2, corresponding to CKD stage 3, 4 and 5
An analysis of the anthropometric data and the values of kidney function indices in the children in every group are presented in and .
Table 2. p Values for comparisons between analyzed groups.
The inclusion criteria for the study were: (1) Indications for assessment of kidney function (the list of diagnosis is presented in ); (2) The parents’ and the child’s consent to the iohexol test; (3) A stable, good clinical status of the patient.
Table 3. The diseases category in examined group (n = 353).
The exclusion criteria were: (1) Proteinuria >1.5 g/day; (2) Serum albumin concentration < 36 g/L; (3) Steroid treatment at >1 mg/kg/day; (4) Lack of the approval for the test.
Children on steroid treatment with maintenance doses (see above) were included into the study, similarly as patients on cyclosporine A and/or mycophenolate mofetil and on nephroprotective treatment, which treatment has no significant effect on cystatin C values.Citation17,Citation35 Since the study was performed in the same group of children as the subjects described in the study from 2014,Citation34 are similar as in the quoted report.
Proposal of equations modification and employed modification methods
When GFR increased, the equations yielded clearly underestimated GFR values as compared to the real value. This is why the authors proposed a modification taking the form of the equation below for higher (normal) GFR values.
(1)
where: T – GFR threshold value, a – coefficient correcting values above the threshold value, eGFR – the analyzed original equation, eGFRcor – the equation following correction.
The following equations were selected to be modified:
1. The Schwartz equations:
the 2012 tri-marker equation – eGFRS3M,Citation20
the 2012 equation based solely on creatinine concentration – eGFRScrCitation20
the 2009 simplest equation based on creatinine concentration – eGFRScrBS,Citation2 employed as the bedside formula.
The differences between the (b) and (c) equations result from the correction described by Schwartz in 2012,Citation20 but they trigger a significant change in the result and have been included to preserve the methodological order.
The authors took into consideration also Filler and Lepage equation – eGFRF,Citation6 since it is a well-known pediatric formula, based on cystatin C concentration, while its employment overestimates the value of GFR as compared to the reference method.
(2)
where: CC – serum cystatin C concentration in mg/L.
The bi-marker equation developed by Zappitelli – eGFRZCitation5
(3)
where: H – height in cm, Ccr – plasma creatinine concentration in μmol/L, while e = 2.7183.
The forms of the Schwartz equations are given in the section “Results”; collectively presents all the formulas.
Table 4. The employed formulas description.
In this study, the GFR threshold value was assumed to be T = 50 mL/min/1.73 m2. This was inferred from the observation that recalculation needed to be done from the equation toward the reference value and not the other way. The value of T = 50 was arbitrarily determined based on a series of preliminary tests.
Dispersion of the calculated eGFR values relative to the reference method increases with an increasing GFR value.Citation29,Citation34 This is why the relative error (RE) expressed as a percentage value was chosen as the basic method of comparing to GFRI and to values originating from the analyzed equation:
(4)
where: n – number of patients, eGFRx – investigated value, while eGFRI – reference value.
The study presents a proposal of modifying GFRS3M, GFRScr and GFRScrBS employing two modes.
Mode 1: According to the relation described by EquationEq. (1)(1) , where each time, solely the a coefficient was determined. The thus modified equations were marked as eGFRS3MT, eGFRScrT, eGFRScrBST, respectively.
Mode 2: For each of the investigated equations, its general form was maintained, with all numerical coefficients being determined anew. The thus modified equations were marked as eGFRS3MC, eGFRScrC, eGFRScrBSC, respectively.
In both modes of modification, the value of RMSRE (root mean square relative error) was minimized.
(5)
where: N – number of patients.
The value of RMSE (root mean square error) for a given variable confronted with the reference variable was associated with the standard deviation SD (weighted equation) of the error comparing the same variables in keeping with the following formula:
(6)
where MV (mean value) denotes the mean value of the same error. Thus, RMSE is a measure of deviations relative to the reference value that also takes into account the error MV deviation from zero. For the zero value of the error MV, the values of error SD and RMSE are equal. In this study, the role of the error is fulfilled by the relative error.
The comparison of GFR values was performed using:
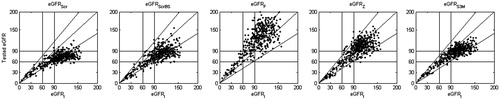
eGFRx correlation graphs depending on GFRref ( and ),
Figure 1a. The correlation between GFRI and tested eGFR. The GFRI value – on horizontal axis. On the vertical axes tested eGFR according to original equations: (GFRScr, GFRScrBS, GFRF, GFRZ, GFRS3M, respectively). The slash line is presenting the difference ± 30% to GFRI. The horizontal and vertical lines on plots mean values: 60 and 90 mL/min/1.73 m2.
RE graphs in the eGFRI function ( and ),
Figure 1b. The relative error (RE) plots [100% × (eGFRX-GFRI)/GFRI]. The GFRI value (in mL/min/1.73 m2) is presented on horizontal axis. The RE values [%] are shown on vertical axes. The vertical lines on plots mean values 60 and 90, the horizontal lines on plots show values −30% and +30% of RE.
![Figure 1b. The relative error (RE) plots [100% × (eGFRX-GFRI)/GFRI]. The GFRI value (in mL/min/1.73 m2) is presented on horizontal axis. The RE values [%] are shown on vertical axes. The vertical lines on plots mean values 60 and 90, the horizontal lines on plots show values −30% and +30% of RE.](/cms/asset/bb81e55e-b553-478a-9492-89fe29d3c8b4/irnf_a_1163152_f0002_b.jpg)
Figure 2a. The correlation between GFRI and modified Schwartz equations. The GFRI value is presented on horizontal axis. On the vertical axes corrected eGFR: (GFRScrT, GFRScrC, GFRScrBST, GFRScrBSC, GFRScrBST GFRS3MT, GFRS3MC, respectively). The GFR in mL/min/1.73 m2. The horizontal and vertical lines on plots mean values: 60 and 90 mL/min/1.73 m2.
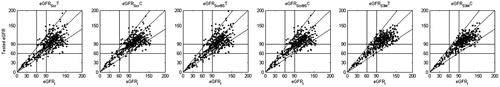
Figure 2b. The relative error (RE) plots [100% × (eGFRX-GFRI)/GFRI] on horizontal axis. The RE values [%] – on vertical axes. GFRx – corrected Schwartz equations corresponding to . The vertical lines on plots mean values 60 and 90 mL/min/1.73 m2, the horizontal lines on plots show values −30% and +30% of RE.
![Figure 2b. The relative error (RE) plots [100% × (eGFRX-GFRI)/GFRI] on horizontal axis. The RE values [%] – on vertical axes. GFRx – corrected Schwartz equations corresponding to Figure 2a. The vertical lines on plots mean values 60 and 90 mL/min/1.73 m2, the horizontal lines on plots show values −30% and +30% of RE.](/cms/asset/15642ac0-4fa8-4afb-bc41-29c86950c94a/irnf_a_1163152_f0004_b.jpg)
The 9-field tables illustrating the effectiveness of classifying the patients to three categories based on two eGFR threshold values that is 60 and 90 mL/min/1.73 m2 ().
Table 5. GFRScr versus GFRI (corresponding to ).
Table 6. GFRScrT versus GFRI (corresponding to ).
Table 7. GFRScrC versus GFRI (corresponding to ).
Table 8. GFRScrBS versus GFRI (corresponding to ).
Table 9. GFRScrBST versus GFRI (corresponding to ).
Table 10. GFRScrBSC versus GFRI (corresponding to ).
Table 11. GFRS3M versus GFRI (corresponding to Figure 1a).
Table 12. GFRS3MT versus GFRI (corresponding to ).
Table 13. GFRS3MC versus GFRI (corresponding to ).
Table 14. The classification accuracy (CA) coefficients calculated according to EquationEq. (7)(6) for 9-field tables.
The 9-field tables were developed in such a way as to present in the form of group size such data that were at the same time illustrated by the graphs. In this way, it was possible to assess the inter-marker differences even in case of highly similar graphs. The tables constitute an extension of the concept of classic 4-field. The 9-field tables are based on a division into three categories, both in the case of the reference equation and tested equation. In this way, the authors arrived at the contingency tables (cross tables), which, nevertheless, have fields with a zero value. This fact rules out the possibility of a reliable determination of statistical significance of the congruence of the two markers employing the chi-square test; however, in case of all the presented tables, the significance was sufficiently obvious that it did not require testing. In order to parameterize the contents of the employed tables, the CA (classification accuracy) parameter was proposed; its value, expressed as a per cent, gives the arithmetic mean probability of a correct classification when all the three categories are taken into account. The CA parameter takes into consideration solely correct results of a classification.
(7)
where Na (Naref) – the number of patients ascribed to a category based on the tested equation selected from among all the patients that were ascribed to the same category based on the reference value of GFRref (Naref). For the remaining two categories (b and c), the mechanism is the same.
Additionally, the above analyses were performed for the GFRI result in all the same as above subgroups of the patients.
The statistical analysis was performed with the Matlab and Statistica v.10 software. The comparison of the eGFR results was based on the Wilcoxon nonparametric test, the Mann–Whitney’s U test and the parametric Student’s t-test. The conformity of a given result to normal distribution was assessed with the Kolmogorov–Smirnov test. ANOVA was also used. The statistical significance of differences was at p < 0.05.
Results
The results of a detailed analysis of the studied group of children as depending on CKD stage are shown in .
In 67.1% of the children, GFRI amounted to > 90 mL/min/1.73 m2, while in 10%, it was > 135 mL/min/1.73 m2. demonstrates that the Z-score for height for the children with high values of GFRI >135 and GFRI 90–135 mL/min/1.73 m2 (Group I and II) was significantly lower as compared to the children with GFRI < 60 and GFRI 60–90 (Group IV and III). Similarly, the group I and II had a higher body mass as compared to the III and IV group, but the differences in the Z-score for BMI reached statistical significance only between the children with GFRI < 60 and those with GFRI ≥ 135 mL/min/1.73 m2. No statistical difference was noted between the ages of the children in particular groups.
Below, the proposals of equation modification are given:
Equation modification in keeping with Mode 1;
for the EquationEq. (1)(1)
where a = the coefficient in the . The determined coefficients are listed in .
Assumed T = 50 mL/min/1.73 m2.
Equation modification in keeping with Mode 2
The tri-marker Schwartz equation of 2012Citation20
(8)
where: G denotes sex (0 – Female, 1 – Male),
Cu – plasma urea concentration in mmol/L.
The Schwartz equation of 2012Citation20
(9)
The Schwartz bed-side formula of 2009,Citation2
(10)
The proposal of corrected coefficient are listed in .
presents the correlation graphs, while shows the RE graphs for the analyzed original equations relative to the iohexol method. Similarly, illustrate the relationships for the proposed equations following their modification.
and present the values of eGFR by analyzed original and corrected equations along with the RE, RE centiles, RMSE, R (correlation coefficient) and accuracy values at 10 and 30% relative to the reference method. The 9-field tables are presented in .
Table 15. The eGFR value, RE value, RE centiles, RMSRE, R (with p value) and 10 and 30% of accuracy to GFRI in patients with GFRI < 60 mL/min/1.73 m2 (N = 52).
Table 16. The eGFR value, RE value, RE centiles, RMSRE, R (p value) and 10 and 30% of accuracy to GFRI for original and corrected equations for GFRI < 60–90 mL/min/1.73 m2 (N = 85).
Table 17. The eGFR value, RE, RE centiles, RMSRE, R (p value) and 10 and 30% of accuracy to GFRI in for GFRI 90–135 mL/min/1.73 m2 (N = 238).
Table 18. The eGFR value, RE, RE centiles, RMSRE, R (p value) and 10 and 30% of accuracy to GFRI for GFRI ≥135 mL/min/1.73 m2 (N = 42).
Table 19. Determined coefficients a.
Discussion
Multi-marker equations for calculating GFR are more sensitive and accurate than uni-marker.Citation3,Citation5,Citation22 Due to their mathematical complexity, they cannot be used as bed-side formulas. Employing such programs as, for example Excel or online calculators allows for quick eGFR calculation. The use of multi-marker equations is significantly less expensive as compared to direct methods of GFR assessment. Indications for precise and repeated GFR calculation are indisputable in a selected group of children. A separate group consists of children with body deformities and malnutrition, in whom determination of creatinine concentration by itself may be inaccurate and insufficient.Citation36 As other authors, we suggest an additional cystatin C determination in this group. It should be remembered that multi-marker equations take into account the height of the patient, what in case of children with body disproportions may affect the error of the result in an identical manner as in case of uni-marker equations.
This study is a continuation of the report of 2014.Citation34 The proposal of the given modification of the original equations et high GFR are shown in results section; according to Mode 1—the coefficients are given in , according to Mode 2 in or all Schwartz equations.
Table 20. Original and corrected [C] coefficients for the tri-marker Schwartz equation of 2012.
Table 21. Original and corrected [C] coefficients for the Schwartz equation of 2012.
Table 22. Original and corrected [C] coefficients for the Schwartz bed-side formula of 2009.
The most important idea of the study is the fact that modification of the Schwartz equations for GFR > 60 mL/min/1.73 m2 decreases the error of eGFR calculation. The employment of the correction for the bed-side formula – eGFRScrBS – decreases the RMSRE from 37.1 to 28.9 or 27.3% (depending on the mode of correction: Mode 1, Mode 2, respectively) at GFR > 135 and from 24.7 to 19.3 and 16.7% in the group of children with GFR 60–90. Similarly, corrections for the tri-marker equation eGFRS3M reduce the RE (relative error) from 30.4 to 21.6 and 21.1% at GFR > 135 and from 18.1 to 13.1% at GFR 90–135 mL/min/1.73 m2. For the 2012 Schwartz equation – eGFRScr – the reduction in the error value approximates that noted in the case of the eGFRScrBS formula ( and ).
The biggest error of the result leading to underestimation of the GFR value relatively to the reference method is shown for Schwartz equation of 2012 – GFRScr (which is not a bed-side formula!!!). The highest compatibility has been found for the modified tri-marker Schwartz equation (). A detailed analysis of and for high GFR >90 mL/min/1.73 m2 indicates a significant error and underestimation of the result (>20%) in case of all the analyzed original equations except the Filler and Zappitelli equation, what confirms other opinions.Citation37
Table 23. The eGFR value (mean ± SD), average relative error (RE), the 5, 50, 95 centiles of RE (50% centile equals median value), RMSRE, correlation coefficient (R) to iohexol method ( p value) and 10% and 30% accuracy in all patients (N = 417).
The Filler equation has been found to significantly overestimate the value of real GFR by the mean percentage of 7.8–39%, what has been pointed out.Citation29,Citation37,Citation38 The bi-marker equation of Zappitelli shows a slight mean error of 18.5% and its accuracy mildly decreases only at high values of GFR >135 mL/min/1.73 m2.
Importantly at GFR >135 mL/min/1.73 m2, none of the equations, with the exception of the modified tri-marker Schwartz formula (GFRS3MC), shows a significant correlation with the reference method. At GFR < 60 mL/min/1.73 m2, the agreement of all equations is comparable, with the exception of the Filler formula, which has the highest error (mean relative error – 33.4%).
The findings of this study unambiguously indicate ( and and , 9-field tables) that multi-marker equations are more accurate than uni-marker formulas, which confirms others opinions.Citation24,Citation36,Citation38
The greatest advantage of this study is the assessment of the real GFR based on iohexol method in a large group of children with normal kidney function and the own proposal of modifying the Schwartz equations. This seems to be a more practical solution than introducing new forms of the equations. Such an approach has been already presented, for example Inker made the value of coefficients in the equation dependent on creatinine and cystatin concentrations (the combined CKD-EPI equation).Citation22 In the case of children, Souza, as well as Pottel proposed a correction of the bedside Schwartz equation depending on age.Citation4,Citation39 Pottel presented another concept of calculating eGFR at a known mean population creatinine concentration value for a given age.Citation11 It does not require knowing the averaged creatinine concentration value.Citation40 Nevertheless, following the analysis of the Pottel equation form, its use was abandoned since the results would be even lower (by approximately 9%) than the results by the Schwartz bed-side formula (eGFRScrBS). This explains the form of the Pottel equation, which – following transformation – has a mathematically identical formula as the Schwartz equation (the averaged equation of Pottel et al. eGFR = 0.376 H/Scr, where H – height, Scr – creatinine concentration in mg %).Citation30
In this report, the authors have not presented the analysis of results depending on sex, but such comparisons have been performed and no significant effect of sex on the accuracy of the employed equations has been noted, contrary to the others opinion.Citation39 Possibly, the effect of a large group of the examined children has obliterated such relations.
A novel idea is the use of 9-field tables (), which illustrate a potential error in classification of CKD stages. Employing the Schwartz equations results in underestimation of the estimated GFR value and visibly underestimates CKD classification, what is most obvious for the 2012 Schwartz equation (GFRScr) – ( and ). The proposed corrections decrease the error, and the classification accuracy coefficient is improved for all the Schwartz equations, reaching the highest values (81%) for the corrected tri-marker equation (), and the lowest for the 2012 Schwartz formula (eGFRScr).
One might ask to what degree the accuracy of GFR calculation at its high values is of a clinical importance. Being aware of some physiological individual fluctuations of GFR over time, the authors believe it is worthwhile to have in nephrology centers a precise tool for GFR calculation for selected groups of children, especially with glomerular hyperfiltration.
The limitations of the study result from too small a number of younger children and a single-center character of the study. A potential error of creatinine determinations should be explained by the employed standardization of the method that was described in the previous study (see the section on Material and methods).
Summary
In our opinion, in pediatric practice we should increasingly employ multiple-marker equations for GFR assessment in clinical situations that require a precise GFR estimation. While calculating eGFR according to the Schwartz equations in children with the anticipated GFR value > 60 mL/min/1.73 m2, one may decrease the error by using our corrections.
Conclusions
At higher values of GFR > 60, and especially > 90 mL/min/1.73 m2, the authors propose to employ new coefficients for the three Schwartz equations (the bed-side formula of 2009, the shortened equation of 2012 and the tri-marker equation). The use of the new coefficients significantly improves the accuracy of calculating GFR.
Multi-marker equations are characterized by a higher accuracy in eGFR calculation as compared to the uni-marker equations and should be more frequently employed.
Funding information
The study was in part financially supported from the Jagiellonian University Medical College grant (No K/ZDS/000438).
Disclosure statement
The authors report no conflict of interest or financial support. The authors alone are responsible for the content and writing of the study.
References
- Gao A, Cachat F, Faouzi M, et al. Comparison of the glomerular filtration rate in children by the new revised Schwartz formula and a new generalized formula. Kidney Int. 2013;83:524–530.
- Schwartz GJ, Munoz A, Schneider MF, et al. New equations to estimate GFR in children with CKD. J Am Soc Nephrol. 2009;20:629–637.
- Bouvet Y, Bouissou F, Coulais Y, et al. GFR is better estimated by considering both serum cystatin C and creatinine levels. Pediatr Nephrol. 2006;21:1299–1306.
- De Souza VC, Rabilloud M, Cochat P, et al. Schwartz formula: Is one k-coefficient adequate for all children? PLoS One. 2012;7:e53439.
- Zappitelli M, Parvex P, Joseph L, et al. Derivation and validation of cystatin C-based prediction equations for GFR in children. Am J Kidney Dis. 2006;48:221–230.
- Filler G, Lepage N. Should the Schwartz formula for estimation of GFR be replaced by cystatin C formula? Pediatr Nephrol. 2003;18:981–985.
- Grubb A, Nyman U, Bjork J, et al. Simple cystatin C-based prediction equations for glomerular filtration rate compared with the modification of diet in renal disease prediction equation for adults and the Schwartz and the Counahan-Barratt prediction equations for children. Clin Chem. 2005;51:1420–1431.
- Hari P, Biswas B, Pandey R, Kalaivani M, Kumar R, Bagga A. Updated height- and creatinine-based equation and its validation for estimation of glomerular filtration rate in children from developing countries. Clin Exp Nephrol. 2012;16:697–705.
- Filler G, Yasin A, Medeiros M. Methods of assessing renal function. Pediatr Nephrol. 2014;29:183–192.
- Bokenkamp A, Domanetzki M, Zinck R, Schumann G, Byrd D, Brodehl J. Cystatin C-a new marker of glomerular filtration rate in children independent of age and height. Pediatrics. 1998;101:875–881.
- Pottel H, Hoste L, Martens F. A simple height-independent equation for estimating glomerular filtration rate in children. Pediatr Nephrol. 2012;27:973–979.
- Blufpand HN, Westland R, Van Wijk JAE, Roelandse-Koop EA, Kaspers GJL, Boenkamp A. Height-independent estimation of GFR in children: An alternative for the Schwartz equation. Pediatr Nephrol. 2013;28:1360.
- Filler G. How to measure renal function in children – What is the role of cystatin C? Curr Pediatr Rev. 2006;2:225–231.
- Filler G, Bokenkamp A, Hofmann W, Le Bricon T, Martinez-Bru C, Grubb A. Cystatin C as a marker of GFR-history, indications, and future research. Clin Biochem. 2005;38:1–8.
- Roos JF, Doust J, Tett SE, Kirkpatrick CMJ. Diagnostic accuracy of cystatin C compared to serum creatinine for the estimation of renal dysfunction in adults and children – A meta-analysis. Clin Biochem. 2007;40:383–391.
- Dharnidharka VR, Kwon C, Stevens G. Serum cystatin C is superior to serum creatinine as a marker of kidney function: A meta-analysis. Am J Kidney Dis. 2002;40:221–226.
- Andersen TB, Eskild-Jensen A, Frokiaer J, Brochner-Mortensen J. Measuring glomerular filtration rate in children; can cystatin C replace established methods? A review. Pediatr Nephrol. 2009;24:929–941.
- Martini S, Prevot A, Mosig D, Werner D, van Melle G, Guignard JP. Glomerular filtration rate: Measure creatinine and height rather than cystatin C!. Acta Paediatr. 2003;92:1052–1057.
- Donadio C, Kanaki A, Caprio F, Donadio E, Tognotti D, Olivieri L. Prediction of glomerular filtration rate from serum concentration of cystatin C: Comparison of two analytical methods. Nephrol Dial Transplant. 2012;27:2826–2838.
- Schwartz GJ, Schneider MF, Maier PS, et al. Improved equations estimating GFR in children with chronic kidney disease using an immunonephelometric determination of cystatin C. Kidney Int. 2012;82:445–453.
- Zappitelli M, Zhang X, Foster BJ. Estimating glomerular filtration rate in children at serial follow-up when height is unknown. Clin J Am Soc Nephrol. 2010;5:1763–1769.
- Inker LA, Schmid CH, Tighiouart H, et al. Estimating glomerular filtration rate from serum creatinine and cystatin C. N Engl J Med. 2012;367:20–29.
- Levey AS, Bosch JP, Lewis JB, Greene T, Rogers N, Roth D. A more accurate method to estimate glomerular filtration rate from serum creatinine: A new prediction equation. Modification of diet in renal disease study group. Ann Intern Med. 1999;130:461–470.
- Harmon WE. Glomerular filtration rate in children with chronic kidney disease. Clin Chem. 2009;55:400–401.
- Fadrowski JJ, Neu AM, Schwartz GJ, Furth SL. Pediatric GFR estimating equations applied to adolescents in the general population. Clin J Am Soc Nephrol. 2011;6:1427–1435.
- Staples A, Leblond R, Watkins S, Wong C, Brandt J. Validation of the revised Schwartz estimating equation in a predominantly non-CKD population. Pediatr Nephrol. 2010;25:2321–2326.
- Selistre L, De Souza V, Cochat P, et al. GFR estimation in adolescents and young adults. J Am Soc Nephrol. 2012;23:989–996.
- Bacchetta J, Cochat P, Rognant N, Ranchin B, Hadj-Aissa A, Dubourg L. Which creatinine and cystatin C equations can be reliably used in children? Clin J Am Soc Nephrol. 2011;6:552–560.
- Sharma AP, Yasin A, Garg AX, Filler G. Diagnostic accuracy of cystatin C-based eGFR equations at different GFR levels in children. Clin J Am Soc Nephrol. 2011;6:1599–1608.
- Chehade H, Cachat F, Jannot AS, et al. Combined serum creatinine and cystatin C Schwartz formula predicts kidney function better than the combined CKD-EPI formula in children. Am J Nephrol. 2013;38:300–306.
- Furth SL, Cole SR, Moxey-Mims M, et al. Design and methods of the chronic kidney disease in children (CKiD) prospective cohort study. Clin J Am Soc Nephrol. 2006;1:1006–1015.
- Querfeld U, Anarat A, Bayazit AK. 4C Study Group, et al. The cardiovascular comorbidity in children with chronic kidney disease (4C) study: Objectives, design, and methodology. Clin J Am Soc Nephrol. 2010;5:1642–1648.
- Haycock GB, Schwartz GJ, Wisotsky DH. Geometric method for measuring body surface area: A height-weight formula validated in infants, children, and adults. J Pediatr. 1978;93:62–66.
- Zachwieja K, Korohoda P, Kwinta-Rybicka J, et al. Which equations should and which should not be employed in calculating eGFR in children? Adv Med Sci. 2015;60:31–40.
- Foster J, Reisman W, Lepage N, Filler G. Influence of commonly used drugs on the accuracy of cystatin C-derived glomerular filtration rate. Pediatr Nephrol. 2006;21:235–238.
- Filler G, Huang S-S, Yasin A. The usefulness of cystatin C and related formulae in pediatrics. Clin Chem Lab Med. 2012;50:2081–2091.
- Deng F, Finer G, Haymond S, Brooks E, Langman CB. Applicability of estimating glomerular filtration rate equations in pediatric patients: Comparison with a measured glomerular filtration rate by iohexol clearance. Transl Res. 2015;165:437–445.
- Zachwieja K, Korohoda P, Kwinta-Rybicka M, et al. A comparison of various methods of GFR estimation in children; the experience of a single center. Nefrol Dial Pol. 2009;13:234–240.
- Pottel H, Mottaghy FM, Zaman Z, Martens F. On the relationship between glomerular filtration rate and serum creatinine in children. Pediatr Nephrol. 2010;25:927–934.
- Hoste L, Dubourg L, Selistre L, et al. A new equation to estimate the glomerular filtration rate in children, adolescents and young adults. Nephrol Dial Transplant. 2014;29:1082–1091.
Appendix
Methodology of determining plasma iohexol by HPLC.
HPLC determinations were performed using a WATERS kit and Millennium 32 software. The distribution was performed using an Xterra column (C18 3.5 μm, 3.0 x 150 mm) at 30o C employing isocratic elution with the mobile phase composed of acetonitrile and water at the ratio of 4: 96, at a flow of 0.36 mL/minute. The analysis time was 15 minutes; iohexol was detected at the wavelength of 254 nm. The standard mixture was Omnipaque 300 mgJ/mL (647 mg iohexol/mL). The internal standard was iohexol Compound B manufactured by LGC Promoche.
After iohexol application to healthy patients, serum iohexol recovery was calculated in the blood samples. The following values were obtained:
For 10.0 μg – 109.2%
65.0 μg – 96.6%
300.0 μg – 93.7%
647.0 μg – 96.8%
For each series of determinations, residual control serum was employed with mean iohexol value of 159.89, SD = 6.48.The extra-series coefficient of variation CV was 4.05%. The intra-series coefficient of variation equaled CV = 0.69.