
Abstract
Purpose: To assess 1.9 GHz radiofrequency (RF) field exposure on gene expression within a variety of discrete mouse brain regions using whole genome microarray analysis. Materials and methods: Adult male C57BL/6 mice were exposed to 1.9 GHz pulse-modulated or continuous-wave RF fields for 4 h/day for 5 consecutive days at whole body average (WBA) specific absorption rates of 0 (sham), ∼0.2 W/kg and ∼1.4 W/kg. Total RNA was isolated from the auditory cortex, amygdala, caudate, cerebellum, hippocampus, hypothalamus, and medial prefrontal cortex and differential gene expression was assessed using Illumina MouseWG-6 (v2) BeadChip arrays. Validation of potentially responding genes was conducted by RT-PCR. Results: When analysis of gene expression was conducted within individual brain regions when controlling the false discovery rate (FDR), no differentially expressed genes were identified relative to the sham control. However, it must be noted that most fold changes among groups were observed to be less than 1.5-fold and this study had limited ability to detect such small changes. While some genes were differentially expressed without correction for multiple-comparisons testing, no consistent pattern of response was observed among different RF-exposure levels or among different RF-modulations. Conclusions: The current study provides the most comprehensive analysis of potential gene expression changes in the rodent brain in response to RF field exposure conducted to date. Within the exposure conditions and limitations of this study, no convincing evidence of consistent changes in gene expression was found in response to 1.9 GHz RF field exposure.
Introduction
The increasing proliferation of wireless devices and their associated infrastructure has led to concerns about potential health risks associated with increasing public exposure to radiofrequency (RF) fields. In 2011, the International Agency for Research on Cancer (IARC) classified RF fields as ‘possibly carcinogenic to humans’ (i.e., Group 2B) (IARC Citation2013). This classification is assigned by IARC when ‘a positive association has been observed between exposure to the agent and cancer for which a causal interpretation is considered by the Working Group to be credible, but chance, bias or confounding could not be ruled out with reasonable confidence’. Epidemiological studies published since this classification continue to provide contradictory results (Deltour et al. Citation2012; Little et al. Citation2012; Benson et al. Citation2013; Hardell et al. Citation2013; Poulsen et al. Citation2013; Coureau et al. Citation2014; Lagorio and Röösli Citation2014; Hardell and Carlberg Citation2015; Kim et al. Citation2015). While case control studies of mobile phone users and analysis of incidence trends in national cancer registries are ongoing, there are still no established mechanisms of action between RF field exposures at levels below international RF safety limits and the development of human neoplasms.
Other studies have examined the ability of RF fields to affect human cognitive performance (Valentini et al. Citation2010), electroencephalogram (EEG) activity (van Rongen et al. Citation2009) and sleep (Schmid et al. Citation2012). Consistent changes in the spectral power of sleep and in waking resting EEG activity have been reported in several studies, but at present the significance of these effects in relation to human health remains unclear (Scientific Committee on Emerging and Newly Identified Health Risks [SCENIHR] 2015). Animal and in vitro studies have reported a wide variety of health and/or biological effects of RF field exposure, including: changes in cell proliferation and differentiation, tumor induction, gene and protein expression changes, altered signal transduction pathways, reactive oxygen species generation, changes in DNA damage and repair, immune system activation, intracellular signalling, alterations in the blood brain barrier, intracellular calcium change, cerebral blood flow and glucose metabolism and memory dysfunction, among others. However, contradictory findings on each of these endpoints have been reported in other studies (International Commission for Non-Ionizing Radiation Protection [ICNIRP] Citation2009; Advisory Group on Non-Ionizing Radiation [AGNIR] Citation2012; SCENIHR Citation2015).
In an attempt to investigate potential interactions between RF field exposures and biological systems, several studies have employed high-throughput technologies to screen for subtle genomic and proteomic changes in cell cultures exposed to RF fields, in an effort to identify possible responding genes, proteins and/or pathways (Vanderstraeten and Verschaeve Citation2008; McNamee and Chauhan Citation2009; Leszczynski et al. Citation2012). However to date, only a limited number of studies have conducted genomic profiling in animals after in vivo RF exposure (Belyaev et al. Citation2006; Nittby et al. Citation2008; Paparini et al. Citation2008; Zhao et al. Citation2014).
The current study extends the analysis of potential responding genes or pathways in the rodent brain following in vivo RF field exposure by analyzing differential gene expression in a variety of discrete mouse brain regions. This approach was chosen as it was hypothesized that subtle responding elements may be detectable in small/discrete brain regions, whereas these changes might be masked when genomic analysis is conducted on whole brain or partial brain homogenates as has been performed in previous studies. The brain regions chosen (amygdala, auditory cortex, caudate nucleus, cerebellum, hippocampus, hypothalamus and medial prefrontal cortex) were selected as they represent neuronal regions involved in memory, behaviour, sleep, motor control, coordination and cognitive processing. Pathway analysis of microarray data was also conducted in this study in an attempt to identify potential responding pathways to further focus the analysis to genes of interest. Furthermore, positive controls and semi-quantitative RT-PCR were used to validate the results. In addition to exposures conducted using continuous wave RF fields, pulse-modulated RF fields (as emitted by wireless technologies) were also assessed as some studies have reported that the modulation of RF field carrier wave may be important to the observation of biological effects (Blackman Citation2009).
Methods and materials
Animals
Adult male C57BL/6 mice from Charles River Laboratories (St. Constant, Quebec, Canada), were housed individually in Isotech cages at the Animal Resources Division (ARD), Health Canada (Ottawa, Ontario). All animal experiments and procedures were conducted according to the guidelines of the Canadian Council of Animal Care, under a protocol approved by the Health Canada Animal Care Committee (protocol #2009-010). Upon arrival, the mice were maintained in a controlled environment (21 ± 2 °C, 40 ± 15% humidity) with a 12-h light cycle (07:00–19:00 h) and were given access to Purina Rodent Chow (#5001, Ralston Purina Inc., Strathroy, ON, Canada) and water ad libitum. The mice were acclimatized for 1 week prior to use, then randomly assigned to treatment groups. A total of five independent experiments (one mouse/treatment group per experiment, exposed concurrently) were conducted for 1.9 GHz pulse-modulated (50 Hz, 1/3 duty factor) and continuous-wave RF field exposure, which included the following treatment groups: ‘High RF field’ exposure (4 h day/5 days, n = 5), ‘Low RF field’ exposure (4 h day/5 days, n = 5), Sham control (4 h day/5 days, n = 5), Cage control (unhandled, n = 5). A separate group of mice (n = 5 per condition) were used as positive and negative controls. These animals were exposed to either 0 or 2 Gy X-irradiation in a cabinet X-ray machine (XRAD 320, Precision X-ray, North Branford, CT, USA) at 250 kVp and 12.5 mA with a 2 mm Al filter. The dose rate was 1.7 Gy/min, as measured using a Radcal 9010 ion chamber (Radcal, Monrovia, CA).
EMF exposure
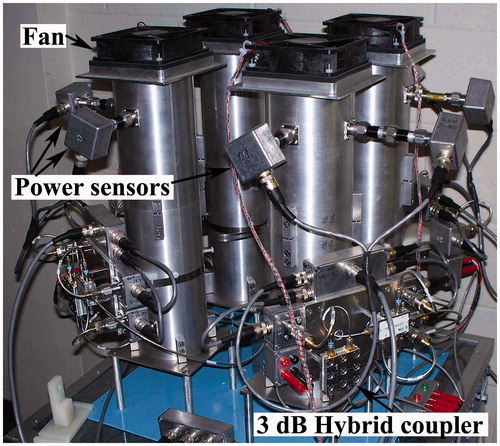
The RF field exposure system used in this study utilized four identical custom-designed exposure chambers, as previously described (Wasoontarajaroen et al. Citation2012a; Citation2012b). The cylindrical waveguide exposure chambers shared the same RF power source via a network of power dividers. Five power sensors per exposure chamber were used to measure RF power entering and exiting each chamber. Whole-body average (WBA) specific absorption rate (SAR) was calculated based upon power differential method and using the measured animal weight as a calibration factor. A personal computer equipped with IEEE-488 interface bus was programmed to control the RF source, acquire data from the power sensors, and process exposure data. This configuration supported real-time dosimetry monitoring for the mice (Wasoontarajaroen et al. Citation2012b).
In an attempt to control for handling stress, the experimental animals in the sham-, ‘High RF field’ and ‘Low RF field’ exposure groups for both the 1.9 GHz pulse-modulated and continuous-wave RF field experiments were conditioned in ‘mock’ RF-field exposure chambers for 4 h/day for 5 days, 1 week prior to actual RF field exposures. The conditioning included recording of body weight and rectal temperature prior to and immediately following the 4 h conditioning period each day. The animals were housed in custom Plexiglas animal cages, inserted within the bore of non-energized waveguides. During conditioning, all electronic equipment was operating on standby and the animals were exposed to identical ventilation conditions as in the real experiments. Mice were then returned to their home cages.
On the day of experimentation, the RF exposure apparatus was energized and allowed to operate for 30 min prior to the onset of animal exposures. The animals were weighed and body temperature was acquired using a rectal thermocouple (model#MLT1404, ADInstruments, Colorado Springs, CO). Prior to exposing the mice, the system was calibrated using empty animal cages to establish the baseline values of absorbed, reflected and transmitted power in the absence of test animals, using the measured animal weight as a calibration factor. The animals were then maintained within the exposure apparatus for 15 min prior to the onset of the exposure period (4 h). For pulse-modulated 1.9 GHz RF field exposures, a pulse repetition rate of 50 Hz was used with a duty factor of 1/3 (pulse ON to OFF time). The RF powers at all five sensors were sampled at 20 s intervals over the duration of the 4-h exposure period and WBA-SAR was calculated for each sampling instance using a power differential analysis based upon calibrated settings. This was carried out on each day of exposure for each animal. The animals did not have access to food or water during the exposure period. At the end of the exposure period, the animals were immediately removed from their cages, rectal temperatures and body weights were acquired and the animals were returned to their home cages. Blinding procedures were not employed during RF field exposures; however, isolated brain tissues were coded to ensure blinding during sample processing and during the conduct and analysis of gene expression assays.
Estimation of brain-averaged SAR
Since only WBA-SAR could be monitored during exposure, a numerical conversion from WBA-SAR to brain averaged (BA)-SAR was carried out after each exposure. The conversion factor was derived from data presented in Figures 4 and 8 of Wasoontarajaroen et al. (Citation2012b). This data was obtained from finite-difference time-domain (FDTD) calculations of WBA-SAR and BA-SAR of heterogeneous voxel models of three different masses (25, 27.5 and 30 g). The models were placed in the exposure chamber in combinations of two different postures (sitting and prone), two positions within the plastic cage (in the centre and along the wall) and at a number of rotation angles of the cage within the waveguide (in increments of 15 degrees up to a full rotation). For any given combination of posture and position, the resulting WBA-SAR and BA-SAR is periodic in respect to rotation angle. For each posture/position and angle, a conversion factor consisting of the ratio of BA-SAR to WBA-SAR was calculated. Values of this unitless conversion factor (reported as mean ± SD) for all postures, positions and angles for the 25, 27.5 and 30 g weights were found to be 0.50 ± 0.11, 0.55 ± 0.13 and 0.59 ± 0.14, respectively. Conversion factors for weights other than the three mentioned were obtained by interpolation.
Dosimetric uncertainties
Instrumentation uncertainties in the monitoring of real-time WBA-SAR were analyzed in Wasoontarajaroen et al. (Citation2012a) and were estimated to have a combined standard uncertainty (k = 1) of 7%. Since similar measurement equipment was used in the exposure system, this value was used in subsequent uncertainty estimates. In a typical daily exposure, the standard deviation of the WBA-SAR distribution, expressed as a percentage of the mean, was of the order 14–16%. Factoring in the instrumentation uncertainty gives combined standard uncertainties (k = 1) in the WBA-SAR of 15–18%. Using above conversion factors to calculate BA-SAR from the measured WBA-SAR values yielded combined standard uncertainties (k = 1), expressed as a percentage of the mean, of the order 28–29% for all postures and positions.
Tissue harvesting
Immediately following the final day of sham and RF field exposure conditions, or 6 h following X-irradiation (0 Gy or 2 Gy), the mice were sacrificed by decapitation using a small animal guillotine. The mouse brains were rapidly removed within 1 min of sacrifice and snap-frozen in super-cooled isopentane, maintained on dry ice. Once frozen (∼30 sec), the brains were placed into cryogenic vials (Nalgene) that were pre-cooled on dry-ice, then stored at −80 °C for several weeks before sectioning. The frozen brains were sectioned using a pre-cooled (−13 °C) cryostat (Leica CM1850) into 300 μm sections and the frozen sections were then mounted onto pre-chilled (−13 °C) slides. The medial prefrontal cortex, amygdala, hypothalamus and auditory cortex were excised bilaterally in two consecutive sections using a scalpel blade. The complete cerebellum from an anterior section was also collected. Bilateral punches were excised from the hippocampus (from three consecutive sections) and caudate nucleus (two consecutive sections) using a 1.00 and a 1.25 mm-diameter brain punch (myNeuroLab.com, St. Louis, MO, USA), respectively, according to coordinates adapted from Franklin and Paxinos (Citation2008). The excised tissue from 2–3 sections (bilaterally) from within a single animal were pooled and quickly placed into pre-cooled (−13 °C) 1.5 ml RNase/DNase-free microtubes (Kimble-Chase) and then stored at −80 °C for up to 3 months until processed for RNA isolation.
RNA isolation and labelling
On the day of RNA isolation, microtubes containing discrete brain regions were removed from storage at −80 °C and maintained on dry-ice on the benchtop. For tissue disruption and RNA stabilization, each sample was treated consecutively, as follows: a 350 μl aliquot of RLT buffer (Qiagen Inc.) containing 1% β-mercaptoethanol was added directly onto the frozen tissue sample and then immediately sonicated (Micro Ultrasonic Cell Disruptor, Kontes Inc.) for 5 s in the microtube with a sterilized probe treated with RNase-Zap, followed immediately by homogenization in the microtube for 30 s using a handheld homogenizer (Pellet Pestle Motor, Kontes Inc.) with disposable RNase/DNase-free pestles (Kimble-Chase Inc.). The samples were then maintained on the benchtop at room temperature until all samples had been disrupted/stabilized. Thereafter, the samples were processed as a group using RNeasy Micro kits (Qiagen Inc.), with on-column DNase digestion, using a modified version of the manufacturer’s instructions (e.g., additional RW1 and RPE washes). Following elution from the RNeasy MinElute columns (Qiagen Inc.) into RNase-free water, the RNA concentration was evaluated using a NanoDrop 2000 spectrophotometer (ThermoScientific Inc.) and RNA integrity was confirmed using an Agilent 2100 Bioanalyzer with RNA 6000 PicoChip kits (Agilent Technologies Inc.). Only high quality RNA (OD260/280 ≥ 1.8, RIN > 7.0) was used for analysis of differential gene expression. Total RNA (150 ng) from each sample was used to generate biotin-labeled cRNA following the Illumina TotalPrep 96 RNA Amplification Kit (Ambion, Inc.). Tissue RNA samples for all brain regions and exposure condition were maintained as independent samples (e.g., they were not pooled) and represent independent biological replicates (n = 5) for each condition.
Data analysis and statistical methodology
For each sample, 1.5 μg of biotin-labelled cRNA was hybridized onto Illumina MouseWG-6_V2 BeadChips (Illumina Inc.), according to the manufacturer’s instructions. The Illumina BeadChips were imaged and quantified with the Illumina iScan scanner (Illumina Inc.) and data were processed with Illumina GenomeStudio v2010.2 software. Data processing included averaging signal intensities for each bead type, quantile normalization and log2-transformation. The data were then imported into GeneSpring GX (v12.6) for statistical analysis.
The data from 1.9 GHz pulse-modulated RF field exposures and 1.9 GHz continuous-wave RF field exposures were analyzed separately as they were conducted as separate blocks of experiments. Each block of experiments consisted of four treatment groups, with a total of five independent animal tissues per treatment group, resulting in a total of 20 independent hybridizations per brain region per field modulation paradigm. In addition, a separate set of mice (five mice per group) were exposed to either 0 or 2 Gy X-irradiation to assess the responsiveness of the assay to detect changes to a known stimulus.
Each brain region was analyzed independently for differential probe expression in sham-exposed animals compared to that in the ‘High RF field’ and ‘Low RF field’ exposure groups using an ANOVA with Tukey’s post-hoc testing, with a false discovery rate (FDR) adjusted p-value cut-off of less than 5% to control for multiple comparisons testing (Benjamini and Hochberg Citation1995). Comparison of differential probe expression between the sham-exposed (handled) animals and the cage-control (unhandled) animals, or between 0 Gy or 2 Gy X-irradiated groups, was evaluated in each brain region using an FDR-adjusted unpaired t-test (p ≤ 0.05). Thereafter, the above statistical analysis was repeated for all endpoints under lower-stringency, without FDR-adjustment, but where a fold-change cut-off of 1.5 was employed in an attempt to determine whether subtle changes may have occurred that were masked by the high-stringency statistical analysis approach.
An alternative linear mixed model approach was also conducted to examine if dose of RF field exposure resulted in a statistically significant change in mean probe expression in a tissue-dependent manner, after attempting to account for potential confounding due to tissue, animal and week of study. This analysis is described in the Supplementary material and the data is presented in Supplementary Tables 1 and 2, available online.
Table 1. Measured whole-body average (WBA) and estimated brain averaged (BA) specific absorption rate (SAR) values (W/kg) in mice exposed to 1.9 GHz pulse-modulated or continuous-wave radiofrequency (RF) fields.
Table 2. Average mouse body weights at the beginning and end of the 5-day experiment period for each exposure condition.
Pathway analysis
Pathway analysis was conducted on the normalized probe expression data for each combination of RF field exposure (pulse-modulated or continuous-wave) and brain region, with three treatment groups consisting of sham, ‘High RF field’ exposure and ‘Low RF field’ exposure. There were five independent biological replicates in all cases, with the exception of the cerebellum, hippocampus and hypothalamus brain regions corresponding to 1.9 GHz continuous-wave RF field exposures at ‘High RF field’, ‘High RF field’ and ‘Low RF field’ treatments, respectively. Each of these normalized data sets were used in a pathway enrichment method called Structurally Enhanced Pathway Enrichment Analysis (SEPEA) (Thomas et al. Citation2009). The biochemical pathways chosen were the set of all pathways for the Mus musculus organism on the Kyoto Encyclopedia of Genes and Genomes (KEGG) pathway database (Kanehisa et al. Citation2006; Citation2008; Kanehisa and Goto Citation2000). SEPEA differs from other pathway enrichment methods in that it takes into account the network structure of the various pathways in the analyses – pathways where perturbed genes (as a result of treatment) are close relative to each other in a graph/network sense are assigned more significance. The gene-wise statistic chosen to be used by SEPEA was the non-parametric Kruskal-Wallis ANOVA statistic (Kruskal and Wallis Citation1952), that compares the medians of three groups of treatments with the given number of replicates in each of the groups. Thomas et al. (Citation2009) describe three null hypotheses for SEPEA, in this study SEPEA_NT2 with 104 permutations was chosen for analyses. For each pathway, the null hypothesis tested by SEPEA_NT2 is that the expressions of pathway-associated genes are independent of the intensity of the treatments for the given combination of pulse modulated or continuous wave treatment and brain region. SEPEA_NT2 was coded in Java programming language (Gosling et al. Citation2000).
Semi-quantitative RT-PCR
Pathways or genes identified as displaying differential expression were validated using semi-quantitative RT-PCR. Total RNA (100 ng) isolated from mouse brain tissues were reverse transcribed into complementary DNA using the RT2 First Strand Kit (SA Biosciences Corp., Frederick, MA). Gene profiling was performed according to the manufacturer instructions using RT2-profiler PCR arrays (SA BioSciences Corp.). The relative expression of each gene was determined by using the comparative threshold (Ct) method (Livak and Schmittgen Citation2001).
Results
Exposure conditions
Mouse SAR values were calculated every 20 s for the duration of each daily 4-h RF field exposure period for each animal using a power differential analysis for both the 1.9 GHz pulse-modulated and continuous-wave RF field experiments. The mean measured WBA-SAR and estimated BA-SAR for each RF field exposure condition are listed in .
Mouse body weight and rectal temperature were recorded daily for each animal before and after each experiment for each exposure condition. depicts the average mouse body weights (g) at Day 1 prior to the first exposure period and on Day 5 after the last exposure period. There were no significant differences in mouse body weight in any of the exposure groups over the course of the 5 day experiment period. depicts the average mouse rectal body temperature recorded immediately before and after each 4-h exposure period over a period of 5 days. While there were some minor differences observed in the average ‘Start’ vs. ‘End’ rectal body temperature measured for some conditions, these values were well within the normal physiological range for C57BL/6 mice (Sanchez-Alavez et al. Citation2011; Gaskill et al. Citation2013).
Table 3. Average rectal body temperature measured immediately before and immediately after each 4 h exposure period for each exposure condition.
Gene expression analysis after 1.9 GHz continuous-wave RF field exposure
Differential gene expression, relative to the sham-control group, was assessed in total RNA extracted from the amygdala, caudate nucleus, cerebellum, hippocampus, hypothalamus and medial prefrontal cortex of mice following exposure to 1.9 GHz continuous-wave RF field for 4 h/day for 5 days. Animals in the ‘High RF field’ group were exposed to RF fields at a WBA-SAR of 1.36 W/kg and an estimated BA-SAR of 0.76 W/kg, while those in the ‘Low RF field’ groups were exposed at a WBA-SAR of 0.19 W/kg and an estimated BA-SAR of 0.10 W/kg.
No gene targets (probes) were identified as differentially expressed in the amygdala, caudate nucleus, hippocampus, hypothalamus or medial prefrontal cortex brain regions, following statistical analysis using an FDR-adjusted p-value cut-off. Only one gene target with unknown function (AK014523) was found to be differentially expressed (p = 0.044) in the cerebellum following 1.9 GHz continuous-wave RF field exposure. This probe demonstrated a 1.06-fold up-regulation in the ‘High RF field’ group and a 1.06-fold down-regulation in the ‘Low RF field’ exposure group when compared to the sham-exposed control group. When differential gene expression was assessed between the sham and cage-control groups using an unpaired t-test with FDR-adjusted p-values, there were no differentially expressed gene targets identified between these groups in any brain region.
When the data were re-analyzed using a similar statistical approach, without FDR-adjustment, a number of gene targets representing a variety of cellular functions were identified as differentially expressed following 1.9 GHz continuous-wave RF field exposure in a variety of brain regions (). A total of 55 and 59 gene targets across a variety of brain regions displayed altered expression in the ‘High RF field’ and ‘Low RF field’ groups, respectively. Up-regulated and down-regulated probes, identified under low stringency statistical analysis are depicted in , respectively. Of note, probes against four known genes (beta actin, ActB; solute carrier family 6 (neurotransmitter transporter, taurine), member 6, Slc6A6; family with sequence similarity 107, member A, Fam107a; and ribosomal protein S17, Rps17) displayed altered expression (fold change ≥ 1.5) in the hypothalamus in both the ‘High RF field’ and ‘Low RF field’ groups, relative to the sham-control group. In the hippocampus, one gene target (synaptotagmin IV, Syt4) displayed altered expression (fold change ≥ 1.5) in both the ‘High RF field’ and ‘Low RF field’ groups, relative to the sham-control group. In each case, the fold-change was in the same direction for both RF exposure groups.
Table 4. Number of differentially expressed gene targets in 1.9 GHz continuous-wave radiofrequency (RF) field exposed mouse brain regions using a non-FDR-adjusted statistical approach (p ≤ 0.05), when compared to the sham-control group.
Table 5. Known genes that were up-regulated in mouse brain regions relative to the sham-control group following exposure to 1.9 GHz continuous-wave radiofrequency (RF) fields, using a non-FDR-adjusted statistical approach (p ≤ 0.05) with a minimum fold change of 1.5.
Table 6. Known genes that were down-regulated in mouse brain regions relative to the sham-control group following exposure to 1.9 GHz continuous-wave radiofrequency (RF) fields, using a non-FDR-adjusted statistical approach (p ≤ 0.05) with a minimum fold change of 1.5.
The effect of animal handling was also re-analyzed without FDR-adjustment by comparing differential gene expression in the sham-control group to that of the cage-control group. With the exception of the hypothalamus, there were a greater number of gene targets displaying differential gene expression under low stringency statistical analysis in the cage-control group than in either the ‘High RF field’ or ‘Low RF field’, when compared to the sham-control group ().
Gene expression analysis after 1.9 GHz pulse-modulated RF field exposure
Differential gene expression was also assessed in total RNA extracted from the auditory cortex, amygdala, caudate nucleus, hippocampus, hypothalamus or medial prefrontal cortex brain regions of mice exposed to 1.9 GHz pulse-modulated RF fields. Animals in the ‘High RF field’ group were exposed to RF fields at a WBA-SAR of 1.45 W/kg and an estimated BA-SAR of 0.83 W/kg, while those in the ‘Low RF field’ groups were exposed at a WBA-SAR of 0.16 W/kg and an estimated BA-SAR of 0.09 W/kg.
No gene targets were identified as being differentially expressed in any of the brain regions assessed following statistical analysis with FDR-adjustment. When differential gene expression was assessed between the sham and cage-control groups using an unpaired t-test (p ≤ 0.05), there were no differentially expressed gene targets identified between these groups in any brain region.
When the data were re-analyzed using a similar statistical approach, without FDR-adjustment, a number of gene targets representing a variety of cellular functions were identified as differentially expressed following 1.9 GHz pulse-modulated RF field exposure in a variety of brain regions (). A total of 30 and 14 gene targets across a variety of brain regions displayed altered expression in the ‘High RF field’ and ‘Low RF field’ groups, respectively. Differentially expressed probes associated with known genes, identified under low stringency statistical analysis, are depicted in .
Table 7. Number of differentially expressed gene targets in 1.9 GHz pulse-modulated radiofrequency (RF) field exposed mouse brain regions using a non-FDR-adjusted statistical approach (p ≤ 0.05), when compared to the sham-control group.
Table 8. Known genes that were differentially expressed in mouse brain regions relative to the sham-control group following exposure to 1.9 GHz pulse-modulated radiofrequency (RF) fields, using a non-FDR-adjusted statistical approach (p ≤ 0.05) with a minimum fold change of 1.5.
Tsc22d3 (TSC22 domain family, member 3, transcript variant 1), which encodes a leucine zipper protein, was observed to be upregulated in both the amygdala (1.51-fold) and medial prefrontal cortex (1.65-fold) after ‘High RF Field’ exposure, while Spp1 (secreted phosphoprotein 1, transcript variant 4) was upregulated (3.39-fold) in the ‘Low RF field’ group within the cerebellum and in the medial prefrontal cortex (1.68-fold), relative to the sham group. It was also observed that three gene targets encoding hemoglobin globin chains (Hba-a1, Hbb-b1 and Hbb-b2) were upregulated (1.76-, 1.65- and 1.65-fold, respectively) in the hypothalamus after ‘High RF Field’ exposure, relative to the sham group.
The effect of animal handling was also re-analyzed without an FDR-adjustment in the 1.9 GHz pulse-modulated RF field experiments by comparing differential gene expression in the sham-control group to that of the cage-control group. With the exception of the cerebellum, a comparable number of differentially-expressed probes were observed in the cage-control group relative to the sham-control group under low-stringency statistical analysis ().
Gene expression analysis after X-irradiation
In order to assess the ability of the methodology to detect differences in gene expression within mouse brain cell regions, a subset of animals were exposed to X-irradiation which served as a positive control. Using the same experimental procedures, differential gene expression was assessed in total RNA extracted from the auditory cortex, amygdala, caudate nucleus, cerebellum, hippocampus, hypothalamus or medial prefrontal cortex brain regions of mice exposed to 2 Gy X-irradiation and compared to that of matched (handled), unirradiated control mice.
Two probes were identified as differentially expressed in a variety of the brain regions following X-irradiation (p ≤ 0.05 FDR). Transformation related protein 53 inducible nuclear protein 1 (Trp53inp1) was significantly upregulated in the amygdala, cerebellum, hippocampus, hypothalamus, and medial prefrontal cortex. Cyclin-dependent kinase inhibitor 1A (P21) (Cdkn1a) was significantly upregulated in the cerebellum, hippocampus, and hypothalamus. Sema6b (semaphorin 6B) was also observed to be differentially expressed in the cerebellum, Bbc-3 (Bcl-2 binding component 3) was differentially expressed in the hypothalamus and Dcxr (dicarbonyl L-xylulose reductase) was differentially expressed in the medial prefrontal cortex after X-irradiation.
When the positive control data were re-analyzed using a similar statistical approach, without FDR-adjustment, a number of gene targets representing a variety of cellular functions were identified as differentially expressed following X-irradiation in a variety of brain regions (). Differentially expressed probes associated with known genes, identified under low stringency statistical analysis, are depicted in .
Table 9. Number of differentially expressed gene targets in 2 Gy X-irradiated mouse brain regions using a non-FDR-adjusted statistical approach (p ≤ 0.05), when compared to matched, unirradiated controls.
Table 10. Known genes that were differentially expressed in X-irradiated mouse brain regions relative to a matched, unirradiated control group using a non-FDR-adjusted statistical approach (p ≤ 0.05), with a minimum fold change of 1.5.
Pathway analysis after 1.9 GHz RF field exposure
While no genes with known function displayed differential gene expression using an FDR-adjusted p-value cut-off of 5% and only a handful of genes displayed differential expression using a non-FDR-adjusted statistical analysis following RF field exposure, the possibility of physiologically significant gene expression changes (i.e., low-fold changes) cannot be ruled out. In order to further assess the potential of RF fields to affect biochemical pathways in the mouse brain, pathway analysis was conducted on the Mus musculus KEGG pathway database using normalized gene expression data for each combination of RF field exposure (continuous-wave or pulse-modulated) and brain region using a network-based pathway analysis technique (SEPEA). P-values were adjusted for multiple testing by controlling the FDR with the Benjamini-Hochberg procedure (Benjamini and Hochberg Citation1995).
Only one pathway was found to demonstrate a significant difference (FDR adjusted p ≤ 0.05) in relation to treatment (sham, High RF field, or Low RF field) among all of the comparisons conducted by brain region or type of RF field exposure (pulse-modulated or continuous-wave). This occurred in the auditory cortex for the ‘Pentose and Glucuronate interconversions’ pathway (KEGGID: mmu00040; p = 0.043) in the pulse-modulated RF field experiments. Two other pathways displayed FDR-adjusted p-values ≤ 0.1 in relation to treatment, which included ‘P53 signal transduction’ (KEGGID: mmu04115; p = 0.086) in the medial prefrontal cortex in pulse-modulated RF field experiments and ‘Porphyrin and chlorophyll metabolism’ (KEGGID: mmu00860; p = 0.065) in the medial prefrontal cortex in continuous-wave RF field experiments.
RT-PCR analysis
To follow up on the microarray and pathway analysis, semi-quantitative RT-PCR was conducted on a subset of gene targets. Using a custom mouse PCR array (SA Biosciences; CAPM10959), a number of genes () in the ‘pentose and glucuronate interconversion’ and the ‘porphyrin and chlorophyll metabolism’ pathways were assessed simultaneously in RNA samples from the auditory cortex of pulse-modulated RF field exposed mice and the medial prefrontal cortex of continuous-wave RF field exposed mice, respectively. RT-PCR analysis found no significant differences (p ≤ 0.05) in gene expression among 26 genes involved in these KEGG pathways in either brain region.
Table 11. List of gene targets on custom mouse RT2Profiler PCR Array (CAPM10959).
Using a mouse P53 Signalling Pathway array (PAMM-027A, SA BioSciences), only one gene was found to demonstrate differential gene expression in the medial prefrontal cortex of pulse-modulated RF field exposed mice. DNA methyltransferase 1 (Dnmt1; NM_010066) was decreased by 1.23-fold in the low RF field exposed group relative to the sham-control group, but a similar effect was not observed in the high RF field exposed group versus the sham-control.
Discussion
The current study investigated the ability of short-term (4 h/day for 5 consecutive days) 1.9 GHz pulse-modulated or continuous-wave RF field exposure to influence gene expression within a variety of discrete mouse brain regions. Using a high-stringency (FDR-adjusted) statistical analysis approach to account for multiple comparisons testing, no genes with known function were found to demonstrate differential expression with either pulse-modulated or continuous-wave 1.9 GHz RF fields at either of two SARs tested, in any of the mouse brain regions examined. On the other hand, mice irradiated with 2 Gy X-irradiation demonstrated differential gene expression of both TRp53inp1 and Cdkn1a in most mouse brain regions assessed using a FDR-adjusted statistical analysis approach. These changes were expected as these are known to be ionizing radiation responsive genes involved in the repair of DNA double-strand breaks and cell cycle control.
Since the application of an FDR-adjusted statistical analysis may have resulted in the rejection of some ‘true positive’ responses (Type 2 errors), the data were re-analyzed without correction for multiple comparisons testing for comparison purposes. Since a large number of ‘false-positive’ events (Type 1 errors) were expected (∼2200), the data were filtered and only those genes demonstrating unadjusted p-values less than 0.05 and fold-changes greater than 1.5-fold are reported, as these were considered less likely to represent false-positive events. As expected, a number of genes demonstrated differential gene expression using this approach in a variety of brain regions and exposure conditions. When these gene lists were analyzed for consistency of responses at both ‘High RF field’ and ‘Low RF field’ exposure conditions, only a small number of genes (Actb, Slc6a6, Fam107a, Rps17 and Syt4) showed similar statistically-significant responses at both RF field exposure levels using the same RF field modulation paradigm, but none of these showed consistent responses across the experiments using different RF modulation paradigms (i.e., continuous-wave or pulse-modulated). The significance of these findings is questionable as for some genes (i.e., Syt4), similar fold changes were observed between the sham-control and cage-control groups (data not shown), indicating that the change may have occurred in the sham-control group rather than the RF exposed groups. Furthermore it was observed that for both sets of experiments (using different RF field modulation paradigms), a greater number of genes were differentially expressed between the sham and cage-control groups than between the RF-exposed and sham-control group ().
While no genes demonstrated differential gene expression using an FDR-adjusted statistical approach or demonstrated consistent responses between experiments using different RF field modulations (using a non-FDR-adjusted approach), it is possible that subtle yet meaningful changes in gene expression may have occurred that were either not detectable when analyzed using a high-stringency statistical approach or demonstrated low fold-changes and were filtered out during the low stringency analysis. In an alternative approach to investigating the potential effects of RF field exposure on gene expression in these mouse brain regions, analysis of gene expression according to KEGG pathways was conducted using a SEPEA approach whereby the interaction of genes within biochemical pathways is considered when evaluating the unfiltered gene expression data. Using an FDR-adjusted approach, three KEGG pathways demonstrated significance (p ≤ 0.1) by this pathway analysis. These were the ‘Pentose and Glucuronate interconversions’ pathway in the auditory cortex and ‘P53 signal transduction’ pathway in the medial prefrontal cortex of 1.9 GHz pulse-modulated RF field exposed mice; and the ‘Porphyrin and chlorophyll metabolism’ pathway in the medial prefrontal cortex pathway of 1.9 GHz continuous-wave RF field exposed mice. This pathway analysis demonstrated possible interactions between RF field exposure and gene expression which guided a focussed RT-PCR analysis of genes within these KEGG pathways.
When total RNA samples (matching those used for the microarray analysis) were used to assess gene expression in the brain regions and KEGG pathways identified from the SEPEA pathway analysis, only one gene (Dnmt1) in the P53 signal transduction pathway was found to demonstrate a significant change in gene expression (1.23-fold down-regulation) after ‘Low RF field’ exposure, but similar results were not found in the ‘High RF field’ exposed group relative to the sham-control group. No changes were found for any other genes involved in the ‘Pentose and Glucuronate interconversions’ or ‘Porphyrin and chlorophyll metabolism’ pathways. Taken collectively, the data in this study provided no evidence of robust changes in gene expression in the mouse brain regions assessed in this study following exposure to either pulse-modulated or continuous-wave 1.9 GHz RF field exposure.
In a previous study, Belyaev et al. (Citation2006) exposed Fisher 344 rats to 900 MHz GSM-modulated RF fields for 2 h at a WBA-SAR of 0.4 W/kg. Total RNA was isolated from the cerebellum of three sham- and three RF field-exposed rats and differential gene expression was assessed using Affymetrix U34 Genechips, representing 8800 gene targets. The authors reported 11 genes were upregulated and one gene was down-regulated using a non-FDR adjusted statistical approach. In this study, comparisons were made for each of the individual gene expression values in the RF field exposed group (n = 3) against each of the individual gene expression values in the sham control group (n = 3), resulting in a 3 × 3 matrix comparison where every one of the nine individual gene comparisons between the groups was required to be statistically different (Wilcoxon’s test, p < 0.0025). It is unclear how such individual statistical comparisons were made to construct the 3 × 3 matrix, as each comparison represented only a single independent experiment. In the absence of RT-PCR or northern blot assays to validate these findings, the differential gene expression results in this study should be interpreted with caution.
Nittby et al. (Citation2008) exposed rats to 1.8 GHz GSM-modulated RF fields at a WBA-SAR of 13 mW/kg (BA-SAR was 30 mW/kg) or sham conditions for 6 h, then harvested RNA from the hippocampus or cortex 1 h later. The authors found no significant differences in gene expression for any of 31,099 gene targets (probes) between the sham- and RF-exposed rats (n = 4) when the statistical analysis was adjusted for multiple-comparisons tested (e.g., FDR-correction). To extend their analysis, the authors attempted to evaluate differences in 4956 gene ontology (GO) categories using their microarray data. The authors ranked absolute fold changes between the RF-exposed and sham control groups for each gene and applied a Wilcoxon rank sum test to identify over-representation of genes at the top of this list among each GO category. In the RF field exposed group, the authors reported 25 GO categories were significantly altered in the cortex and 20 were altered in the hippocampus, using a statistical approach that corrected for multiple-comparisons testing. While this approach is interesting, it is based upon absolute fold changes between groups and ignores variability among the dataset upon which the fold change values are based. Thus, overrepresentation of certain GO categories may simply reflect highly variable expression patterns or low baseline expression for some genes (where the denominator for such ratios is near zero) that drive high fold changes. Unfortunately, the authors did not validate their GO category analysis for key genes driving these changes (e.g., high absolute fold change differences) with RT-PCR analysis.
The results of the current study are similar to those reported by Paparini et al. (Citation2008) who exposed Balb/cJ mice to 1800 MHz GSM modulated RF fields for 1 h at a WBA-SAR of 1.1 W/kg. The BA-SAR in this study was estimated to be 0.2 ± 0.07 W/kg. The authors examined 22,600 probes using an Affymetrix Mouse Expression Array (A430) in RNA prepared from whole brain homogenates. No differential gene expression was observed when the statistical analysis applied FDR-adjustment, but 75 genes were identified as being differentially expressed in the absence of FDR-adjustment (fold change of 1.5 or greater). When each of these 75 genes was validated by RT-PCR, none were found to be significantly different from that of the sham control group.
More recently, Zhao et al. (Citation2014) exposed adult male Wistar rats to 2.856 GHz RF fields for 10 min/day for 3 days at a power density of 300 W/m2. The WBA-SAR and BA-SAR within the rats during RF field exposure were not reported in this study. However, based upon previous dosimetric evaluation by this group using rat cadavers (Wang et al. Citation2013), the BA-SAR in this study can be estimated at approximately 21 W/kg and the temperature increase in the brain following RF field exposure to be approximately 1 °C. At 7 and 14 days after the last RF field exposure, total RNA was isolated from the hippocampus and differential expression of microRNA (miRNA) was assessed using miRCURY LNA array (v18.0; Exiqon). The authors used a non-FDR-adjusted statistical analysis whereby differentially expressed miRNA targets were identified as those with fold changes of greater than 1.5 and were significant (p < 0.05) using t-tests. A total of 12 upregulated and 70 down-regulated miRNA targets were identified at 7-days post-exposure, while two genes were upregulated and 14 were down-regulated at 14-days post-exposure. Validation was conducted on six down-regulated miRNA targets using RT-PCR and all were confirmed as significantly different using t-tests. It is important to note that the RF field power density applied to the rats in this study is 30 times higher than the human exposure limits recommended by the International Commission for Non-Ionizing Radiation Protection (ICNIRP) for the prevention of thermal effects associated with RF field exposures in this frequency range (ICNIRP Citation1998). Since the rats were exposed at a relatively high RF field exposure level where temperature changes in the brain of approximately 1 °C are known to occur, it is unclear whether the observations in this study relate to direct RF field effects on the brain or are the result of heating of the brain from RF field exposure (and would occur from any form of brain heating).
The interpretation of the biological significance of microarray analysis results requires a careful evaluation and consideration of a large number of quality and consistency variables (Bourdon-Lacombe et al. Citation2015). The current study assessed global gene expression in a number of discrete mouse brain regions following 5 days of exposure of mice (4 h/day) to 1.9 GHz RF fields under tightly controlled exposure conditions. Furthermore, the current study employed 330 independent microarray hybridizations, controlled for the FDR, included pathway analysis and validation by RT-PCR. No evidence of altered gene expression was found using FDR-adjusted microarray analysis. While a small number of genes were identified as statistically significant using non-FDR-adjusted statistical analysis, consistent responses were not observed across different RF field exposure intensities or modulations. Pathway analysis and RT-PCR did not provide supporting evidence that RF field exposures resulted in any detectable changes in gene expression in the mouse brain. While the current study cannot rule out subtle changes in gene expression within the mouse brain (e.g., fold changes below 1.5-fold), changes occurring at other post-exposure times or those occurring within other mouse brain regions, the current study provides the most comprehensive analysis of potential gene expression changes in the rodent brain in response to RF field exposure of any study conducted to date. Additional high-quality, targeted studies are recommended to provide further insight into possible effects of RF field exposure on biological systems.
Supplementary_Text.docx
Download MS Word (21.3 KB)Supplemental_Table_2.pdf
Download PDF (101.4 KB)Supplemental_Table_1.pdf
Download PDF (80.8 KB)Acknowledgements
The authors wish to thank Anne Haegert and Robert Bell of the Vancouver Prostate Centre Microarray Facility (Vancouver, Canada) for their expertise in conducting the Illumina microarray hybridization, scanning and analysis within this study.
Disclosure statement
The authors report no conflict of interest. The authors alone are responsible for the content and writing of the paper.
Figure 1. This photograph depicts the in vivo RF field animal exposure system used in this study.
References
- Advisory Group on Non-Ionizing Radiation (AGNIR). 2012. Health Effects from Radiofrequency Electromagnetic Fields – Report of the independent Advisory Group on Non-Ionizing Radiation. UK Health Protection Agency. ISBN 978-0-85951-714-0.
- Belyaev IY, Koch CB, Terenius O, Roxström-Lindquist K, Malmgren LO, H Sommer W, Salford LG, Persson BR. 2006. Exposure of rat brain to 915 MHz GSM microwaves induces changes in gene expression but not double stranded DNA breaks or effects on chromatin conformation. Bioelectromagnetics. 27:295–306.
- Benjamini Y, Hochberg Y. 1995. Controlling the false discovery rate: A practical and powerful approach to multiple testing. J Royal Statist Soc: Series B. 57:289–300.
- Benson VS, Pirie K, Schüz J, Reeves GK, Beral V, Green J; Million Women Study Collaborators. 2013. Mobile phone use and risk of brain neoplasms and other cancers: Prospective study. Int J Epidemiol. 42:792–802.
- Blackman C. 2009. Cell phone radiation: Evidence from ELF and RF studies supporting more inclusive risk identification and assessment. Pathophysiology. 16:2015–216.
- Bourdon-Lacombe JA, Moffat ID, Deveau M, Husain M, Auerbach S, Krewski D, Thomas RS, Bushel PR, Williams A, Yauk CL. 2015. Technical guide for applications of gene expression profiling in human health risk assessment of environmental chemicals. Regulat Toxicol Pharmacol. 72:292–309.
- Coureau G, Bouvier G, Lebailly P, Fabbro-Peray P, Gruber A, Leffondre K, Guillamo JS, Loiseau H, Mathoulin-Pélissier S, Salamon R, Baldi I. 2014. Mobile phone use and brain tumours in the CERENAT case-control study. Occupat Environ Med. 71:514–522.
- Deltour I, Auvinen A, Feychting M, Johansen C, Klaeboe L, Sankila R, Schüz J. 2012. Mobile phone use and incidence of glioma in the Nordic countries 1979–2008: Consistency check. Epidemiology. 23:301–307.
- Franklin KBJ, Paxinos G. 2008. The mouse brain in stereotaxic coordinates. 3rd ed. San Diego: Elsevier Academic Press.
- Gaskill BN, Gordon CJ, Pajor EA, Lucas JR, Davis JK, Garner JP. 2013. Impact of nesting material on mouse body temperature and physiology. Physiol Behav. 110–111:87–95.
- Gosling J, Joy B, Steele G, Bracha G. 2000. The Java Language Specification., 2nd ed. Englewood Cliffs (NJ): Prentice Hall.
- Hardell L, Carlberg M, Söderqvist F, Mild KH. 2013. Case-control study of the association between malignant brain tumours diagnosed between 2007 and 2009 and mobile and cordless phone use. Int J Oncol. 43:1833–1845.
- Hardell L, Carlberg M. 2015. Mobile phone and cordless phone use and the risk for glioma – analysis of pooled case-control studies in Sweden, 1997–2003 and 2007–2009. Pathophysiology. 22:1–13.
- International Agency for Research on Cancer (IARC). 2013. Non-Ionizing Radiation, Part 2: Radiofrequency Electromagnetic Fields, IARC Monograph., volume 102. Lyon, France: IARC. ISBN 9789283213253
- International Commission on Non-Ionizing Radiation Protection (ICNIRP). 1998. Guidelines for limiting exposure to time-varying electric, magnetic, and electromagnetic fields (up to 300 GHz). Health Phys. 74:494–522.
- International Commission for Non-Ionizing Radiation Protection (ICNIRP). 2009. Exposure to high frequency elecromagnetic fields, biological effects and health consequences (100 kHz – 300 GHz). ICNIRP 16/2009. ISBN 978-3-934994-10-2.
- Kanehisa M, Araki M, Goto S, Hattori M, Hirakawa M, Itoh M, Katayama T, Kawashima S, Okuda S, Tokimatsu T, Yamanishi Y. 2008. KEGG for linking genomes to life and the environment. Nucleic Acids Res. 36 (Database issue):D480–D484.
- Kanehisa M, Goto S. 2000. KEGG: Kyoto encyclopedia of genes and genomes. Nucleic Acids Res. 28:27–30.
- Kanehisa M, Goto S, Hattori M, Aoki-Kinoshita KF, Itoh M, Kawashima S, Katayama T, Araki M, Hirakawa M. 2006. From genomics to chemical genomics: New developments in KEGG. Nucleic Acids Res. 34(Database issue):D354–7.
- Kim S J-H, Ioannides SJ, Elwood JM. 2015. Trends in incidence of primary brain cancer in New Zealand, 1995 to 2010. Austral New Zeal J Public Health. 39:148–152.
- Kruskal WH, Wallis WA. 1952. Use of ranks in one-criterion variance analysis. J Am Statistical Assoc. 47:583–621.
- Lagorio S, Röösli M. 2014. Mobile phone use and risk of intracranial tumors: A consistency analysis. Bioelectromagnetics. 35:79–90.
- Leszczynski D, de Pomerai D, Koczan D, Stoll D, Franke H, Albar JP. 2012. Five years later: The current status of the use of proteomics and transcriptomics in EMF research. Proteomics. 12:2493–2509.
- Little MP, Rajaraman P, Curtis RE, Devesa SS, Inskip PD, Check DP, Linet MS. 2012. Mobile phone use and glioma risk: Comparison of epidemiological study results with incidence trends in the United States. BMJ. 344:e1147.
- Livak KJ, Schmittgen TD. 2001. Analysis of relative gene expression data using real-time quantitative PCR and the 2(-Delta Delta C(T)) Method. Methods. 25:402–408.
- McNamee JP, Chauhan V. 2009. Radiofrequency radiation and gene/protein expression: A review. Radiat Res. 172:265–287.
- Nittby H, Widegreen B, Krogh M, Grafstrom G, Berlin H, Eberhardt JL, Malmgren L, Persson BRR, Salford LG. 2008. Exposure to radiation from global system for mobile communications at 1800 MHz significantly changes gene expression in rat hippocampus and cortex. The Environmentalist. 28:458–465.
- Paparini A, Rossi P, Gianfranceschi G, Brugaletta V, Falsaperla R, De Luca P, Romano Spica V. 2008. No evidence of major transcriptional changes in the brain of mice exposed to 1800 MHz GSM signal. Bioelectromagnetics. 29:312–323.
- Poulsen AH, Friis S, Johansen C, Jensen A, Frei P, Kjaear SK, Dalton SO, Schüz J. 2013. Mobile phone use and the risk of skin cancer: A nationwide cohort study in Denmark. Am J Epidemiol. 178:190–197.
- Sanchez-Alavez M, Alboni S, Conti B. 2011. Sex- and age-specific differences in core body temperature of C57Bl/6 mice. Age. 33:89–99.
- Schmid MR, Loughran SP, Regel SJ, Murbach M, Bratic Grunauer A, Rusterholz T, Bersagliere A, Kuster N, Achermann P. 2012. Sleep EEG alterations: Effects of different pulse-modulated radio frequency electromagnetic fields. J Sleep Res. 21:50–58.
- Scientific Committee on Emerging and Newly Identified Health Risks (SCENIHR). 2015. Opinion on potential health effects of exposure to electromagnetic fields (EMF). European Commission, DG Health & Food Safety, Directorate C: Public Health. Luxembourg. ISBN 978-92-79-30134-6
- Thomas R, Gohlke JM, Stopper GF, Parham FM, Portier CJ. 2009. Choosing the right path: Enhancement of biologically relevant sets of genes or proteins using pathway structure. Genome Biol. 10:R44.
- Valentini E, Ferrara M, Presaghi F, De Gennaro L, Curcio G. 2010. Systematic review and meta-analysis of psychomotor effects of mobile phone electromagnetic fields. Occupat Environ Med. 67:708–716.
- Vanderstraeten J, Verschaeve L. 2008. Gene and protein expression following exposure to radiofrequency fields from mobile phones. Environ Health Perspect. 116:1131–1135.
- van Rongen E, Croft R, Juutilainen J, Lagroye I, Miyakoshi J, Saunders R, de Seze R, Tenforde T, Verschaeve L, Veyret B, Xu Z. 2009. Effects of radiofrequency electromagnetic fields on the human nervous system. J Toxicol Environ Health Part B: Crit Rev. 12:572–597.
- Wang H, Peng R, Zhou H, Wang S, Gao Y, Wang L, Yong Z, Zuo H, Zhao L, Dong J, Xu X, Su Z. 2013. Impairment of long-term potentiation induction is essential for the disruption of spatial memory after microwave exposure. Int J Radiat Biol. 89:1100–1107.
- Wasoontarajaroen S, Thansandote A, Gajda GB, Lemay EP, McNamee JP, Bellier PV. 2012a. Cylindrical waveguide electromagnetic exposure system for biological studies with unrestrained mice at 1.9 GHz. Health Phys. 103:268–274.
- Wasoontarajaroen S, Thansandote A, Gajda GB, Lemay EP, McNamee JP, Bellier PV. 2012b. Dosimetry evaluation of a cylindrical waveguide chamber for unrestrained small rodents at 1.9 GHz. Bioelectromagnetics. 33:575–584.
- Zhao L, Sun C, Xiong L, Yang Y, Gao Y, Wang L, Zuo H, Xu X, Dong J, Zhou H, Peng R. 2014. MicroRNAs: Novel mechanism involved in the pathogenesis of microwave exposure on rats' hippocampus. J Molec Neurosci. 53:222–230.