Abstract
The apical surface of the enterocyte is sculpted into a dense array of cylindrical microvillar protrusions by supporting actin filaments. Membrane microdomains (rafts) enriched in cholesterol and glycosphingolipids comprise roughly 50% of the microvillar membrane and play a vital role in orchestrating absorptive/digestive action of dietary nutrients at this important cellular interface. Increased membrane thickness is believed to be a morphological characteristic of rafts. Thus, we investigated whether the high contents of lipid rafts in the microvillar membrane is reflected in local variations in membrane thickness. We measured membrane thickness directly from electron micrographs of sections of fixed mucosal tissue. Indeed, mapping of the microvillar membrane revealed a biphasic distribution of membrane thickness. As a point of reference the thickness distribution of the basolateral membrane was clearly monophasic. The encountered domains of increased thickness (DITs) occupied 48% of the microvillar membrane and from the data we estimated the area of a single DIT to have a lower limit of 600 nm2. In other experiments we mapped the organization of biochemically defined lipid rafts by immunogold labeling of alkaline phosphatase, a well documented raft marker. Strikingly, the alkaline phosphatase localized to distinct regions of the membrane in a pattern similar to the observed distribution of DITs. Although we were unable to measure membrane thickness directly on the immunogold labeled specimens, and thereby establish an unequivocal connection between DITs and rafts, we conclude that the brush border membrane of the enterocyte contains microdomains distinguishable both by membrane morphology and protein composition.
Introduction
It is now broadly accepted that raft domains found in cellular membranes are of nanoscopic dimensions and have a transient and fluctuating nature, for which reason they are intrinsically difficult to monitor (van Meer et al. Citation1987, Simons and van Meer Citation1988, Simons and Ikonen Citation1997, Binder et al. Citation2003, Simons and Vaz Citation2004, Pike Citation2006, Lingwood and Simons Citation2009). The brush border of the small intestinal enterocyte, on the other hand, appears to contain rafts of a much greater extend and stability (Danielsen and Hansen Citation2006). These raft domains are formed from cholesterol and glycosphingolipids, which are scaffolded by lipid-crosslinking lectins (Thomsen et al. Citation2009) and further stabilized by recruitment of various anti-glycosyl antibodies from the lumen of the gut (Danielsen and van Deurs Citation1997, Danielsen and Hansen Citation2006).
The biochemical classification of lipid rafts is based on their resistance to detergent extraction at low temperatures and their ability to float during density gradient centrifugation (Brown and Rose Citation1992, Danielsen and Hansen Citation2006). Morphologically, it is hypothesized that raft domains are characterized by increased membrane thickness, as compared to the surrounding lipid matrix (Simons and Ikonen Citation1997). If this is true, it should be possible to monitor the raft domains of the enterocyte microvillar membrane by using membrane thickness as an intrinsic marker. To test this idea we performed measurements of membrane thickness by quantitative analysis of high-magnification electron micrographs.
We found that the microvillar membrane of the enterocyte exhibits a biphasic distribution of membrane thickness, thus indicating the presence of heterogeneous domains. As a point of reference we measured the thickness of the basolateral membrane, which, in contrast, followed a clear monophasic distribution. The mean thickness of the basolateral membrane (3.98 nm) was lower than the absolute thickness of the microvillar membrane, in good agreement with expectations based on lipid and protein composition. By tracking thickness transitions along the microvillar membrane we performed a rough lower estimate for the size of the resolved domains of increased membrane thickness (DITs) as 10 × 60 nm2, with the long side aligned along the microvillus cylinder axis. DITs comprised 48% of the microvillar membrane which agreed very well with the contents of raft domains (47%) estimated from previous experiments with purified microvillar vesicles (Hansen et al. Citation2001).
To more directly investigate the potential relation of DITs and biochemically defined lipid rafts we examined thin sections of microvilli immunogold labeled for alkaline phosphatase, a GPI-anchored enzyme residing in the raft domains of microvillar membranes (Danielsen Citation1995) and which furthermore has been shown by others to localize to DITs in a synthetic model membrane system (Saslowsky et al. Citation2002). The alkaline phosphatase strikingly localized to specific sites on the microvillar membrane showing that biochemically defined raft domains are organized in a qualitatively similar fashion to DITs. Although technical limitations hindered the examination of membrane thickness on the immunogold labeled samples our data demonstrate that heterogeneous microdomains distinguished both by membrane morphology and protein composition decorate the brush border membrane of the enterocyte.
Methods
Electron microscopy
Small pieces of pig small intestines were fixed in 3% glutaraldehyde and 2% paraformaldehyde in 0.1 M sodium phosphate buffer, pH 7.2, for 30 min at 4°C. After a wash in 0.1 M sodium phosphate buffer, pH 7.2, the pig small intestines were postfixed in 1% osmium tetroxide in 0.1 M sodium phosphate buffer, pH 7.2, for 1 h at 0°C and subsequently dehydrated in ethanol and embedded in Epon according to standard procedures (Danielsen Citation1995, Hansen et al. Citation2001). Ultrathin Epon sections were cut on an LKB Ultrotome III ultramicrotome and collected on grids previously rinsed in 20% acetic acid, 99% ethanol and water. The sections were stained in 1% uranyl acetate in water and in lead citrate and finally examined in a Zeiss EM 900 electron microscope equipped with a Mega View II camera. The staining of the specimen with osmium tetroxide serves a two-fold purpose: (i) Fixation of phospholipid material, and (ii) heavy atom labelling of phospholipid headgroups (Palade Citation1952, Silva et al. Citation1968). The latter is required for visualization and accurate identification of inner and outer leaflets. The applied staining protocol ensures that the osmiumtetroxide diffuses through the entire thin section (Hopwood Citation1970, Hayat Citation2000).
Immunogold labeling
Immunogold labeling of ultrathin Epon sections was performed as previously described (Hansen et al. Citation1992). Briefly, the sections were incubated overnight at 4°C and for 1 h at room temperature with rabbit anti-aminopeptidase N (Hansen et al. Citation1992) and sheep anti-alkaline phosphatase (Abcam), respectively. The sections were then treated with sheep anti-rabbit antibodies (Sigma-Aldrich) conjugated to 7 nm gold particles prepared according to Slot and Geuze (Citation1985) and to gold-conjugated (5 nm) protein G (Sigma-Aldrich), respectively. The sections were examined after staining in 1% uranyl acetate in water for 2 min. and in lead citrate for 30 s.
Analysis of membrane thickness
Membrane thickness was analyzed using custom programmed software written in Igor Pro version 6.0 (Wavemetrics, Lake Oswego, OR, USA). The software conducted several steps of analysis: To locate positions of both inner and outer leaflets several line profiles were analyzed. This was performed by selecting a segment of the membrane for analysis. Within this selection line profiles were automatically created and analyzed for intensity minima from which coordinates of leaflet positions were obtained. On the basis of these data, traces of inner and outer leaflets were constructed. The headgroup-to-headgroup thickness along the membrane was then calculated by simple geometrical equations based on relative leaflet positions. A more detailed description of the custom-made image analysis software can be found in the Supplementary Material (available online).
Results and discussion
Ultrastructural imaging of small intestinal enterocytes
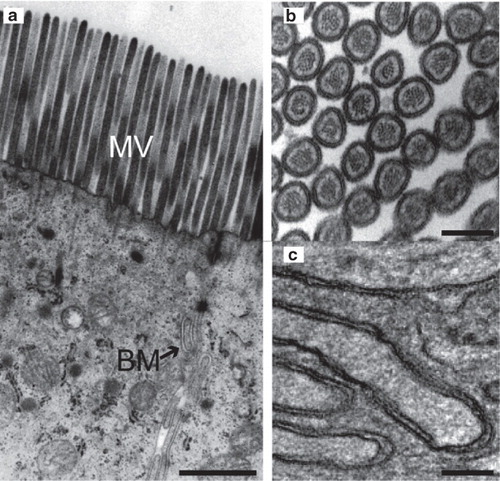
shows the apical part of an enterocyte. In measuring membrane thickness it is important to avoid artifacts caused by an asymmetric projection through the Epon section. For this reason we only selected images of microvilli cut in a plane normal to the cylinder axis, as shown in . The microvilli thus appear as circular structures on the electron micrograph but they are easily distinguished by the presence of the supporting actin filament in their core. The characteristic meandering shape (), identifies the basolateral membrane. In the case of the basolateral membrane only the planar regions exhibited an adequate signal-to-noise ratio to permit thickness examination. The more blurry appearance of the kinks most likely reflects that these regions of the membrane are curved in the third dimension as well, i.e., along the axis of projection.
Figure 1. Ultrastructural imaging of enterocyte membranes. (a) Electron micrograph of the apical part of an enterocyte showing microvilli (MV) and the basolateral membrane (BM). (b,c) Larger magnification of cross-sectional view of microvilli (b) and the basolateral membrane (c). Bars: a. 500 nm, b. 100 nm and c. 200 nm.
Quantitative measurements of membrane thickness
To determine membrane thicknesses we analyzed intensity profiles from high magnification electron micrographs of the basolateral and the microvillar membrane (). shows a characteristic intensity profile collected along the red line on the micrograph in . The two intensity minima mark the boundaries between the lipid matrix and the more electron dense exterior of the membrane composed of phospholipid headgroups and proteins. By localizing the minima in multiple profiles we tracked the positions of the two leaflets ( and ) to obtain a trace of the membrane thickness ( and ). All image analysis was performed using custom written software for Igor Pro v6.0 (see Methods and Supplementary Material, Figure S1, available online, for a detailed description of the procedure).
Figure 2. Thickness of basolateral and microvillar membranes. (a) Electron micrograph of the basolateral enterocyte membrane. (b) Intensity profile along the line shown in (a). Intensity values are inversely proportional to the degree of staining, i.e., low staining yields high intensity. Intensity minima reveal the location of the inner and outer leaflets of the membrane. (c) Inner and outer leaflets identified from several lineprofiles and overlayed as lines on the micrograph from (a). (d) Membrane thickness between the leaflets shown in (c). The average thickness value of the trace is indicated as t0. (e) Inner and outer leaflets identified in a microvillar membrane using identical approach as in (c). (f) Trace of the microvillar membrane thickness plotted along with the average value. (g) Distribution of membrane thickness for the basolateral membrane. The data show a pronounced Gaussian distribution of the measured membrane thickness. Data were fitted with a single Gaussian. (h) Examination of the microvillar membrane revealed a biphasic thickness distribution. The data were fitted with a double Gaussian. (i) Bar diagram representation of the mean membrane thickness obtained by fitting the distributions in (g) and (h). The error bars indicate the standard deviation of the mean obtained from the fits. Bars: 20 nm.
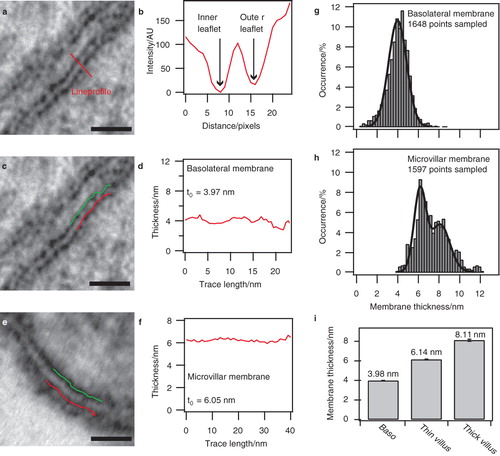
We observed a significant increase of 2.08 nm in average thickness from the basolateral () to the microvillar membrane (), thus verifying the general assumption that the latter is the thicker. The ability to continuously track thickness along the membrane coordinate is a feature that allows the mapping of spatial membrane heterogeneity.
We found that the single traces of membrane thickness oscillated around the mean value. The origin of the fluctuations was difficult to identify unambiguously, but was mainly attributed to inhomogeneous membrane staining, background noise from the charge coupled device camera and local variations in membrane morphology. To distinguish oscillations caused by noise from true physical variations in membrane thickness we collected sufficient data-points in order to conduct a reliable statistical analysis.
Identifying heterogeneities from membrane thickness distributions
To examine the basolateral and microvillar membrane for heterogeneities in the form of DITs, we constructed thickness distribution histograms (). In the scenario of a homogeneous membrane with one well-defined characteristic thickness (t0), measurements are expected to follow a Gaussian distribution peaking at t0. Conversely, a membrane containing domains of various thicknesses would give rise to a distribution with several peaks.
The histogram constructed of data from the basolateral membrane resembled a smooth Gaussian distribution (). We fitted this distribution with a Gaussian function, which yielded a peak at 3.98 nm. Interestingly, examination of the microvillar membrane revealed a bi- rather than a mono-phasic distribution that could be fitted with the sum of two Gaussians peaking at 6.14 nm and 8.11 nm, respectively (). The biphasic distribution shows that the membrane displays two characteristic thicknesses. The data from the fits are summarized in .
In accordance with the initial estimation of t0 based on single thickness traces ( and ) we conclude from the statistical analysis that the microvillar membrane is significantly thicker than the basolateral membrane. A factor that might contribute to this difference is its relatively higher contents of integral membrane proteins (Mitra et al. Citation2004).
The measured mean thickness of the basolateral membrane is very close to the thickness of liquid disordered bilayers composed of the two main constituents of the plasma membrane; dipalmitoylphosphatidylcholine (DPPC) and dioleylphosphatidylcholine (DOPC) (thicknesses 3.78 nm and 3.60 nm, respectively) (Gandhavadi et al. Citation2002, Kucerka et al. Citation2006). As DOPC/DPPC constitutes 50 mol% of the basolateral membrane our data strongly suggests that the thickness of this membrane is mainly governed by the majority of its lipid constituents and only slightly perturbed by the presence of membrane associated proteins and glycolipids/cholesterol. This observation indicates that raft domains, if present, are small and only constitute a minor fraction of the entire basolateral membrane area, thus rendering us unable to resolve them in a thickness histogram.
In contrast to the basolateral membrane, the microvillar membrane exhibited a biphasic thickness distribution with a peak-to-peak separation of 1.97 nm. The measured membrane thickness of 8.14 nm most likely reflects a composite of the fatty acid matrix, the sugar lipid headgroups and tightly associated peripheral proteins (Frey et al. Citation2008). We obtained the relative amount of DITs by calculating the area of each of the two Gaussian thickness distributions. This approach yielded a 1.08 ratio of non-DIT to DIT contents in the microvillar membrane. We compare this ratio to a value of 1.12 inferred from previous published biochemical quantitation of raft and non-raft membranes performed on purified microvillar vesicles, see Supplementary Material Figure S2, available online. The similarity between these two values alludes to a correlation between DITs and lipid rafts.
Size and superstructural organization of DITs
Finally, we investigated the lateral extent of the DITs in the microvillar membrane by analyzing membrane thickness traces for transitions between high and low values (). The average trace length was 30 nm. If a DIT spans several 100 nm2 we would expect traces to be exclusively composed of either DITs or non-DITs. Only a minority of the traces would then exhibit transitions. In the case of DITs spanning only a few nm2, several thickness transitions would be present in the majority of the traces. We used the peak values of the microvillar biphasic thickness distribution to define two levels: A DIT level with an average thickness of 8.11 nm and a non-DIT level of 6.14 nm. Consequently, we defined a transition as a shift between these two levels within a trace.
Figure 3. Thickness transitions in the microvillar membrane: (a) Sketch of the lipid bilayer membrane comprising the microvillar membrane of the enterocyte. (b-d): Thickness traces showing DIT/non-DIT transitions obtained from micrographs of microvillar membranes. Dashed lines mark the average thickness of non-DIT regions, whereas solid lines specify average DIT thickness.
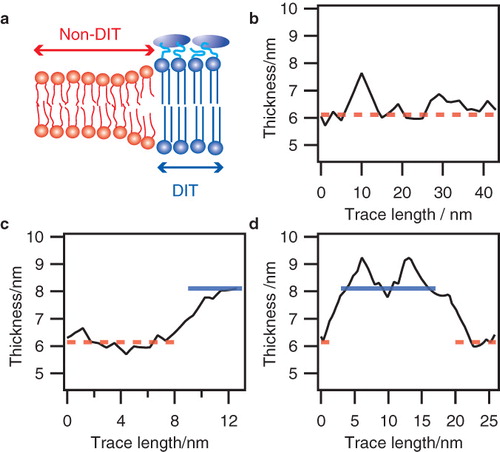
We examined all collected data from the microvillar membrane to quantify the relative amount of traces containing transitions. None of the investigated traces exhibited more than two transitions. Shown in are three sample traces displaying none (b), one (c) and two (d) transitions (see Supplementary Material Figure S3, available online, for additional traces and corresponding micrographs). Of all inspected traces 81.2% exhibited one while 4.8% exhibited two transitions. This finding indicates that the domain size along the microvillar periphery is of the same order of magnitude as the trace length, i.e., approximately 10–40 nm.
The fact that we could resolve DIT transitions using the described approach implies that the extent of domains along the microvillus tubule is at least of the same order as the ultrathin section (∼ 60 nm). If the domains were to be shorter, the membrane would appear as a composite of both DIT and non-DIT leaflets on the micrograph, thus resulting in a single (average) thickness-value and not the observed transitions. We thus estimate the observed domains in microvillar membranes to have a minimum area of 10 × 60 nm2. This led us to propose a model where the DITs have an elongated shape and are aligned along the microvillus cylinder axis in a superstructural motif reminiscent of a pinstripe pattern (see ).
Figure 4. Superstructural organization of the microvillar membrane. (a) Cross-sectional view of a microvillus subjected to membrane thickness analysis. The average thickness of blue traces is closer to the DIT-level at 8.11 nm than the non-DIT at 6.14 nm, and vice versa for the red traces. (b) Membrane thickness as measured on the traces in (a) with horizontal lines at the DIT-level (blue) and non-DIT level (red). The white arrow in (a) indicates the direction of analysis. (c) Representative micrographs showing the spatial distribution of raft domains in microvilli, as visualized by immunogold-labelling of the raft-marker alkaline phosphatase. (d) Micrographs showing the homogeneous distribution of immunogold-labelled aminopeptidase N, which is known to partition equally into raft and non-raft membranes. (e) Model of DIT organization in microvilli. Cross-sectional view of microvillus with submicron DITs (blue) and non-DITs (red) dispersed in a pinstripe pattern. Bars: 50 nm.
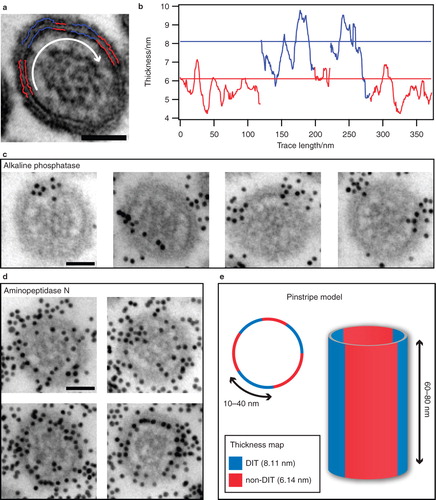
The significant abundance and size of the encountered DITs suggests a connection to biochemically defined lipid rafts (Hansen et al. Citation2001). To further elucidate this link we investigated whether lipid rafts, as identified by protein composition, exhibited an organization similar to that observed for the DITs. This was achieved by immunogold labeling (Hansen et al. Citation1992) of GPI-anchored alkaline phosphatase, which is an established marker of microvillar lipid rafts (Danielsen Citation1995). Importantly, GPI-anchored alkaline phosphatase has also been shown to localize to DITs in a synthetic supported bilayer making it an ideal labeling target for our purpose (Saslowsky et al. Citation2002). shows a microvillus displaying both DIT and non-DIT regions (horizontal lines) as identified from the corresponding membrane thickness traces, . shows representative microvilli labeled for alkaline phosphatase. The alkaline phosphatase indeed localized to distinct microdomains of the microvillar membrane. As a control we examined microvilli immunogold labeled for aminopeptidase N (), which is known to be evenly distributed among raft and non-raft domains (Danielsen Citation1995). As expected, the aminopeptidase N exhibited a random distribution over the membrane (the relatively higher density of particles on as compared to is a consequence of different affinities of the applied antibodies for their antigens and the relative abundance of the two proteins in the membrane). Overview micrographs from the two experiments are shown in Supplementary Material Figure S4, available online. It was not possible to obtain sufficient contrast on the membrane in the immunogold labeling experiments in order to permit thickness measurements. This is, however, not surprising in view of the fact that the preparation protocol involves passivation of the thin section with bovine serum albumin (BSA), which blurs the ultrastructure upon staining. From the immunogold labeling experiments we conclude that biochemically defined lipid rafts exist as clearly distinguishable microdomains in the microvillar membrane and that these rafts furthermore are organized in a pattern qualitatively resembling the pinstripe-like organization of DITs.
Whether DITs are equivalent to raft domains remains to be finally proven. However, given that we observed thickness heterogeneities in microvillar membranes that are known to have a high contents of rafts, given the close correspondence of the relative abundance of rafts and DITs (respectively 47% and 48% of the membrane) and finally the good agreement between DIT and raft organization, as revealed by immunogold labeling of a raft localized protein, we find it reasonable to expect that the thickest membrane domains are in fact lipid rafts. In the perspective of membrane architecture, our results document that the apical surface of the enterocyte has a secondary structure that is characterized by microdomains both in the form of membrane-associated proteins and membrane morphology. We believe that this advanced example of superstructural membrane architecture must have physiological relevance.
Supplementary Material
Download MS Word (51.5 KB)Supplementary Material
Download JPEG Image (1.1 MB)
Supplementary Material
Download JPEG Image (315.1 KB)
Supplementary Material
Download JPEG Image (639.3 KB)
Supplementary Material
Download JPEG Image (1.1 MB)
Acknowledgements
We thank Lise-Lotte Niels-Christiansen for excellent technical assistance.
Declaration of interest: The work was supported by grants from the Novo-Nordic Foundation, the Beckett Foundation, the Augustinus Foundation, Brødrene Hartmanns Fond and Aase and Ejnar Danielsens Fond. The authors report no conflicts of interest. The authors alone are responsible for the content and writing of the paper.
References
- Binder WH, Barragan V, Menger FM. 2003. Domains and rafts in lipid membranes. Angew Chem Int Ed Engl 42:5802–5827.
- Brown DA, Rose JK. 1992. Sorting of GPI-anchored proteins to glycolipid-enriched membrane subdomains during transport to the apical cell surface. Cell 68:533–544.
- Danielsen EM. 1995. Involvement of detergent-insoluble complexes in the intracellular transport of intestinal brush border enzymes. Biochemistry 34:1596–1605.
- Danielsen EM, van Deurs B. 1997. Galectin-4 and small intestinal brush border enzymes form clusters. Mol Biol Cell 8:2241–2251.
- Danielsen EM, Hansen GH. 2006. Lipid raft organization and function in brush borders of epithelial cells (Review). Mol Membr Biol 23:71–79.
- Frey SL, Chi EY, Arratia C, Majewski J, Kjaer K, Lee KYC. 2008. Condensing and fluidizing effects of ganglioside G(M1) on phospholipid films. Biophys J 94:3047–3064.
- Gandhavadi M, Allende D, Vidal A, Simon SA, McIntosh TJ. 2002. Structure, composition, and peptide binding properties of detergent soluble bilayers and detergent, resistant rafts. Biophys J 82:1469–1482.
- Hansen GH, Wetterberg LL, Sjostrom H, Noren O. 1992. Immunogold labelling is a quantitative method as demonstrated by studies on aminopeptidase N in microvillar membrane vesicles. Histochem J 24:132–136.
- Hansen GH, Immerdal L, Thorsen E, Niels-Christiansen LL, Nystrom BT, Demant EJF, Danielsen EM. 2001. Lipid rafts exist as stable cholesterol-independent microdomains in the brush border membrane of enterocytes. J Biol Chem 276:32338–32344.
- Hayat MA 2000. Principles and techniques of electron microscopy: Biological applications. Cambridge, UK: Cambridge University Press.
- Hopwood D. 1970. The reactions between formaldehyde, glutaraldehyde and osmium tetroxide, and their fixation effects on bovine serum albumin and on tissue blocks. Histochemie 24:50–64.
- Kucerka N, Tristram-Nagle S, Nagle JF. 2006. Closer look at structure of fully hydrated fluid phase DPPC bilayers. Biophys J 90:L83–85.
- Lingwood D, Simons K. 2009. Lipid rafts as a membrane-organizing principle. Science 327:46–50.
- Mitra K, Ubarretxena-Belandia T, Taguchi T, Warren G, Engelman DM. 2004. Modulation of the bilayer thickness of exocytic pathway membranes by membrane proteins rather than cholesterol. Proc Natl Acad Sci USA 101:4083–4088.
- Palade GE. 1952. A study of fixation for electron microscopy. J Exp Med 95:285–298.
- Pike LJ. 2006. Rafts defined: A report on the Keystone Symposium on Lipid Rafts and Cell Function. J Lipid Res 47:1597–1598.
- Saslowsky DE, Lawrence J, Ren XY, Brown DA, Henderson RM, Edwardson JM. 2002. Placental alkaline phosphatase is efficiently targeted to rafts in supported lipid bilayers. J Biol Chem 277:26966–26970.
- Silva MT, Guerra FC, Magalhaes M. 1968. Fixative action of uranyl acetate in electron microscopy. Experientia 24:1074–1074.
- Simons K, van Meer G. 1988. Lipid sorting in epithelial-cells. Biochemistry 27:6197–6202.
- Simons K, Ikonen E. 1997. Functional rafts in cell membranes. Nature 387:569–572.
- Simons K, Vaz WL. 2004. Model systems, lipid rafts, and cell membranes. Annu Rev Biophys Biomol Struct 33:269–295.
- Slot JW, Geuze HJ. 1985. A new method of preparing gold probes for multiple-labeling cytochemistry. Eur J Cell Biol 38:87–93.
- Thomsen MK, Hansen GH, Danielsen EM. 2009. Galectin-2 at the enterocyte brush border of the small intestine. Mol Membr Biol 26:347–355.
- van Meer G, Stelzer EHK, Wijnaendts-van-Resandt RW, Simons K. 1987. Sorting of sphingolipids in epithelial (Madin-Darby canine kidney) cells. J Cell Biol 105:1623–1635.