Abstract
The in vitro culture of cells offers an extremely valuable method for probing biochemical questions and many commonly-used protocols are available. For mammalian cells a source of lipid is usually provided in the serum component. In this study we examined the question as to whether the nature of the lipid could become limiting at high cell densities and, therefore, prospectively influence the metabolism and physiology of the cells themselves. When B16 mouse melanoma cells were cultured, we noted a marked decrease in the proportions of n-3 and n-6 polyunsaturated fatty acids (PUFAs) with increasing cell density. This was despite considerable quantities of these PUFAs still remaining in the culture medium and seemed to reflect the preferential uptake of unesterified PUFA rather than other lipid classes from the media. The reduction in B16 total PUFA was reflected in changes in about 70% of the molecular species of membrane phosphoglycerides which were analysed by mass spectrometry. The importance of this finding lies in the need for n-3 and n-6 PUFA in mammalian cells (which cannot synthesize their own). Although the cholesterol content of cells was unchanged the amount of cholesterol enrichment in membrane rafts (as assessed by fluorescence) was severely decreased, simultaneous with a reduced heat shock response following exposure to 42°C. These data emphasize the pivotal role of nutrient supply (in this case for PUFAs) in modifying responses to stress and highlight the need for the careful control of culture conditions when assessing cellular responses in vitro.
Introduction
Tissue culture is an important tool for the study of the biology of cells from multicellular organisms. It provides an in vitro model of the tissue in a well-defined environment which can be easily manipulated and analysed and which allows the investigator to design comprehensive studies and collect reproducible data (Birt Citation1997). The usual culture media are supplemented with serum that is relatively rich in lipids, including lipoproteins and free fatty acids (FFA). Almost three decades ago extensive research was conducted by several groups in order to understand how lipids from serum (with different origins: human, horse, bovine, fetal calf etc.) are taken up and utilized by mammalian cells in culture (Howard and Howard Citation1974, Spector et al. Citation1980). It became clear that cells can rapidly take up free or unesterified fatty acids (FFAs), and at slower rate also complex lipids and utilize them as a source of energy and as building blocks for membrane lipid synthesis during cell growth (Spector et al. Citation1980). The differences in lipid and fatty acid (FA) compositions of sera were found to be reflected in the FA composition of cultured cells (Bailey et al. Citation1973, Wiegand and Wood Citation1974, Citation1975, Spector et al. Citation1980). It was noted that fetal calf serum (FCS), the most widely used medium supplement in cell biology, contains considerably less lipid than some other preparations (Spector et al. Citation1980, Lagarde et al. Citation1984). Lagarde et al. demonstrated in 1984 that phospholipids from endothelial cells cultured in the presence of FCS are strongly depleted in polyunsaturated fatty acids (PUFAs), especially in arachidonic acid (20:4 n-6, AA) (Lagarde et al. Citation1984). Although by now cell culturing has been largely standardized and carried out routinely, the above facts are considered only in sporadic reports (Tombaccini et al. Citation1981, Rouzer et al. Citation2006, Marazzi et al. Citation2011). In turn, PUFA depletion of cellular membranes may have serious consequencies.
Many PUFAs are known to be necessary for growth and well-being in mammals but they cannot be synthesized by them. One of the characteristic features of several diseases, such as cancer, type 2 diabetes, coronary heart disease, stroke or neurodegenerative, is low-grade systemic inflammation, which is in close connection with a PUFA-deficient state (Das Citation2011). PUFA status was studied and found to be a determining factor in inflammatory processes in vitro, too (Hurst et al. Citation2009, Citation2010). PUFAs can influence inflammation through a variety of mechanisms. Some of these appear to be mediated by changes in the FA composition of cell membranes that can modify membrane fluidity, lipid microdomain formation, cell signalling leading to altered gene expression, the pattern of lipid and peptide mediator production (Calder Citation2011), and the activities of many membrane-associated enzymes and transporters (Vigh et al. Citation1998).
A further important aspect of these changes is the altered stress response of organisms. The membrane sensor hypothesis states that, besides other possible sensors, membranes respond rapidly to environmental changes and, as a consequence of alterations in their phase state, lipid composition and microdomain organization, and by releasing lipid mediators, transmit heat shock (HS) signals that ultimately lead to heat shock protein (Hsp) expression (Vigh et al. Citation1998, Citation2007a). All steps of the heat shock response (HSR), i.e., membrane alterations, signal pathways from membranes to hsp genes and Hsps themselves, play fundamental roles in the aetiology of all of the above listed diseases, e.g., cancer and type 2 diabetes (Escribá et al. Citation2008). It is, therefore, reasonable to suggest that PUFA status and the ability of cells to respond to stress might be closely connected. For example, AA, one of the most important PUFA and precursor of a broad array of biologically active compounds, is a known and potent HSR modulator (Jurivich et al. Citation1994, Horváth et al. Citation2008, Balogh et al. Citation2010). Consequently, culture conditions that can alter membrane lipid composition, may also affect the HSR. Moreover, the modulation in Hsp expression caused by plating density variation was studied by Noonan et al. (Citation2007). They found that the activation of two human Hsp70 family members was cell number-dependent after HS in colon carcinoma cell lines. Very recently we provided evidence that just modulating the plating density considerably altered the hsp25 gene inducibility of B16 cells (Gombos et al. Citation2011). Importantly, this phenomenon was paralleled by profound changes in both the cholesterol (Chol) level and size distribution of pre-existing Chol-rich plasma membrane domains that are considered as the main sites of signalling processes.
The above findings prompted us to unravel possible interrelationships between culture conditions, membrane status and HSR. The FA and lipid composition of the highly proliferative B16 mouse melanoma cell line cultured with different initial cell densities and serum concentrations were compared by means of mass spectrometric techniques. In parallel, the same properties of growth media were also analysed and correlated with cell data. Membrane microdomain organizational changes were detected by fluorescence microscopy. The HSR was monitored by testing inducibilities of major heat shock genes, hsp25 and hsp70, of cells plated with different densities. We show that, under different culturing conditions, the usual experimental set-up, i.e., one day in culture, markedly resets the FA and lipid composition, and microdomain organization of cell membranes and, as a consequence, dramatically alters their stress inducibility.
Methods
Materials
Lipid standards were obtained from Avanti Polar Lipids (Alabaster, AL, USA). The solvents used for extraction and for mass spectrometric analyses were of gas or liquid chromatographic grade from Merck (Darmstadt, Germany). All other chemicals were purchased from Sigma and were of the best available grade.
Cell culturing and treatments
B16(F10) (ATCC CRL-6475) mouse melanoma cells were cultured in RPMI-1640 medium supplemented with fetal calf serum (FCS) and 4 mM L-glutamine in a humidified 5% CO2, 95% air atmosphere at 37°C. Cells were plated with different initial cell densities in the range of 1.5–12 × 106 cells/10 cm plate) in 10 ml medium containing 10% FCS or at 3 × 10⁶ cells/10 cm plate in 10 ml medium containing FCS in the range of 0–20% and cultured for one day. For further analysis, the cells were washed three times with phosphate-buffered saline (PBS), scraped, centrifuged, and the pellet was resuspended in a small amount of ice-cold water followed by protein content determination with the Bio-Rad protein assay kit using the protocol recommended by the manufacturer.
For heat shock experiments, after one day of growth the plates were immersed in a water bath set to 42°C for 1 h. The hsp mRNA levels and the hsp promoter activity were quantified immediately and after a 16-h recovery period, respectively.
Lipid extraction
Lipids were extracted according to a modified Folch procedure (Folch et al. Citation1957). Briefly, to 1 ml of cell suspension (diluted to this amount with water if necessary), 2.5 ml methanol (containing 0.001% butylated hydroxytoluene as antioxidant) and 1.25 ml chloroform were added to form one phase (chloroform:methanol:water [1:2:0.8, by vol.]). The mixture was left at room temperature for 1 h with periodical vortexing, then 3.75 ml chloroform and 0.88 ml 0.2 M KCl were added for phase separation to occur (final composition of chloroform: methanol:water [2:1:0.75, by vol.]). After vortexing, the sample was centrifuged at 600 g for 10 min and the lower chloroform phase, containing lipids, was evaporated and the residue was redissolved in chloroform:methanol (2:1, by vol.). The extraction of growth medium (5 ml) was performed in the same way.
Lipid analysis using GC-MS
FA compositional analysis and the FA concentration of total lipid extracts were carried out by a gas chromatography-mass spectrometry (GC-MS) system (GCMS-QP2010, Shimadzu) equipped with a BPX-70 capillary column (10 m × 0.1 mm × 0.2 μm film thickness). An aliquot of the extracts (corresponding to 10 μg protein) was methylated in 1 ml 5% acetyl chloride in methanol at 80°C for 2 h in the presence of C15:0 FFA as internal standard. The resulting fatty acid methyl esters (FAME) were extracted with hexane, the solvent was evaporated and the residue redissolved in 50 μl benzene. A 1-μl aliquot was injected onto the column maintained at 150°C for 2 min, programmed at 6°C/min to 215°C, then at 20°C/min to 235°C and maintained isothermally for 2 min. Identification and calibration of FAMEs was made by comparison with authentic standards (FAME mix, Sigma) and confirmed with NIST (National Institute of Standards and Technology, Gaithersburg, MD 20899-8380, USA) MS library spectra. FAME analysis was done in the selected ion monitoring mode, which allowed ca. 10-fold sensitivity improvement. Fragment ions including m/z 67, 74, 79, 81, 83, 87, and 91 for FAMEs and m/z 75 for dimethyl acetals (formed from plasmalogen species) were recorded.
Total FA and lipid class analyses of growth media were also carried out as described above. After one day in culture the growth medium was collected, centrifuged and a 5-ml aliquot was extracted for GC-MS FA analysis. Neutral lipids were separated on Kieselgel 60 silica gel TLC plates (Merck) using hexane:diethylether:acetic acid (85:25:2, by vol.). The lipid classes of interest (i.e., total polar lipid fraction (TPL), free (non-esterified) fatty acid (FFA), triacylglycerol (TG) and cholesteryl ester CE) were identified using authentic standards visualized with 8-anilinonaphtalene-1-sulfonate (0.05% in methanol) under UV. For the spots a known amount of C15:0 FFA was added as an internal standard for quantitation. The spots were scraped and the scrapings were directly methylated and analysed as above.
Quantitative analysis of lipid classes using ESI-MS/MS
Lipids were analysed by electrospray ionization tandem mass spectrometry (ESI-MS/MS) in positive ion mode (Brügger et al. Citation1997) using a triple quadrupole mass spectrometer (Quattro Ultima, Micromass, Manchester, UK). The following lipid classes were monitored: diacyl and 1-alkyl-2-acyl species of PC (PC and PC-O), lysophosphatidylcholine (LPC), diacyl phosphatidylethanolamine (PE), 1-(1Z-alkenyl)-2-acyl species of PE (PE-P), phosphatidylglycerol (PG), phosphatidylinositol (PI), phosphatidylserine (PS), sphingomyelin (SM), ceramide (Cer), Chol and CE. To quantify these lipid classes, specific lipid molecular species in chloroform were added as internal standards to the total lipid extract as follows: PC(14:0/14:0), PC(22:0/22:0), PE(14:0/14:0), PE(20:0/20:0) (di-phytanoyl), PS(14:0/14:0), PS(20:0/20:0) (di-phytanoyl), PG(14:0/14:0), PG(20:0/20:0) (di-phytanoyl), PI(16:0/16:0), LPC (13:0), LPC(19:0), Cer(d18:1/14:0), Cer(d18:1/17:0), deuterated D7- Chol, CE17:0 and CE22:0. The mixture was dried under nitrogen and redissolved in methanol:chloroform (3:1, by vol.) containing 10 mM ammonium acetate at a concentration of 40 μg FA/ml of the total lipid extract. 20 μl of this solution was injected and data were acquired for 1.3 min. Samples were quantified by direct flow injection employing the analytical set-up and the data analysis algorithms as described previously (Liebisch et al. Citation2004). A precursor ion scan of m/z 184 specific for phosphocholine-containing lipids was used for PC, SM (Liebisch et al. Citation2004) and LPC (Liebisch et al. Citation2002). Neutral loss scans of m/z 141 and m/z 185 were used for PE and PS, respectively (Brügger et al. Citation1997). Fragment ions of m/z 364, 380 and 382 were used for the plasmalogen PE species containing 16:0, 18:0 and 18:1 in the sn-1 position, respectively (Zemski et al. Citation2004). Ammonium-adduct ions of PG and PI were analysed by neutral loss scans of m/z 189 and 277, respectively (Matyash et al. Citation2008). Chol and CE were quantified after acetylation using a fragment ion of m/z 369 (Liebisch et al. Citation2006). Sphingosine (d18:1)-based Cer were analysed by product ion of m/z 264 similar to a previously described method (Liebisch et al. Citation1999). After identification of relevant lipid species, selected reaction monitoring analysis was performed to increase precision of the analysis for the following lipid classes: PE, PE-P, PG, PI, PS, LPC, Cer and CE. Quantification was achieved by calibration lines generated by the addition of naturally-occurring lipid species to cell homogenates (Leidl et al. Citation2008). All lipid classes were quantified with internal standards belonging to the same lipid class, except SM (PC internal standard) and PE-based plasmalogens (PE internal standards). Calibration lines were generated for the following naturally-occurring species: PC(34:1), (36:2), (38:4), (40:0) and PC(O-16:0/20:4); SM(d18:1/16:0), (d18:1/18:1), (d18:1/18:0); LPC(16:0), (18:1), (18:0); PE(34:1), (36:2), (38:4), (40:6) and PE(P-16:0/20:4); PS(34:1), (36:2), (38:4), (40:6); Cer (d18:1/16:0), (d18:1/18:0), (d18:1/20:0), (d18:1/24:1), (d18:1/24:0); Chol, CE 16:0, 18:2, 18:1, 18:0. These calibration lines also were applied for uncalibrated species, as follows: Concentrations of saturated, monounsaturated and polyunsaturated species were calculated using the closest related saturated, monounsaturated and polyunsaturated calibration line slope, respectively. For example PE(36:2) calibration was used for PE(36:3), PE(36:4); PE(38:4) calibration was used for PE(38:3) and PE(38:5) and so on. Alkyl ether PC species were calibrated using PC(O-16:0/20:4) and PE-based plasmalogens were quantified independent of the length of the ether-linked alkyl chain using PE(P-16:0/20:4).
Annotation of lipid species
Lipid species were annotated according to the updated comprehensive classification system for lipids (Fahy et al. Citation2009). For glycerophospholipids, the ‘Headgroup (sn-1/sn-2)’ format specifies one or two radyl side chains where the structures of the side chains are indicated within parentheses, e.g., PC(16:0/18:1). In cases where the glycerophospholipid total composition was known, but side chain regiochemistry was unknown, abbreviations, such as PE(36:1), were used to indicate total numbers of carbons and double bonds for both chains. Presence of an alkyl ether linkage typically at sn-1 of glycerol was represented by an ‘O-’ identifier (also referred as plasmanyl species), as in PC(O- 34:1), whereas ‘P-’ denotes a 1Z-alkenyl ether (vinyl ether) linkage typically at the sn-1 position (also referred as plasmenyl species or plasmalogens), as in PE(P-16:0/18:1). Lysophospholipids were specified with a letter ‘L’ in the abbreviation, for example, LPC(16:0). For sphingolipids, first the number of hydroxyl groups (e.g., ‘d’ for the two hydroxyls of sphingosine and sphinganine), the number of carbon atoms and then the number of double bonds are indicated followed by the N-acyl chain composition, such as SM(d18:1/16:0).
Quantitative real-time RT-PCR
RNA was isolated by using the NucleoSpin RNA II kit (Macherey-Nagel, Duren, Germany). Two micrograms of RNA was reverse-transcribed through use of the RevertAid H Minus First Strand cDNA Synthesis kit (Fermentas, St. Leon-Rot, Germany). Hsp70 (Mm01159846s1), hsp25 (Mm00834384_g1) and β-actin (Mm00607939s1) primers with TaqMan probes were purchased from Applied Biosystems (Foster City, CA, USA). TaqMan Universal PCR Master Mix (Applied Biosystems) was used to prepare the reaction mixes. The PCR runs were performed in a Rotor-Gene 3000 instrument (Corbett Research, Sydney, Australia). Relative quantities of mRNAs were normalized to β-actin.
DNA constructs, transfection, and clonal cell line isolation
The plasmid containing the human hsp70 promoter fused to YFP (pEYFP-N1, Clontech) was a kind gift of Lea Sistonen (Åbo Akademi University, Turku, Finland). The plasmid was transfected into B16(F10) cells using ExGene according to the manufacturer's instructions. Stable clones were selected using 300 μg/ml G418. G418–resistant clones were then tested for YFP expression using heat treatment. A single clone exhibiting high heat-induced expression and low basal levels of YFP fluorescence was selected for further studies.
Flow cytometry
Cells were harvested with trypsin-EDTA solution, resuspended in PBS and analysed with a FACScan flow cytometer (Becton-Dickinson) equipped with a 488 nm argon laser. The intact cells were gated, and YFP fluorescence was detected in the FL1 (530 ± 15 nm) channel. Data on 104 cells per sample were acquired and analysed with Cell Quest software. The mean fluorescence intensity was used to determine the hsp70 promoter activity.
Microscopy
Imaging of cellular morphology
Cells were fixed with paraformaldehyde, the nuclei were stained with 5 μM propidium-iodide and images were taken by CytoScout fluorescence microscope. DIC prism and red fluorescent images were combined and analyzed in CellProfiler (www.CellProfiler.org) and ImageJ software (http://rsbweb.nih.gov/ij/). The cell number and the coverage were determined.
Microdomain detection
B16 cells were labelled with the fluorescein ester of polyethylene glycol-derivatized cholesterol (fPEG-Chol, kindly provided by T. Kobayashi, RIKEN, Saitama, Japan) and images were taken by CytoScout fluorescence microscope. 200 nM fPEG-Chol labelling solution was prepared in PBS. B16 cells were grown in glass-bottom dishes with different initial cell densities. Samples were labelled with fPEG-Chol for 15 min at room temperature. After washing, fresh RPMI without phenol-red was added to cells and images were acquired. Samples were illuminated in objective-based total internal reflection (TIRF) configuration using 488 nm light for excitation, images were analysed in CellProfiler (www.CellProfiler.org) and ImageJ software (http://rsbweb.nih.gov/ij/). The mean fluorescence intensity of the detected microdomains (>250 nm) was calculated.
Treatment of data and statistics
Correction of isotopic overlap and quantification of lipid species were performed by self-programmed Excel Macros for all lipid classes according to the principles described previously (Liebisch et al. Citation2004). We present data for all lipid species above 1 mol% of the corresponding lipid class for at least one treatment group. The association between initial cell numbers and lipid molecular species levels was analysed by linear regression. The R2, slope, standard error and p values for slope were calculated. The statistical evaluation of p values for slopes was performed according to Storey and Tibshirani (Citation2003) measuring statistical significance based on the concept of the false discovery rate. The goal was to identify as many significant changes as possible, while keeping a relatively low proportion of false positives. In order to test the relationship between hsp70 promoter activity and AA levels, Pearson correlation was computed. Student's paired t-test with the Bonferroni adjustment was used to compare RT-PCR data.
Results
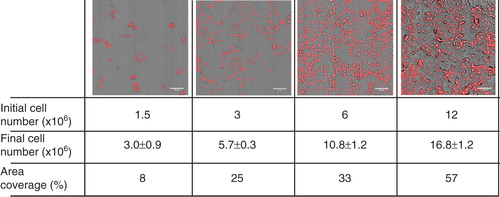
B16 cells were plated with different initial cell numbers ranging from 1.5–12 × 106 cells/10 cm plate in media containing 10% FCS and analysed after one day. The cell number range was chosen to model conditions which were reliable for everyday cell culture experiments. The lowest initial cell number allowed cells to start growing, while the highest initial cell number was close to confluency but still allowed proliferation. In microscopic images taken after one day growth together with cell number and area coverage values are shown to help orientate the reader.
Figure 1. Microscopic images of cells plated with increasing cell density after one day growth. B16 cells were plated with 1.5–12 × 106 cells/10 cm plate in media containing 10% FCS. After one day in culture cells were fixed with paraformaldehyde, the nuclei were stained with 5 μM propidium-iodide and images were taken by CytoScout fluorescence microscope. Area coverage values are expressed as a % of total area. Data are presented as means ± SD (n = 3).
Fatty acid profiling reveals remarkable PUFA decrease in cells with increasing cell number
In order to investigate the effects of different growth conditions on the lipidome of B16 cells, two mass spectrometric techniques, GC-MS and ESI-MS were applied. In a previous study we gave a detailed description of the B16 lipidome (Balogh et al. Citation2010). In this study, in addition to ESI-MS lipid molecular species analysis, GC-MS allowed the separate determination of different isomers of individual FAs, e.g., both 20:3 n-9 and 20:3 n-6, by which changes in lipid metabolism could be better followed.
The details of GC-MS FA profiling data of total lipid cellular extracts obtained from cultures after one day growth are summarized in Supplementary Table I, available online; the FA composition of the starter culture is also shown for comparison. The total FA/protein ratio remained unchanged (around 125 µg FA/mg protein) after one day with different plating densities. Importantly, the neutral lipid class composition of B16 cells did not change with cell number variation (data not shown). Moreover, the sum of the minor classes (FFA, TG, CE, DG) did not exceed 10% and, therefore, the alterations in the total FAs originated mainly from the total polar lipids (TPL) which represented membrane components.
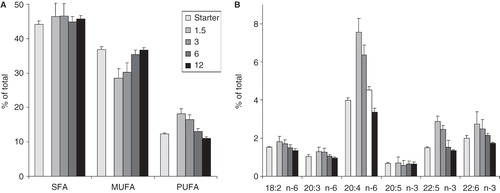
The most robust changes that occurred as a result of variation in the initial plating density can be best visualized by grouping the individual FAs according to their double bond content, distinguishing saturated FAs (SFA), monounsaturated FAs (MUFA) and PUFAs (). While the proportion of SFAs remained practically constant, the ratio of PUFAs decreased gradually upon increasing cell number with an almost 40% difference between the lowest and highest cell number cultures (18 vs. 11% PUFA). PUFA reduction was counterbalanced by MUFA enrichment. Among PUFAs of the n-6 and n-3 series, as indicated in , the most abundant and the most affected was AA. After one day growth, AA level in the most diluted sample (1.5 × 10⁶ cells/10 cm plate) almost doubled compared to that of the starter culture (the overall PUFA level elevated by 50%), thus indicating a very extensive AA (and other PUFA) uptake/incorporation during proliferation in the presence of appropriate amount of ‘food’. However, the AA proportion in the highest cell number cultures (3.4%) was less than half of that found in the lowest ones (7.6%) presumably due to the absence of an easily accessible AA reservoir. Of the other PUFA, docosapentaenoic acid (22:5 n-3) was also strongly affected, in a similar manner to AA.
Figure 2. FA compositional changes (A) in FA groups and (B) in individual PUFAs of B16 cells upon varying initial cell number. Cells were plated with 1.5–12 × 106 cells/10 cm plate in 10 ml media containing 10% FCS. Lipids of the starter culture and those of derived from cells after one day growth were analysed by GC-MS. Data are expressed as weight% of total FAs and presented as means ± SD (n = 5).
Growth media analysis unravels restricted FA availability with increasing plating density
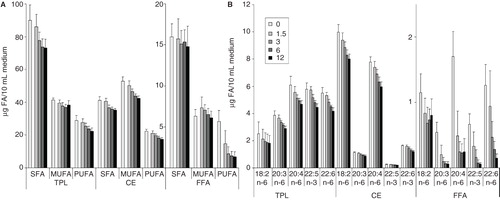
To test the validity of the above idea, the FA availability from the culture media was considered before and after one day in culture. The main FA-containing lipid classes, i.e., FFA, TG, CE and TPL, were analysed separately from the total lipids (the free Chol level remained unchanged, data not shown). The lipid class compositional analysis revealed only slight alterations either with varying cell number or in comparison to the culture media itself; it was basically maintained at a ratio of TPL:CE:FFA:TG ≈ 50:36:9:5 in all media samples (Supplementary Table II, available online). However, the total FA amount in culture media collected from the highest cell number plates decreased by almost 20% (from 320–260 μg/10 ml media) relative to that found in the media without cells. This meant that the amounts of all individual lipid classes in the medium were decreased. Concerning FA groups within lipid classes from a quantitative point of view (); in FFA a selective PUFA loss occurred. It was steeply reduced after one day growth even in the media of the lowest cell number cultures compared to the culture medium without cells. At higher cell numbers the free PUFA amount did not reduce further, but maintained a low, minimal level (ca. 1.5 μg/10 ml medium). In TPL only the PUFA fraction diminished significantly while in CE all three FA groups, i.e., SFA, MUFA and PUFA decreased to similar extent (; TG is not shown due to the absence of noticeable alterations). In we analysed the changes in the individual PUFAs. In FFA, the most abundant PUFA was AA and this was strongly reduced. Linoleic acid was hardly affected but all the C20 and C22 PUFA were largely reduced. Furthermore, clearly shows that despite the low level of FFA (9% of total lipids) relative to TPL and CE (36 and 50% of total lipids, respectively), the quantitative losses of AA from FFA, CE and TPL were comparable (1–2 μg/10 ml medium) between the media without cells and the highest cell number samples. The results indicate that the FFA fraction represents the most easily accessible AA pool in the culture medium; its AA content decreased by more than 80% in the presence of cells. In contrast, the total AA amounts contained in the CE and TPL fractions (which were 3–4 times higher than that of FFA) diminished by less than 30%, i.e., on the whole they seemed to represent a less readily accessible AA pool for cultured B16 cells.
Figure 3. Quantitative changes in (A) FA groups and in (B) individual PUFAs of lipid classes in culture media. B16 cells were plated with 1.5–12 × 106 cells/10 cm plate in 10 ml media containing 10% FCS. Lipids of the growth media without cells (0) or with cells (1.5–12) were extracted after one day growth. Neutral lipid classes were separated on TLC and analysed by GC-MS. Data are expressed as μg FA/10 ml medium and presented as means ± SD (n = 5).
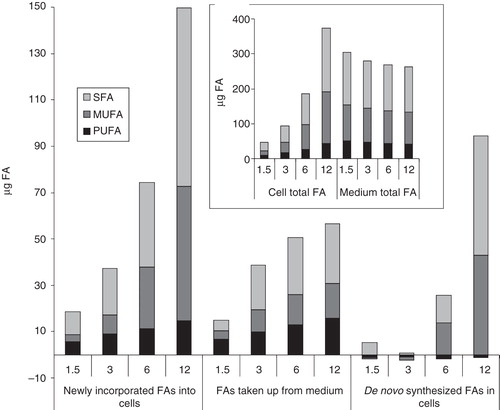
To get an impression about FA fluxes, the amounts of newly incorporated FAs into cells and those taken up from the culture media during one day growth were compared. reflects that though the total amount of newly incorporated FAs into cells was elevated in parallel with increasing cell number, the uptake of FAs from the media tended to reach a plateau which was far less (ca. 1/5th) than the total lipid level of medium. This constrain directly influences the PUFA content of cells, since they are not able to synthesize those FAs. It should be emphasized that the newly incorporated FAs in cells may come from two origins; they can be de novo assembled or can be taken up from media. As illustrated, in the highest cell number samples ca. 25 and 15 μg SFA and MUFA were taken up, respectively, while the total amounts of newly incorporated SFAs and MUFAs in cells were ca. 80 and 60 μg, respectively. The differences of these values account for the de novo synthesized FAs by cells, that in the highest cell number cultures (55 and 45 μg SFA and MUFA, respectively) exceeded 2–3 times the levels of FAs taken up from the media. It should be noted that apart from a slight PUFA catabolism, as indicated by small negative values in the de novo synthesized FAs, the catabolic activity of cells and the lipid release by cells to the medium could not be followed due to strong masking effects of lipid synthesis in cells and FA uptake from the medium, respectively.
Figure 4. Comparison of FA fluxes in cells and in culture media. B16 cells were plated with 1.5–12 × 106 cells/10 cm plate in 10 ml media containing 10% FCS. After one day growth lipids of both cells and growth media were extracted. FA amount of the starter culture was subtracted from those of cells plated with different initial cell numbers to get the newly incorporated lipids (measured based on their FA content), while the FA amounts of growth media derived from cell-containing plates were subtracted from that of the growth medium itself to get the lipids taken up from the medium (measured based on their FA content). The differences between FAs newly incorporated into cells and taken up from the medium correspond to the de novo synthesized FAs. In insert: total FA amount of cells and media. Data are expressed as μg FA/10 cm plate (which is equivalent to 10 ml of culture medium).
Lipid class and molecular species analyses point to specific cell number-dependent changes
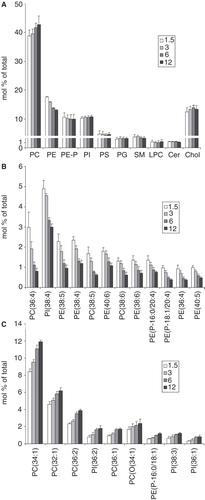
A comprehensive analysis of lipid classes (PC, LPC, PE, PE-P, PG, PI, PS, SM, Cer, Chol and CE) and lipid molecular species of B16 cells plated with increasing density was carried out by ESI-MS. The filtered data comprised 122 molecular species, each of them accounting for more than 1 mol% within its lipid class (Supplementary Table III, available online). Calculating the linear regression between the individual lipid species and cell numbers, the interrelationship was proven to be statistically significant in 56 cases. The most obvious change in the lipid class composition (, expressed as mol% of total) was the gradual overall increase in PC/PE ratios with increasing cell number. Importantly, the proportion of free Chol did not alter significantly, i.e., it seemed to be independent on the initial plating density. Next we collected those molecular species which showed the most pronounced differences between the lowest and highest initial cell densities. In accordance with the GC-MS results, the lipids whose relative levels strongly decreased upon increasing cell number were all PUFA-containing molecular species (). Most of them were AA-containing species, such as the three molecules, PC(36:4), PI(38:4) and PE(38:5), which correspond probably to PC(16:0/20:4), PI(18:0/20:4) and PE(18:1/20:4), respectively (for annotation details, see Balogh et al. (Citation2010)). Furthermore, it seems that the loss in PUFA occurred with no obvious phospholipid class selectivity. The lipids whose levels were markedly elevated were predominantly MUFA-containing PC species (), such as PC(34:1) and PC(32:1). In contrast to PUFA loss, it seems, therefore, that the monoene elevation showed some preference toward PC, which exceeded in extent the losses in PUFA-containing PC species and explains the net increase in PC level. For PE, the PUFA loss was dominant and resulted in a net decrease of this lipid class. The amount of PI(38:3), probably mainly PI(18:0/20:3) was increased. In PI, the major portion of 20:3 is the n-9 isomer Mead acid (as confirmed by GC-MS, data not shown). Its elevation is an indication of essential FA deficiency.
Figure 5. ESI-MS analysis of the B16 lipidome plated with different initial cell numbers. (A) Lipid class compositional changes. (B) and (C) Lipid molecular species that were elevated and lowered, respectively. Changes higher than 0.5% of total lipids are presented in descending order based on differences between the highest and the lowest initial cell number values. B16 cells were plated with 1.5–12 × 106 cells/10 cm plate in media containing 10% FCS. After one day growth lipids were extracted and analysed by ESI-MS. Data are expressed as mol% of total lipids and presented as means ± SD (n = 5).
The B16 cell's PUFA content strongly depends on serum concentration
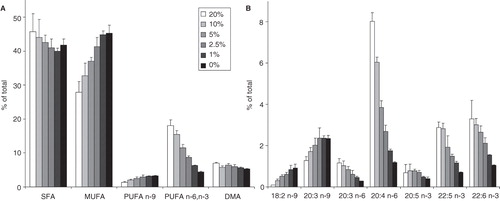
The effects of initial cell number variation on B16 cells' lipidome suggested that the higher the cell density the more pronounced is the PUFA depletion due to insufficient supply from the culture medium. We assumed therefore that at a fixed, medium plating density the decreasing serum concentration would mimic the cell number-effect. B16 cells were plated with 3 × 10⁶ cells/10 cm plate in media containing different amounts of FCS in the range of 0–20%, that corresponds to generally applied levels. The GC-MS FA compositional data are listed in Supplementary Table IV, available online. Indeed, similar to the effect of increasing cell number, the decrease in serum concentration resulted in a very pronounced decline in the amount of PUFAs from both the n-6 and n-3 series (). In contrast, the levels of PUFAs of the n-9 series were elevated. Not only the essential FA deficiency ‘indicator’ Mead acid (20:3 n-9), but even the unusual 18:2 n-9 exceeded the 0.5% level at lower serum concentrations.
Figure 6. Changes in FA composition of B16 cells with serum concentration (A) in FA groups and (B) in individual PUFAs. Cells were plated with 3 × 10⁶ cells/10 cm plate in 10 ml media containing 0–20% FCS. Lipids were extracted and analysed by GC-MS after one day growth. Data are expressed as weight% of total FAs and presented as means ± SD (n = 3).
Plating density affects membrane microdomain organization
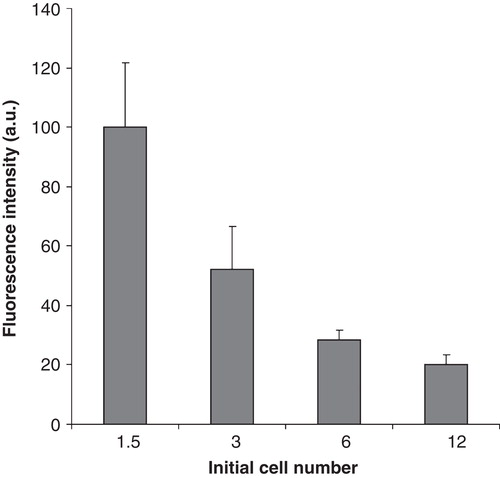
After observing such marked modulations especially in the FA compositions of B16 membrane lipids due to variations in culture condition, we were interested in possible organizational changes in membrane microdomains since these are primary sites of cell signalling processes. An effective tool for detecting these types of changes is the use of fPEG-Chol, a fluorescent label that inserts into Chol-rich plasma membrane domains and can be easily traced by fluorescence microscopy (Sato et al. Citation2004). At total intensity levels it reports about the Chol content of Chol-rich domains which are both microscopic (>250 nm) and submicroscopic (<250 nm) in size. Here we found that, although the area of microscopic domains did not change with cell number variation (data not shown), the average intensity of these domains showed a very remarkable decline (80% at the highest cell number compared to the lowest one) with increasing plating density ().
Figure 7. Fluorescence of fPEG-Chol-labelled membrane microdomains in B16 cells with increasing cell number. B16 cells were plated with 1.5–12 × 106 cells/10 cm plate in 10 ml media containing 10% FCS. After one day growth cells were labelled with 200 nM fPEG-Chol for 15 min and the fluorescence of membrane microdomains imaged by TIRF microscopy. Data are presented as means ± SD (n = 3).
The heat shock response correlates well with the AA content of the cells
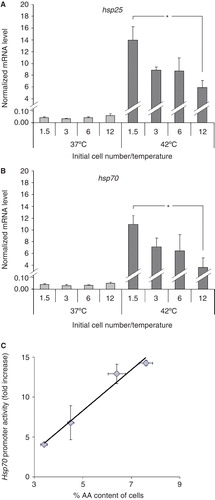
Because stress responses are dependent on membrane structure and composition and we had observed notable changes in these parameters due to cell density, we examined HS-induced Hsp expression. The mRNA levels of hsp70 and hsp25 were determined immediately after exposure of the cells to 42°C heat for 1 h. Heat treatment markedly elevated the levels of hsp70 and hsp25 mRNAs in all samples in a cell number-dependent manner. Cells plated with the lowest cell number showed more than two-fold higher induction of both genes than the highest cell number counterparts (). To determine hsp70 promoter activation, an hsp70 promoter-regulated eGFP construct was stably transfected into the B16 cell line. As with the mRNA expression, the GFP production displayed an inverse relationship with cell number (data not shown). To test the possible relationship between cellular AA content and Hsp70 promoter activation (belonging pairwise to the same cell number), the AA content was plotted against the GFP fluorescence and the linear regression was calculated (). The correlation was extremely strong (r = 0.98) between HSR and AA content. It is noted that other n-3 and n-6 PUFAs, although to a slightly lesser extent, displayed similar relationships.
Figure 8. Modulation in the heat shock response with increasing plating density. Effects of the initial cell numbers on (A) hsp25 and (B) on hsp70 gene expression. B16 cells were plated with 1.5–12 × 106 cells/10 cm plate in 10 ml media containing 10% FCS. After one day growth cells were heat-shocked at 42°C or left untreated at 37°C for 1 h. Hsp expression was followed immediately after the treatments by quantitative real-time RT-PCR. The amounts of hsp25 and hsp70 mRNAs were determined and normalized to 103 β-actin. Data are expressed as means ± SEM. *, P < 0.05 as analysed by Student's paired t-test with the Bonferroni adjustment, n = 4. (C) Correlation between hsp70 promoter activity and cell's AA content. Cells were treated as above. Hsp70 promoter activity was followed after 16 h recovery period by flow cytometry. The mean fluorescence was normalized to the untreated controls. The AA content was measured as in . Data are expressed as means ± SEM, the solid line indicates the fitted linear regression, r = 0.98.
Discussion
Although several limitations should be taken into consideration, cell culturing has become a widely applied and accepted method to model in vivo systems (Birt Citation1997). In this study we focused on constraints which may originate from variations of culture conditions and that can seriously affect the lipid status of cellular membranes. Growth media are normally supplemented with sera that provide necessary factors for cells to live and proliferate. Serum is believed to be rich in lipids that provide enough essential FAs for growth and proper cell function. However, here we unambiguously show, in agreement with previous findings (Lagarde et al. Citation1984), that this is not always the case. FA analysis of B16 cells resulted in profound n-6 and n-3 PUFA losses with concomitant elevation in MUFA levels upon increasing initial cell number in the range of 1.5–12 × 106 cells/10 cm plate at 10% FCS concentration. These effects could be completely mimicked by decreasing serum concentration in the range of 20–2.5% at a fixed, 3 × 10⁶ cells/10 cm plate, i.e., the PUFA content of cells could be pairwise matched in the two series of experiments ( and ). Further decreases in serum concentration intensified further the above effects. The observation that either increasing plating density or decreasing serum content resulted in remarkable elevation in n-9 PUFAs supports the fact that under conditions of essential FA starvation cells desaturate and elongate the available n-9 oleic acid as an alternative pathway to synthesize PUFAs (Le et al. Citation2009).
With regard to the lipid nutrition of cells in culture, it is important to know that FCS is considered as a low-lipid serum compared to sera from other origins. Additionally, due to heat-inactivation (which essentially destroys the activity of lipolytic enzymes), its total lipids contains less than 10% FFA, the most readily accessible FA source. These facts may result in a quite limited FA availability from the culture medium at higher cell densities. According to the calculated FA fluxes, at lower cell numbers (1.5 and 3 × 10⁶ cells/10 cm plate) the culture medium was able to supply cells with appropriate amount of FAs including all FA types, while at higher densities the lipid uptake tended to be limited (). Of note, was that the majority of total FAs taken up originated from CE and TPL. It is, therefore, highly conceivable to suggest that distinct lipoprotein subfractions of serum containing these lipid classes should also be more readily utilized, while others are less accessible. Furthermore, the extensive de novo FA synthesis by cells in dense cultures, also confirms that there is restricted FA availability since, in the presence of adequate lipid supply from the medium FA synthesis by cultured cells would be inhibited (Spector et al. Citation1980). At the same time, lipid class and FA compositional analysis of growth media revealed that in total FCS contains theoretically far more FA (non-esterified and esterified together), including PUFA, than would be required by cells. Besides the steep decrease in the free (non-esterified) PUFA (and especially AA) content of culture media even at the lowest cell number, a modest decrease was observed in the AA content esterified into the TPL and CE fractions. These data indicate that the FFA fraction is indeed the most easily accessible pool for PUFA uptake and incorporation. Moreover, the data clearly show that it is not only the total amount of a particular FA present in the growth medium that is important for utilization by cells, but also in which lipid class it is found.
Molecular species analysis by ESI-MS revealed numerous statistically significant changes concerning the linear regression between individual lipid molecules and cell density. The amount of the affected species altogether accounted for the majority (60–70 mol%) of total lipids (Supplementary Table III), emphasizing again that modulation in cell density may result in striking alterations in their lipidome.
Microdomain organizational changes are known to play role in orchestration of cell signalling (Vigh et al. Citation2007b, Fessler and Parks Citation2011) and, hence, cell growth and differentiation. As we showed earlier, the intensity of fPEG-Chol-labelling of the whole cell (reflecting to the Chol content of both microscopic and submicroscopic Chol-positive plasma membrane domains) in high cell number cultures decreased by approx. 50% compared to that measured in low cell number cultures (Gombos et al. Citation2011). Here we showed that the Chol content of microscopic domains was gradually and markedly reduced in a cell density-dependent manner (by 80% in the densest cultures, ). Importantly, this happened without any noticeable change in the total Chol level of cells indicating an extensive Chol redistribution between different Chol pools (membrane rafts and bulk) of the cell membranes. In agreement with the present findings, the plating density changed the membrane domain structure of human cancer cell lines as revealed by electron paramagnetic resonance spectra-based computer simulation (Koklic et al. Citation2005). Furthermore, the links between PUFA status and microdomain organization have been investigated regarding the raft vs. non-raft incorporation of PUFAs and the inner vs. outer leaflet organizational alterations of plasma membrane (Fessler and Parks Citation2011). It was shown that PUFA enrichment selectively modifies the cytoplasmic layer of detergent-resistant membranes and this alteration could underlie the observed inhibition of T cell signal transduction by PUFAs (Stulnig et al. Citation1998). Furthermore, an inner leaflet alteration by PUFAs was observed recently by using immuno-gold electron microscopy of plasma membrane sheets coupled with spatial point analysis of validated microdomain markers in HeLa cells. Clustering of probes within Chol-dependent vs. Chol-independent nanoclusters was differentially sensitive to PUFA treatment of cells, and the plasma membrane organization of inner leaflets was fundamentally altered by PUFA-enrichment (Chapkin et al. Citation2008). In addition, docosahexaenoic acid, after incorporation into both rafts and non-rafts, modified the size and distribution of lipid rafts of EL4 cells (Shaikh et al. Citation2009). Alternatively, it has been proposed that PUFAs – due to their unsaturation – do not incorporate into rafts, but rather form extraraft domains that interfere indirectly with raft-dependent protein clustering (Wassall and Stillwell Citation2009).
PUFA depletion and microdomain rearrangement of B16 cells elicited by increasing plating density were not accompanied by any sign of apoptosis or necrosis; they grew and seemed to be healthy. To find an answer to the question that whether there is any less apparent consequence due to these effects, we tested the stress response ability of cells. It may point to important factors that under ‘non-stressed’ conditions might stay uncovered but as a result of harmful environmental stimuli may prove their importance.
Requirements and availability together determine the amount of any given membrane lipid by a very intimate regulation of the anabolic and catabolic pathways of lipid metabolism. Because of this, the actual local concentration of a lipid, is decisive in terms of functionality, and can be significantly influenced by environmental changes. This fact has important consequences during stress responses, since even subtle changes in lipid concentration/composition may result in alterations in lipid-lipid and lipid-protein interactions leading to altered functional properties such as in signalling (Vigh et al. Citation1998, Citation2005). Lipids of cell membranes can also serve as a source of those mediators which can be involved in the activation or attenuation of Hsp signalling pathways. Stresses and clinical conditions can induce alterations in the metabolism of membrane lipids in producing a unique set of lipid mediators with the potential of retailoring the pre-existing Hsp profile (Escribá et al. Citation2008). Thus it has been shown that exogenous phospholipase A2 (PLA2), which stimulates AA release, and AA itself both activate the HSR (Jurivich et al. Citation1994, Citation1996). HS and other agents that induce the stress response activate phospholipase C and PLA2 in different cell lines, including cells of human, rat, mouse, and hamster origin (Calderwood and Stevenson Citation1993) thus releasing AA (Calderwood et al. Citation1987, Citation1988, Citation1989). Recently we demonstrated that upon heat or membrane fluidizer treatment of B16 cells the loss in polyenoic (especially AA-containing) lipid molecular species (with a concomitant increase in saturated species) was a consequence of the activation of mainly PLA2 and PLC (Balogh et al. Citation2010). Moreover, the phospholipase C–diacylglycerol lipase–monoacylglycerol lipase pathway, which we identified in B16 cells, contributed significantly to the production of several lipid mediators (such as diacylglycerol, monoacylglycerol and AA) upon stress. The lipid species most affected by AA removal were PI(38:4), PC(36:4), PE(38:5) and PE(P-18:0/20:4). Importantly, these molecules were also significantly decreased with increasing cell number (), which suggests possible deterioration of phospholipase-mediated stress signals in higher density cultures. The observation in human epidermoid A431 cells that U-73122 (an inhibitor of PLC) treatment reduced the levels of heat-induced Hsp72 almost by half (Kiang et al. Citation1994) strongly supports the importance of these lipid mediators in stress response. On the other hand, during HS AA is used in the synthesis of eicosanoids via cyclooxygenases and lipoxygenases (Calderwood et al. Citation1989). The cyclopentenone prostaglandins PGA1, PGA2 and PGJ2 also lead to activation of heat shock factor 1 (Ohno et al. Citation1988, Amici et al. Citation1992, Citation1993, Ianaro et al. Citation2003) and Hsp synthesis (Santoro Citation2000). In addition, certain lipoxygenase products of AA, such as 12-hydroxyeicosatetraenoic acid, have also been shown to induce the expression of individual Hsps in human leukocytes (Köller and König Citation1991).
In the present study we clearly demonstrated that the heat-induced expression of two highly responsive and functionally very important hsp genes (i.e., hsp25 and hsp70) were inversely related to cell density and tightly correlated with the AA levels of cells (). In agreement with our results, Noonan et al. (Citation2007) demonstrated, using human colon carcinoma cell lines that, with increasing population size, cells are less stress inducible for Hsp70B' (the cell densities in the two studies were in the same range). They found that neither cell-cell attachment nor cell-substratum attachment was required for cell number-dependent promoter activation. However, the lipid status of cells was not investigated. The authors showed that medium conditioned by high cell number populations decreased Hsp70 promoter activity in low cell number cultures, while medium conditioned by low cell number populations increased Hsp70 promoter activity in high cell number cultures. They explained their data by suggesting that an inhibitor or an activator was generated by the cells at high or low cell number cultures, respectively. In the light of our findings, the greater depletion of the easily accessible PUFA (such as AA) from the culture medium and the consequently diminished PUFA (AA) content of cells in the high(er) cell number cultures may explain the above results. Indeed, preliminary data showed that low cell number cultures grown in high cell number-conditioned medium had decreased the AA contents compared to unconditioned controls (unpublished data).
Hyperfluidization stress, elicited by heat or membrane fluidizer treatment, may have two main aspects concerning microdomain organization which should be mentioned. First, it may induce microdomain reorganization during stress. Thus, previously we demonstrated that activation of the HSR using mild thermal stress coincides with Chol-rich membrane raft reorganization (Nagy et al. Citation2007). This raft reorganization might be related to the lipid remodelling due to heat (both mild and severe) or benzyl alcohol-induced membrane perturbation, which resulted in the accumulation of Chol, Cer, saturated PC and PE-P species in B16 cells (Balogh et al. Citation2010). It is known that these lipid species support the separation of tightly-packed subdomains. Moreover, the enhanced formation of rigid domains in surface membranes and the parallel elevation of molecular disorder within the internal membranes detected by Laurdan microscopy in K562 cells preexposed to mild HS (Balogh et al. Citation2011) was accompanied by a massive expression of Hsps (Balogh et al. Citation2005). Recently, using direct imaging of nanoscopic long-lived platforms with raft-like properties diffusing in the plasma membrane of live mGFP-GPI-transfected CHO cells (Brameshuber et al. Citation2010), we showed that exposure to a mild HS led to the disappearance of mGFP-GPI homo-association within minutes, followed by a spontaneous recovery of raft integrity observed by the end of the 45-min experimental period (Brameshuber et al. Citation2010). These observations underline the importance of microdomain reorganization in stress responses.
Second, the ‘quality’ of pre-existing microdomains themselves may determine the extent of the HSR. In this study the changes in the expressions of hsp25 and hsp70 were paralleled by modulation in the Chol content of microscopic Chol-rich domains in a cell number-dependent manner ( and ). It is noted that BGP-15, a known chaperon co-inducer (Chung et al. Citation2008, Literáti-Nagy et al. Citation2012) was able to permeate into the surface membranes of B16 cells and to associate prefentially to Chol-enriched lipid platforms thus preventing the transient structural disintegration of rafts induced by fever-type HS. This compound was able to remodel Chol-enriched lipid platforms together with the restoration of diminished HSR in high cell number cultures (Gombos et al. Citation2011). Rac1, a small GTP-binding protein, was found to be also a major player in this process (Gombos et al. Citation2011). Furthermore, it was recently reported, that palmitoylation of Rac1 regulates its oligomerization state and activity, and its partitioning and stabilization into ordered Chol-rich membrane domains (Navarro-Lérida et al. Citation2012). Taken together our data suggest that both the PUFA status and the parallel microdomain reorganization play important roles in signal generation during HSR.
Conclusions
In the present study we examined the effect of culture conditions on lipid homeostasis and its correlation with the stress response of B16 cells. Importantly, the ranges of variables we studied, i.e., the initial cell number and serum concentration, correspond to generally applied conditions (104–105 cells/plate cm2/0.1–0.3 ml culture medium supplemented with 5–20% heat-inactivated FCS). Our experiments indicate that both a relatively high cell density and/or a relatively low serum concentration may result in significant PUFA deficiency as a consequence of the rapid depletion of the easily accessible lipid pools from the medium. Cells were able to compensate the limited lipid availability by upregulating their FA synthesis and desaturation, and producing enough SFA and MUFA for the membrane expansion during cell division. The detailed lipidomic analysis revealed a profound rearrangement of molecular species composition, with around 70% of the lipid molecular species being altered as a result of the variation in plating density. A remarkable remodelling of microdomain structure of cellular membranes was also observed concomitantly with increasing cell number after only one day in culture. Under these circumstances both the diminished fPEG-Chol staining of Chol-containing rafts and the substantial n-3 and n-6 PUFA depletion can be linked directly to the serious loss in the stress response ability of cells. The interrelationship of these two key factors and their individual contribution to HSR should be further clarified. Indeed, studies with the aim of dissecting the involvement of particular membrane elements in HSR by specific modulation of FAs and raft constituents are in progress in our laboratory.
We clearly demonstrated that small variations in plating density (which is often poorly controlled compared to that of serum concentration) may profoundly alter the PUFA status and microdomain organization of cells, and may result in the disturbance of both membrane-related sensing and signalling events. These caveats should be considered, especially for experiments conducted with cells possessing high proliferative and/or lipid metabolic rates. Our results draw attention to the need for careful control of the above-mentioned factors in cell culture.
Supplementary Tables I–IV.
Download MS Word (501.5 KB)Acknowledgements
This work was supported by the European Union Project LipidomicNet (HEALTH-F4-2008-202272), by the Hungarian National Scientific Research Foundation (OTKA NK100857, K82097 and K84257), by the ‘Social Renewal Operational Programme’ of the Hungarian National Development Agency (TAMOP-4.2.2/08/1-2008-0005, TAMOP-4.2.2/08/1-2008-0002 and TAMOP-4.2.2/08/1-2008-0014).
Declaration of interest: The author reports no conflicts of interest. The author alone is responsible for the content and writing of the paper.
References
- Amici C, Palamara AT, Santoro MG. 1993. Induction of thermotolerance by prostaglandin A in human cells. Exp Cell Res 207:230–234.
- Amici C, Sistonen L, Santoro MG, Morimoto RI. 1992. Antiproliferative prostaglandins activate heat shock transcription factor. Proc Natl Acad Sci USA 89:6227–6231.
- Bailey JM, Howard BV, Tillman SF. 1973. Lipid metabolism in cultured cells. XI. Utilization of serum triglycerides. J Biol Chem 248:1240–1247.
- Balogh G, Horváth I, Nagy E, Hoyk Z, Benkõ S, Bensaude O, 2005. The hyperfluidization of mammalian cell membranes acts as a signal to initiate the heat shock protein response. FEBS J 272:6077–6086.
- Balogh G, Maulucci G, Gombos I, Horváth I, Török Z, Péter M, 2011. Heat stress causes spatially-distinct membrane re-modelling in K562 leukemia cells. PLoS One 6:e21182.
- Balogh G, Péter M, Liebisch G, Horváth I, Török Z, Nagy E, 2010. Lipidomics reveals membrane lipid remodelling and release of potential lipid mediators during early stress responses in a murine melanoma cell line. Biochim Biophys Acta 1801:1036–1047.
- Birt DF. 1997. Methodologic issues, theoretical considerations, and design criteria for experimental animal and cell culture experiments. Am J Clin Nutr 66:1506S–1512S.
- Brameshuber M, Weghuber J, Ruprecht V, Gombos I, Horváth I, Vigh L, 2010. Imaging of mobile long-lived nanoplatforms in the live cell plasma membrane. J Biol Chem 285:41765–41771.
- Brügger B, Erben G, Sandhoff R, Wieland FT, Lehmann WD. 1997. Quantitative analysis of biological membrane lipids at the low picomole level by nano-electrospray ionization tandem mass spectrometry. Proc Natl Acad Sci USA 94:2339–2344.
- Calder PC. 2011. Fatty acids and inflammation: The cutting edge between food and pharma. Eur J Pharmacol 668(Suppl 1):S50–S58.
- Calderwood SK, Bornstein B, Farnum EK, Stevenson MA. 1989. Heat shock stimulates the release of arachidonic acid and the synthesis of prostaglandins and leukotriene B4 in mammalian cells. J Cell Physiol 141:325–333.
- Calderwood SK, Stevenson MA. 1993. Inducers of the heat shock response stimulate phospholipase C and phospholipase A2 activity in mammalian cells. J Cell Physiol 155:248–256.
- Calderwood SK, Stevenson MA, Hahn GM. 1987. Heat stress stimulates inositol trisphosphate release and phosphorylation of phosphoinositides in CHO and Balb C 3T3 cells. J Cell Physiol 130:369–376.
- Calderwood SK, Stevenson MA, Hahn GM. 1988. Effects of heat on cell calcium and inositol lipid metabolism. Radiat Res 113:414–425.
- Chapkin RS, Wang N, Fan Y, Lupton JR, Prior IA. 2008. Docosahexaenoic acid alters the size and distribution of cell surface microdomains. Biochim Biophys Acta 1778:466–471.
- Chung J, Nguyen A, Henstridge DC, Holmes AG, Chan MHS, Mesa JL, 2008. HSP72 protects against obesity-induced insulin resistance. Proc Natl Acad Sci USA 105:1739–1744.
- Das UN. 2011. Influence of polyunsaturated fatty acids and their metabolites on stem cell biology. Nutrition 27:21–25.
- Escribá PV, González-Ros JM, Goñi FM, Kinnunen PKJ, Vigh L, Sánchez-Magraner L, 2008. Membranes: A meeting point for lipids, proteins and therapies. J Cell Mol Med 12:829–875.
- Fahy E, Subramaniam S, Murphy RC, Nishijima M, Raetz CRH, Shimizu T, 2009. Update of the LIPID MAPS comprehensive classification system for lipids. J Lipid Res 50(Suppl):S9–S14.
- Fessler MB, Parks JS. 2011. Intracellular lipid flux and membrane microdomains as organizing principles in inflammatory cell signaling. J Immunol 187:1529–1535.
- Folch J, Lees M, Sloane Stanley GH. 1957. A simple method for the isolation and purification of total lipides from animal tissues. J Biol Chem 226:497–509.
- Gombos I, Crul T, Piotto S, Güngör B, Török Z, Balogh G, 2011. Membrane-lipid therapy in operation: The HSP co-inducer BGP-15 activates stress signal transduction pathways by remodeling plasma membrane rafts. PLoS One 6:e28818.
- Horváth I, Multhoff G, Sonnleitner A, Vígh L. 2008. Membrane-associated stress proteins: More than simply chaperones. Biochim Biophys Acta 1778:1653–1664.
- Howard BV, Howard WJ. 1974. Lipid metabolism in cultured cells. Adv Lipid Res 12:51–96.
- Hurst S, Rees SG, Randerson PF, Caterson B, Harwood JL. 2009. Contrasting effects of n-3 and n-6 fatty acids on cyclooxygenase-2 in model systems for arthritis. Lipids 44:889–896.
- Hurst S, Zainal Z, Caterson B, Hughes CE, Harwood JL. 2010. Dietary fatty acids and arthritis. Prostaglandins Leukot Essent Fatty Acids 82:315–318.
- Ianaro A, Ialenti A, Maffia P, Di Meglio P, Di Rosa M, Santoro MG. 2003. Anti-inflammatory activity of 15-deoxy-delta12,14-PGJ2 and 2-cyclopenten-1-one: Role of the heat shock response. Mol Pharmacol 64:85–93.
- Jurivich DA, Pangas S, Qiu L, Welk JF. 1996. Phospholipase A2 triggers the first phase of the thermal stress response and exhibits cell-type specificity. J Immunol 157:1669–1677.
- Jurivich DA, Sistonen L, Sarge KD, Morimoto RI. 1994. Arachidonate is a potent modulator of human heat shock gene transcription. Proc Natl Acad Sci USA 91:2280–2284.
- Kiang JG, Carr FE, Burns MR, McClain DE. 1994. HSP-72 synthesis is promoted by increase in [Ca2+]i or activation of G proteins but not pHi or cAMP. Am J Physiol 267:C104–C114.
- Koklic T, Pirs M, Zeisig R, Abramović Z, Sentjurc M. 2005. Membrane switch hypothesis. 1. Cell density influences lateral domain structure of tumor cell membranes. J Chem Inf Model 45:1701–1707.
- Köller M, König W. 1991. 12-Hydroxyeicosatetraenoic acid (12-HETE) induces heat shock proteins in human leukocytes. Biochem Biophys Res Commun 175:804–809.
- Lagarde M, Sicard B, Guichardant M, Felisi O, Dechavanne M. 1984. Fatty acid composition in native and cultured human endothelial cells. In Vitro 20:33–37.
- Le HD, Meisel JA, de Meijer VE, Gura KM, Puder M. 2009. The essentiality of arachidonic acid and docosahexaenoic acid. Prostaglandins Leukot Essent Fatty Acids 81:165–170.
- Leidl K, Liebisch G, Richter D, Schmitz G. 2008. Mass spectrometric analysis of lipid species of human circulating blood cells. Biochim Biophys Acta 1781:655–664.
- Liebisch G, Binder M, Schifferer R, Langmann T, Schulz B, Schmitz G. 2006. High throughput quantification of cholesterol and cholesteryl ester by electrospray ionization tandem mass spectrometry (ESI-MS/MS). Biochim Biophys Acta 1761:121–128.
- Liebisch G, Drobnik W, Lieser B, Schmitz G. 2002. High-throughput quantification of lysophosphatidylcholine by electrospray ionization tandem mass spectrometry. Clin Chem 48:2217–2224.
- Liebisch G, Drobnik W, Reil M, Trümbach B, Arnecke R, Olgemöller B, 1999. Quantitative measurement of different ceramide species from crude cellular extracts by electrospray ionization tandem mass spectrometry (ESI-MS/MS). J Lipid Res 40:1539–1546.
- Liebisch G, Lieser B, Rathenberg J, Drobnik W, Schmitz G. 2004. High-throughput quantification of phosphatidylcholine and sphingomyelin by electrospray ionization tandem mass spectrometry coupled with isotope correction algorithm. Biochim Biophys Acta 1686:108–117.
- Literáti-Nagy Z, Tory K, Literáti-Nagy B, Kolonics A, Török Z, Gombos I, 2012. The HSP co-inducer BGP-15 can prevent the metabolic side effects of the atypical antipsychotics. Cell Stress Chaperones DOI 10.1007/s12192-012-0327-5.
- Marazzi J, Kleyer J, Paredes JMV, Gertsch J. 2011. Endocannabinoid content in fetal bovine sera – unexpected effects on mononuclear cells and osteoclastogenesis. J Immunol Methods 373:219–228.
- Matyash V, Liebisch G, Kurzchalia TV, Shevchenko A, Schwudke D. 2008. Lipid extraction by methyl-tert-butyl ether for high-throughput lipidomics. J Lipid Res 49:1137–1146.
- Nagy E, Balogi Z, Gombos I, Akerfelt M, Björkbom A, Balogh G, 2007. Hyperfluidization-coupled membrane microdomain reorganization is linked to activation of the heat shock response in a murine melanoma cell line. Proc Natl Acad Sci USA 104:7945–7950.
- Navarro-Lérida I, Sánchez-Perales S, Calvo M, Rentero C, Zheng Y, Enrich C, 2012. A palmitoylation switch mechanism regulates Rac1 function and membrane organization. EMBO J 31:534–551.
- Noonan EJ, Place RF, Rasoulpour RJ, Giardina C, Hightower LE. 2007. Cell number-dependent regulation of Hsp70B' expression: Evidence of an extracellular regulator. J Cell Physiol 210:201–211.
- Ohno K, Fukushima M, Fujiwara M, Narumiya S. 1988. Induction of 68,000-dalton heat shock proteins by cyclopentenone prostaglandins. Its association with prostaglandin-induced G1 block in cell cycle progression. J Biol Chem 263:19764–19770.
- Rouzer CA, Ivanova PT, Byrne MO, Milne SB, Marnett LJ, Brown HA. 2006. Lipid profiling reveals arachidonate deficiency in RAW264.7 cells: Structural and functional implications. Biochemistry 45:14795–14808.
- Santoro MG. 2000. Heat shock factors and the control of the stress response. Biochem Pharmacol 59:55–63.
- Sato SB, Ishii K, Makino A, Iwabuchi K, Yamaji-Hasegawa A, Senoh Y, 2004. Distribution and transport of cholesterol-rich membrane domains monitored by a membrane-impermeant fluorescent polyethylene glycol-derivatized cholesterol. J Biol Chem 279:23790–23796.
- Shaikh SR, Rockett BD, Salameh M, Carraway K. 2009. Docosahexaenoic acid modifies the clustering and size of lipid rafts and the lateral organization and surface expression of MHC class I of EL4 cells. J Nutr 139:1632–1639.
- Spector AA, Mathur SN, Kaduce TL, Hyman BT. 1980. Lipid nutrition and metabolism of cultured mammalian cells. Prog Lipid Res 19:155–186.
- Storey JD, Tibshirani R. 2003. Statistical significance for genome-wide studies. Proc Natl Acad Sci USA 100:9440–9445.
- Stulnig TM, Berger M, Sigmund T, Raederstorff D, Stockinger H, Waldhäusl W. 1998. Polyunsaturated fatty acids inhibit T cell signal transduction by modification of detergent-insoluble membrane domains. J Cell Biol 143:637–644.
- Tombaccini D, Fallani A, Mugnai G, Ruggieri S. 1981. Lipid composition of Balb/c3T3, SV3T3, and Concanavalin A-selected revertant cells grown in media containing lipid-depleted serum. J Lipid Res 22:590–597.
- Vigh L, Escribá PV, Sonnleitner A, Sonnleitner M, Piotto S, Maresca B, 2005. The significance of lipid composition for membrane activity: New concepts and ways of assessing function. Prog Lipid Res 44:303–344.
- Vigh L, Horváth I, Maresca B, Harwood JL. 2007a. Can the stress protein response be controlled by ‘membrane-lipid therapy’? Trends Biochem Sci 32:357–363.
- Vigh L, Maresca B, Harwood JL. 1998. Does the membrane's physical state control the expression of heat shock and other genes? Trends Biochem Sci 23:369–374.
- Vigh L, Török Z, Balogh G, Glatz A, Piotto S, Horváth I. 2007b. Membrane-regulated stress response: A theoretical and practical approach. Adv Exp Med Biol 594:114–131.
- Wassall SR, Stillwell W. 2009. Polyunsaturated fatty acid-cholesterol interactions: Domain formation in membranes. Biochim Biophys Acta 1788:24–32.
- Wiegand RD, Wood R. 1974. Lipids of cultured hepatoma cells. 3. Triglyceride and phosphoglyceride biosynthesis in minimal deviation hepatoma 7288C. Lipids 9:141–148.
- Wiegand RD, Wood R. 1975. Lipids of cultured hepatoma cells: VII. Structural analyses of glycerolipids in minimal deviation hepatoma 7288C. Lipids 10:548–554.
- Zemski Berry KA, Murphy RC. 2004. Electrospray ionization tandem mass spectrometry of glycerophosphoethanolamine plasmalogen phospholipids. J Am Soc Mass Spectrom 15:1499–1508.