Abstract
A systematic approach was used for the cloning and amplified expression in Escherichia coli of the genes for each of three inositol transport proteins (IolF, IolT, YfiG) from Bacillus subtilis that are evolutionarily-related to human transporters. Inducible amplified expression of each was achieved to levels of ∼ 10–15% of total protein in E. coli inner membrane preparations. The functional integrity of each heterologously-expressed protein was demonstrated by measuring the kinetics of 3H-myo-inositol transport into energized whole cells; this confirmed that IolT is the major inositol transporter, IolF is an inefficient transporter of this substrate and demonstrated that YfiG is an inositol transport protein for the first time. Competition for 3H-myo-inositol transport by 17 unlabelled compounds revealed all three proteins to be highly specific in recognizing inositols over sugars. IolT was confirmed to be highly specific for both myo- and D-chiro-inositol and IolF was confirmed to prefer D-chiro-inositol over myo-inositol. YfiG selectively recognized myo-inositol, D-chiro-inositol and, uniquely, L-chiro-inositol. All three proteins were successfully solubilized and purified in milligram quantities from inner membrane preparations and their suitability for inclusion in crystallization trials was assessed by analysis of structural integrity and thermal stability using circular dichroism spectroscopy followed by examination for monodispersity using gel filtration chromatography.
Introduction
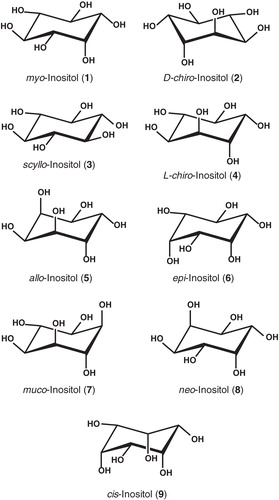
Inositol (cyclohexane-1,2,3,4,5,6-hexol) has nine possible stereoisomers () of which myo-inositol (1) is the most abundant in nature. In humans, myo-inositol and its phosphates are the basis for a number of signalling and secondary messenger molecules and its phospholipid derivatives are significant constituents of cell membranes (Michell Citation2008). The level of myo-inositol in the brain is 100-fold greater than in peripheral tissues, which is maintained by concentrative active transport thought to be driven by two sodium/myo-inositol transporters (SMIT1, SMIT2) (Fenili et al. Citation2011) and possibly by a proton/myo-inositol transporter (HMIT) (Uldry et al. Citation2001, Di Daniel et al. Citation2009) designated as GLUT13 in class III of the SLC2 facilitated hexose and polyol transporter family (Uldry and Thorens Citation2004, Augustin Citation2010). Inositols are used in the treatment of a number of human diseases, which include myo-inositol for reducing the symptoms of obsessive compulsive disorder and depression (Fux et al. Citation1996), D-chiro-inositol (2) for treating hyperglycemia and polycystic ovary syndrome (Iuorno et al. Citation2002); also, scyllo-inositol (3) has recently been used in human clinical trials for the treatment of Alzheimer's disease (McLaurin et al. Citation2006, Salloway et al. Citation2011, www.clinicaltrials.gov). Since scyllo-inositol is relatively rare in nature, the inositol metabolic pathway of the soil bacterium Bacillus subtilis has recently been manipulated to generate scyllo-inositol in gram quantities by conversion from the more abundant stereoisomer myo-inositol (Yamaoka et al. Citation2011).
Figure 1. Chemical structures of the nine inositol stereoisomers.
Many microorganisms, including B. subtilis, are able to use myo-inositol as their sole carbon source (Yoshida et al. Citation1997). The catabolism of myo-inositol in B. subtilis is controlled by the iolABCDEFGHIJ and iolRS operons, the products of which achieve a net conversion of myo-inositol to an equimolar mixture of dihydroxyacetone phosphate, acetyl-CoA, and carbon dioxide (Yoshida et al. Citation1997, Citation2008). For efficient utilization of myo-inositol from their environment, these bacteria require concentrative active transport systems that will recognize and drive uptake into the cell of this carbon source. Two inositol transport proteins, IolT and IolF, had been identified in B. subtilis by monitoring the growth of gene knockout strains in the absence and presence of myo-inositol as the sole carbon source (Yoshida et al. Citation2002). IolT, which is encoded by the iolT gene, was shown to be the major inositol transporter and IolF, which is encoded within the iolA-J operon, was designated as the minor transporter since it supported only poor cell growth with myo-inositol. A double knockout mutant did support some cell growth, which suggested the existence of an additional IolT/F-independent mechanism of transport at higher myo-inositol concentrations. Expression of all of the iol genes (A–J, RS and T) is regulated by a repressor protein encoded by iolR. Differential substrate specificity for IolT and IolF was subsequently shown by monitoring cell growth in the presence of myo-inositol or D-chiro-inositol as sole carbon source and by measuring the uptake of radiolabelled versions of the same compounds (Morinaga et al. Citation2010). IolT and IolF were both induced in the presence of either stereoisomer, but IolT had a preference for transport of myo-inositol and IolF had a preference for transport of D-chiro-inositol. Interestingly, a transport system in HepG2 human liver cells had been identified some years ago that recognized both myo- and D-chiro-inositol, but not L-chiro-inositol (4); transport by this system was competed out by D-glucose, but not by L-glucose (Ostlund et al. Citation1996).
Part of the EDICT project supports the exploration of structure-activity relationships of transport proteins from bacteria that are evolutionary-related to human transporters, and thus to exploit the relative ease of bacterial structural genomics to provide models of mammalian proteins. For this reason we included IolT, IolF and a third putative sugar/inositol transport protein, YfiG, from B. subtilis (Supplementary Table S1, available online) in our pipeline for cloning, amplified expression, purification and crystallization trials. All three proteins are members of the Major Facilitator Superfamily (MFS) of transporters, which are widespread in both prokaryotic and eukaryotic organisms, and have a putative membrane topology that comprises the expected twelve transmembrane α-helices with cytoplasmic N- and C-termini (Supplementary Figures S2,,, available online) verified by X-ray crystal structures of the lactose transporter, LacY (Abramson et al. Citation2003), the glycerol-3-phosphate transporter GlpT (Huang et al. Citation2003) and the fucose transporter FucP (Dang et al. Citation2010). Sequence alignments (Supplementary Table S2, available online) reveal that IolT and YfiG have 66% amino acid sequence identity with each other and share 33% and 31% sequence identity, respectively, with human HMIT. IolT and YfiG also share 25–27% sequence identity with human GLUT1 and GLUT4. IolF is distinct from IolT and YfiG as it shares only 18% and 13% sequence identity with these proteins, respectively, and 14% with human HMIT. All three B. subtilis proteins show only poor sequence identities with human SMIT1 or with LacY, GlpT and FucP from E. coli.
Using a systematic approach applied to all three of the proteins, first, we cloned the iolT, iolF and yfiG genes into a vector suitable for inducible expression of the proteins with a C-terminal hexa-histidine tag in Escherichia coli and confirmed their amplified expression in membrane preparations. The functional integrity of the heterologously expressed proteins was tested by measuring 3H-myo-inositol transport into energized E. coli whole cells. Competition for this transport by a range of unlabelled compounds allowed a rigorous investigation of ligand recognition specificity by the three proteins, with some novel observations. The suitability of the proteins for inclusion in crystallization trials was then examined by solubilizing them in detergent, purification by Ni-affinity chromatography, analysis of secondary structure and thermal stability by circular dichroism spectroscopy, and finally of monodispersity by gel filtration chromatography.
Materials and methods
General
Chemicals, reagents and media of the highest available quality were obtained from Sigma-Aldrich Co., Fisher Scientific UK Ltd, Melford Laboratories Ltd, BDH Chemical Supplies or Difco Laboratories, unless stated otherwise. All media, buffers and other solutions were prepared using either deionized water or MilliQ™ water. All media were sterilized by autoclaving or for thermally-sensitive solutions by passage through 0.2 μM Minisart® high-flow sterile syringe-driven filters (Sartorius) or using vacuum-driven 0.2 μM filters (Stericup®) from Millipore. Cellulose nitrate 25 mm ø filters (0.45 μM pore size) for radiolabelled substrate assays and cellulose ester GSTF 25 mm ø filters (0.22 μm pore size) (Whatman®) for protein determinations were from Millipore (UK) Ltd. DNA purification kits were from QIAGEN Ltd. Restriction endonucleases and T4 DNA ligase were from New England Biolabs, Pfu Turbo™ DNA polymerase was from Agilent Technologies UK, and 1 kb DNA ladder and SYBR Safe™ DNA gel stain was from Invitrogen. PCR amplification of DNA was performed using a Peltier Thermal cycler from MJ Research. Cell disruption was performed using a Constant Systems disruptor. Protein determinations used the method of Schaffner and Weissmann (Citation1973) or a BCA assay using Pierce® BCA protein assay reagent A from Thermo Scientific. SDS-PAGE was performed by the method of Laemmli UK (Citation1970), refined for membrane proteins as described by Henderson and Macpherson (Citation1986) using 4% stacking gels and 15% resolving gels in a BioRad Mini PROTEAN 3 apparatus. Acrylamide (40%) and bisacrylamide (2%) solutions were from BioRad Laboratories and SDS-7 protein molecular weight markers were from Sigma-Aldrich Co. Western blotting was performed by semi-dry transfer using a BioRad TRANS-BLOT® SD apparatus; RGS-His antibody was from QIAGEN Ltd, SuperSignal®; West Pico luminal enhancer solution and stable peroxide solution were from Perbio Science UK; and Fluorotrans™ membrane was from Pall BioSupport, UK. High-range Rainbow Molecular Weight Markers were from Amersham Biosciences UK Ltd.
Gene cloning and transformation of E. coli
Cloning was performed using the plasmid pTTQ18 (Stark Citation1987), which is based on the pUC high expression series of plasmids with a polylinker/lacZα region flanked by the strong hybrid trp-lac (tac) promoter, which was later modified to introduce an RGS(His6) tag at the C-terminal end of the protein (Ward et al. Citation1999, Citation2000). The strategy is outlined below and illustrated in Supplementary Figure S1 (available online) with example results for IolT. PCR primers (Supplementary Table S3, available online) were designed to extract and amplify the iolT, iolF and yfiG genes from B. subtilis 168 genomic DNA with introduction of EcoR1 and Pst1 (or Afe1 with YfiG) restriction sites at the 5′ and 3′ ends, respectively, followed by digestion of the PCR product with these enzymes (Supplementary Figure S1A, online). The gene digests were ligated into the multi-cloning site of EcoR1/Pst1-digested plasmid pTTQ18 downstream from the IPTG-inducible tac promoter and immediately upstream from a RGS(His6)-coding sequence that we had already engineered into the plasmid (Liang 1994, unpublished). The yfiG gene contains an internal Pst1 restriction site, so the PCR primer for amplifying this gene was designed to introduce an RGS(His6) sequence along with an Afe1 restriction site at the 3′ end, which was ligated with an EcoR1/Afe1-digested form of pTTQ18 that we had already engineered with an Afe1 restriction site (Saidijam 2004, unpublished). The ligations were transformed into E. coli XL-1-Blue cells (Stratagene™) in the presence of carbenicillin (100 μg/ml) followed by PCR screening of colonies, extraction of plasmid DNA from positive clones and restriction digestion analysis using EcoR1 and Pst1 enzymes (Supplementary Figure S1, B and C, online). Plasmid DNA from successful ligations was transformed into E. coli BL21(DE3) cells (Novagen™) followed by a test for inducible expression of the His-tagged protein by SDS-PAGE and Western blot analysis of membranes prepared by the water lysis method (Witholt et al. Citation1976, Ward et al. Citation2000) from small-scale (50 ml) cell cultures that were uninduced or induced with IPTG (Supplementary Figure S1D, online). Clones of cells that showed successful amplified expression of the proteins were transferred into a freezing mixture (12.6 g/l K2HPO4, 0.9 g/l sodium citrate, 0.18 g/l MgSO4, 1.8 g/l (NH4)2SO4, 3.6 g/l KH2PO4, 96 g/l glycerol), frozen in liquid nitrogen and stored at −80°C. Competent cells were prepared by the methods described by Inouea et al. (Citation1990) or Chung et al. (Citation1989) and transformations were performed based on the method described by Inouea et al. (Citation1990). For each protein, the optimum concentration of IPTG to use for induction was determined; an example for IolF is shown in Supplementary Figure S5 (online).
Cell growth and membrane preparation
Cells were grown in LB liquid medium supplemented with glycerol (20 mM) and carbenicillin (100 μg/ml) in Falcon tubes (10 ml in 50 ml tubes) for starter cultures and in baffled flasks (50 ml in 250 ml flasks or 500 ml in 2-l flasks for small-scale and large-scale cultures, respectively) at a temperature of 37°C and with aeration at 200 rpm. Cells were recovered from deep frozen stocks by streaking onto LB-agar plates with 100 μg/ml carbenicillin, using a single colony to inoculate LB medium in Falcon tubes, and then using a 2% (v/v) inoculum when transferring from one liquid culture to another. For expression tests and optimization of induction conditions, small-scale cultures were grown to an A680 of 0.4–0.6, then left uninduced or induced with the relevant concentration of IPTG and grown for a further 3 h before harvesting by centrifugation (3000 g, 10 min, in Falcon tubes using a bench-top instrument), followed by preparation of membranes by the water lysis method (Witholt et al. Citation1976, Ward et al. Citation2000). For large-scale membrane preparation, typically a total of 10 l of cells were grown to an A680 of 0.4–0.6, then induced with IPTG (0.5 mM) and grown for a further 3 h before harvesting by centrifugation (16,000 g, 30 min, 4°C) and storage at −80°C. At a later time the cells were thawed, suspended in Tris-EDTA buffer (20 mM Tris, pH 7.5 with 0.5 mM EDTA) and inner/outer membranes were separated by sucrose gradient ultracentrifugation and prepared as described in Ward et al. (Citation2000), followed by washing and resuspension in Tris buffer (20 mM, pH 7.5), dispensing into aliquots, rapid freezing in liquid nitrogen and storage at −80°C.
Whole cell transport and competition assays
Measurement of 3H-myo-inositol uptake into energized whole cells was performed using a method based on that performed by Henderson et al. (Citation1977). Cells were grown in M9 minimal medium supplemented with glycerol (20 mM) and carbenicillin (100 μg/ml) in volumes of 50 or 100 ml at 37°C and with aeration at 200 rpm to an A680 of ∼ 0.4–0.6. The cells were then either left uninduced, or induced with IPTG (0.5 mM) and grown for a further 1 h. After harvesting by centrifugation (4000 rpm, 10 min, in Falcon tubes using a bench-top instrument), the cells were washed three times with 40 ml transport buffer (150 mM KCl, 5 mM MES, pH 6.6) and then resuspended in the same buffer to an A680 of 2.0. The basic method for the assay is described as follows. Cells were energized by incubating aliquots of the suspension (482.5 μl) with 20 mM glycerol (5 μl of 2 M) and with bubbled air in a bijou bottle held in a water jacket at 25°C. After exactly 3 min, [2-3H]-myo-inositol (Amersham Biosciences) at a concentration of 50 μM (12.5 μl of a 2 mM solution with specific activity 10 μCi/ml) was added with brief mixing. At times of exactly 15 sec and 2 min after adding the radiolabelled substrate, 200 μl aliquots were transferred to cellulose nitrate filters (0.45 μm pore size), pre-soaked in transport buffer, on a vacuum manifold and washed immediately with transport buffer (3 ml) three times. The filters were transferred to scintillation vials with 10 ml Emulsifier Safe liquid scintillation fluid (Perkin Elmer Ltd) and incubated overnight. The level of 3H radioactivity retained by the cells was measured by liquid scintillation counting (Packard Tri-Carb 2100TR instrument). Background counts were measured from washing filters under vacuum in the absence of cells or radiolabelled substrate. Standard counts were measured by transferring 4 μl of the radiolabelled substrate stock solution directly to a washed filter in the vial. The uptake of radiolabelled substrate into the cells was calculated using the following equation: Uptake (nmol/mg cells) = (Cell counts − Background counts) × (Total assay volume/Sample taken volume) × (1/mg of cells) × (Moles of standard/Standard counts); where dry weight of cells (mg) = Total assay volume (ml) × A680 × 0.68. For measuring the time-dependence and concentration-dependence of 3H-myo-inositol uptake, volumes and times used in the assay were modified as appropriate.
Protein purification
Inner membrane preparations were solubilized for up to 4 h at 4°C in a buffer containing 20 mM Tris (pH 8.0), 1% DDM, 20% glycerol and 300 mM sodium chloride (Supplementary Table S4, online) at a protein concentration of 3 mg/ml followed by removal of insoluble material by ultracentrifugation (100,000 g, 1 h, 4°C). Immobilized-metal affinity chromatography (IMAC) was performed by mixing the supernatant obtained above with Ni-NTA resin (QIAGEN) (1 ml per 3 mg of protein) overnight at 4°C, which was then packed into a column. Unbound material was collected followed by washing of the column with at least 40× column volumes of a buffer that contained imidazole at a concentration of 20 mM (or 40 mM in the case of IolF) (Supplementary Table S4, online). The His-tagged protein was eluted from the column using ∼ 7 ml (for a 1 ml column) of a buffer that contained 200 mM imidazole (Supplementary Table S4), which was then concentrated to a volume of ∼ 300 μl by centrifugation using a concentrator with a MW cut-off of 100 kDa (Vivaspin 20, Sartorius). Using the same column, the protein was washed a minimum of five times with at least 5 ml of a buffer containing 20 mM Tris (pH 8.0) or 10 mM KH2PO4, (pH 7.6) and 0.05% DDM, before concentrating to a volume of 200–500 μl, dispensing into aliquots, rapid freezing in liquid nitrogen and storage at −80°C. Subsequent gel filtration purification was performed on an AKTA Explorer system (GE Healthcare) using a pre-packed XK column containing Superdex™ 200 resin (GE Healthcare). The column was pre-washed and equilibrated with at least one column volume (120 ml) of storage buffer (Supplementary Table S4). Protein from the IMAC purification (4 mg in 1 ml) was centrifuged (100,000 g, 20 min, 4°C) to remove any aggregated material before loading onto the column. A column flow rate of 1 ml/min was used and 1 ml fractions were collected with monitoring for protein elution by absorbance at a wavelength of 280 nm.
Synchrotron radiation circular dichroism spectroscopy
Synchrotron radiation circular dichroism (SRCD) spectra in the far-UV region (175–260 nm) were recorded using Beamline B23 at the Diamond synchrotron on the purified proteins (20 μM) in storage buffer with 10 mM KH2PO4 (pH 7.6) (Supplementary Table S4) with a 0.2-mm path length cell at 20°C and acquiring spectra with a digital resolution of 0.5 nm using methods similar to those developed by Patching et al. (2012) for membrane proteins. Spectra of the buffer alone were also recorded and substracted from the protein spectra. Generally 4 scans per sample were undertaken and then averaged.
Results and discussion
Choice of B. subtilis proteins
In addition to IolT and IolF, which had already been identified as inositol transport proteins in B. subtilis (Introduction), we had already included the protein YfiG in our pipeline for the cloning, amplified expression, functional characterization and purification of bacterial transport proteins. We initially included YfiG as a putative sugar transport protein of the Major Facilitator Superfamily in B. subtilis (Yamamoto et al. 1996a, 1996b, http://www.membranetransport.org/protein.php?pOID= bsub1&pSynonym=YfiG), but none of the radiolabelled sugars that we tested with this protein (including D-glucose, D-galactose, L-arabinose, D-xylose) were identified as transported substrates (data not shown). The 66% amino acid sequence identity of YfiG with IolT, led us to suspect YfiG to be an inositol transport protein.
Cloning and amplified expression in E. coli
The strategy for cloning and amplifying the expression of proteins IolT, IolF and YfiG in E. coli employed the plasmid pTTQ18 (see Methods and Supplementary Figure S1 online), which has been successfully used in achieving amplified expression of a number of bacterial membrane proteins (including those in Ward et al. Citation1999, Citation2000, Potter et al. Citation2002, Morrison et al. Citation2003, Saidijam et al. Citation2003, Citation2005, Surade et al. Citation2006, Suzuki and Henderson Citation2006, Szakonyi et al. Citation2007, Ma et al. Citation2008, Goswami et al. Citation2012).
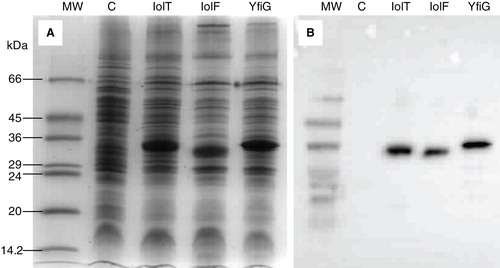
All three genes were successfully cloned and amplified expression of the proteins with a C-terminal His-tag achieved in E. coli BL21(DE3) cells grown in LB medium supplemented with glycerol and carbenicillin and induced with IPTG at an optimum concentration of 0.5 mM. To provide sufficient quantities of protein for purification and further analysis, these culture conditions were then scaled up to volumes of 10 litres and the resultant cells were used to prepare inner membranes (Methods). SDS-PAGE and Western blot analysis of the inner membrane preparations confirmed inducible amplified expression for each of the His-tagged proteins when compared with membranes from cells that contained the pTTQ18 plasmid without a gene insert (). All of the proteins had an expression level of around 10–15% of total protein in the membranes as measured by densitometric analysis and migrated on the gel at a position corresponding to a lower molecular weight than predicted from their DNA sequence (Supplementary Table S1), a phenomenon that is commonly observed with membrane proteins (Ward et al. Citation2000, Xie et al. Citation2004, Findlay et al. Citation2010).
Figure 2. Amplified expression of the His-tagged proteins in E. coli inner membrane preparations. Coomassie-stained SDS-PAGE (A) and Western blot (B) analysis of E. coli inner membrane preparations from BL21(DE3) cells containing the empty plasmid pTTQ18 (negative control, (C) or the pTTQ18 plasmid with the gene inserts for expressing IolT(His6), IolF(His6) or YfiG(His6) that were induced with 0.5 mM IPTG. The SDS-PAGE lanes were loaded with 15 μg of total protein and the blot came from a gel that was loaded with 5 μg of total protein per lane. MW, molecular weight markers.
Induction of 3H-myo-inositol transport into energized whole cells
The functional integrity of the heterologously-expressed His-tagged proteins was tested by measuring the uptake of 3H-myo-inositol into energized E. coli cells exposed to IPTG as inducer of expression of each transport system. The uptake of 3H-myo-inositol at a concentration of 50 μM into cells containing the empty plasmid pTTQ18 with no gene insert or the plasmid with gene inserts for expressing IolT(His6), IolF(His6) or YfiG(His6) from cultures that were uninduced or induced with IPTG revealed a difference in magnitude of myo-inositol transport for the three proteins in a time-course experiment of up to 10 min (). Consistent with their previously designated roles as major and minor inositol transporters in B. subtilis (Yoshida et al. Citation2002), IolT produced relatively high inducible myo-inositol transport and IolF showed relatively poor, but statistically significant inducible transport (). For IolT, uninduced cells even showed a substantial level of myo-inositol transport (), which is presumably a result of some leaky amplified expression. The uptake into cells containing the plasmid with no gene insert was slightly higher than into uninduced cells containing the plasmid for expressing IolF (), but only very low levels are being detected in these cases. YfiG showed an inducible level of myo-inositol transport that was around 16 times higher than that for IolF, but still around eight times lower than that for IolT. These results have therefore demonstrated an inducible myo-inositol transport activity for all three heterologously-expressed proteins.
Figure 3. Time-course of 3H-myo-inositol uptake into energized E. coli cells. The plots show the measured uptake of [2-3H]-myo-inositol into BL21(DE3) cells containing the empty plasmid pTTQ18 (control, ▴) or the pTTQ18 plasmid with the gene inserts for expressing IolT(His6), IolF(His6) or YfiG(His6) from cultures that were uninduced (▪) or induced (•) with 0.5 mM IPTG for 1 hour, washed and suspended to an A680 of 2.0, energized in the presence of 20 mM glycerol for 3 minutes, then incubated with [2-3H]-myo-inositol (50 μM) for a range of time points from 15 seconds to 10 minutes. The data points are the average of triplicate measurements.
![Figure 3. Time-course of 3H-myo-inositol uptake into energized E. coli cells. The plots show the measured uptake of [2-3H]-myo-inositol into BL21(DE3) cells containing the empty plasmid pTTQ18 (control, ▴) or the pTTQ18 plasmid with the gene inserts for expressing IolT(His6), IolF(His6) or YfiG(His6) from cultures that were uninduced (▪) or induced (•) with 0.5 mM IPTG for 1 hour, washed and suspended to an A680 of 2.0, energized in the presence of 20 mM glycerol for 3 minutes, then incubated with [2-3H]-myo-inositol (50 μM) for a range of time points from 15 seconds to 10 minutes. The data points are the average of triplicate measurements.](/cms/asset/17f199f5-5dca-4f08-a544-4954c6913baf/imbc_a_729093_f0003_b.jpg)
Dependence of 3H-myo-inositol transport on substrate concentration
The concentration-dependence (up to 1.6 mM) of the initial-rate of 3H-myo-inositol transport (after 15 sec) was measured and the resultant Michaelis-Menten plots () were analyzed by least-squares fits to obtain values for the apparent affinity of initial-rate transport (Km app) and its maximum velocity (Vmax ) (). IolT showed saturable myo-inositol transport over this concentration range with a Km app value of 111 ± 22 μM and a Vmax of 18.76 ± 1.06 nmol/mg cells/min, values comparable to those obtained previously with appropriate mutant strains of B. subtilis selected for transport by IolT (Km 153 μM, Vmax 13.8 nmol/min/OD600 and Km 188.6 ± 54.7) (Yoshida et al. Citation2002, Morinaga et al. Citation2010). IolF did show statistically-significant transport, but this was not saturable over the concentration range used, and the measured Km app value of 23.71 mM is reflective of the poor affinity of this protein for myo-inositol transport. Similarly for YfiG, the highest practicable substrate concentration was not sufficient to define a hyperbola, so the measured Km app value of 9.85 mM and a Vmax of 124.68 ± 111.02 nmol/mg cells/min are not reliable; they do indicate that myo-inositol transport by YfiG that has an affinity for myo-inositol intermediate between those for IolT and IolF.
Table I. Steady-state kinetic parameters for initial-rate measurements of 3H-myo-inositol transport. Values for the apparent affinity of initial-rate transport (K m app) and its maximum velocity (V max ) were calculated using Graph Pad Prism 5 software for least-squares fits of the data to the Michaelis-Menten equation for the concentration-dependent uptake of myo-inositol into energized E. coli whole cells measured after 15 seconds ().
Figure 4. Concentration-dependence of initial-rate 3H-myo-inositol uptake into energized E. coli cells. Michaelis-Menten plots for the uptake of [2-3H]-myo-inositol after 15 seconds into BL21(DE3) cells containing the empty plasmid pTTQ18 (control, ▴) or the pTTQ18 plasmid with the gene inserts for expressing IolT(His6), IolF(His6) or YfiG(His6) from cultures that were uninduced (▪) or induced (•) with 0.5 mM IPTG for 1 hour, washed and suspended to an A680 of 2.0, energized in the presence of 20 mM glycerol for 3 minutes, then incubated for 15 seconds with [2-3H]-myo-inositol at a range of concentrations (0.025, 0.05, 0.1, 0.2, 0.4, 0.8 and 1.6 mM). The data points are the average of triplicate measurements.
![Figure 4. Concentration-dependence of initial-rate 3H-myo-inositol uptake into energized E. coli cells. Michaelis-Menten plots for the uptake of [2-3H]-myo-inositol after 15 seconds into BL21(DE3) cells containing the empty plasmid pTTQ18 (control, ▴) or the pTTQ18 plasmid with the gene inserts for expressing IolT(His6), IolF(His6) or YfiG(His6) from cultures that were uninduced (▪) or induced (•) with 0.5 mM IPTG for 1 hour, washed and suspended to an A680 of 2.0, energized in the presence of 20 mM glycerol for 3 minutes, then incubated for 15 seconds with [2-3H]-myo-inositol at a range of concentrations (0.025, 0.05, 0.1, 0.2, 0.4, 0.8 and 1.6 mM). The data points are the average of triplicate measurements.](/cms/asset/aef1f7c2-ec2e-49f5-9241-828dbf2de74d/imbc_a_729093_f0004_b.jpg)
Specificities of inositol recognition by IolT, IolF and YfiG
Recognition of inositols and sugars by the three proteins was investigated by measuring the effects of unlabelled potentially competing compounds at a concentration of 500 μM on the transport of 3H-myo-inositol from a concentration of 50 μM into whole cells using the assay described above. Six different stereoisomers of inositol [myo (1), D-chiro (2), L-chiro (4), allo (5), epi (6), muco (7)] and 11 different sugars were tested ( and Supplementary Figure S6, online). The inositol stereoisomers scyllo (3), neo (8) and cis (9) were not tested due to their unavailability from commercial sources or insolubility under the assay conditions. Transport of 3H-myo-inositol by all three proteins was not significantly affected by any of the non-inositol sugars that were tested, including D-xylose, which is the one structurally most similar to myo-inositol. This confirms that the proteins have a high specificity for inositols over sugars, which are the substrates for quite closely related proteins from the Major Facilitator Superfamily (Introduction).
Transport of 3H-myo-inositol by IolT was almost completely abolished in the presence of both unlabelled myo-inositol and D-chiro-inositol ( and Supplementary Figure S6), which confirms the conclusions from growth and transport experiments that had already identified both of these stereoisomers as transported substrates (Morinaga et al. Citation2010). Our competition experiments further confirm the high specificity of IolT for recognizing both myo- and D-chiro-inositol since the other isomers of inositol that were tested had no significant effect on 3H-myo-inositol transport ( and Supplementary Figure S6). Transport of 3H-myo-inositol by IolF was reduced only by D-chiro-inositol ( and Supplementary Figure S6), which is consistent with experiments that had already identified a preference of IolF for transporting this isomer (Morinaga et al. Citation2010). The competition experiments performed with IolF, however, are unreliable owing to the low level of 3H-myo-inositol transport, which is not even reduced by unlabelled myo-inositol ( and Supplementary Figure S6). Ours is the first investigation of ligand recognition by YfiG, in which 3H-myo-inositol transport was almost abolished or significantly reduced by competition with myo-, D-chiro- and L-chiro-inositol; transport was not significantly affected by any of the other compounds tested ( and Supplementary Figure S6). These results therefore confirm the high specificity of YfiG for inositols over sugars and constitute the first identification of a protein that can recognize and bind L-chiro-inositol.
Table II. Specificities of ligand recognition by IolT, IolF and YfiG. Uptakes of [2-3H]-myo-inositol (50 μM) were measured after 2 minutes in energized E. coli cells containing the plasmid with gene inserts for expressing IolT(His6), IolF(His6) or YfiG(His6) in the absence or presence of unlabelled competing compounds at a concentration of 500 μM incubated with the cells for 3 minutes before adding the 3H-myo-inositol. The uptake from cells with no competing compound present (bottom of table) was taken as the 100% value. These data are derived from an average of triplicate measurements with standard deviations of at most 5%.
Physiological significance of YfiG
Until this current work, IolT and IolF had been the only inositol transport proteins in B. subtilis with their functions identified experimentally. It is somewhat surprising to have now identified YfiG as a third transporter of myo-inositol in this organism as it is not expressed from the iol operons and its expression is not controlled by IolR. Instead, YfiG is expressed from an operon that includes the genes yfiF, yfiG and yfiH, which had been proposed as a sugar-proton symport operon based on sequence homologies with sugar transport proteins in E. coli (Yamamoto et al. Citation1996a, Citation1996b). The sequence identity of YfiG with IolT is almost double that compared with the sugar transporters, however, and our experiments have confirmed that YfiG transports myo-inositol and at least recognizes D-chiro and L-chiro inositols, but does not transport or recognize (bind) a number of different sugars. In the previously published work that used an IolT/IolF double knockout strain of B. subtilis (Yoshida et al. Citation2002, Morinaga et al. Citation2010) the residual cell growth observed with myo-inositol as sole carbon source and the residual myo-inositol transport activity may have originated from transport by YfiG, but further experiments using a yfiG gene knockout strain would be required to confirm this. An alternative explanation is that YfiG expression is not induced by myo-inositol under physiological conditions and the transport activity that we observe is only made possible by artificial amplified expression, therefore suggesting YfiG to be a redundant transporter in B. subtilis. It is also possible that a different, yet to be identified, substrate is also transported by YfiG.
Purification and structural integrity of the proteins
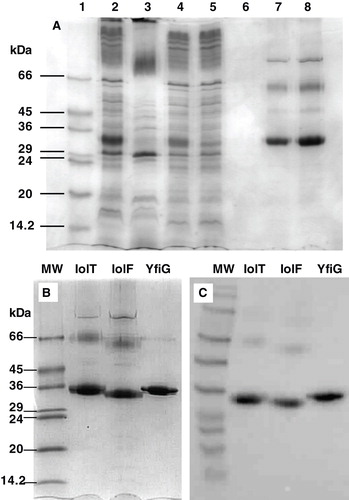
The suitability of the proteins for crystallization trials was determined by assessing their purification, content of secondary structure, thermal stability and monodispersity. The inner membrane preparations were solubilized using the detergent n-dodecyl-β-D-maltoside (DDM) at a concentration of 1% (w/v) followed by purification using immobilized metal affinity chromatography (IMAC) with a Ni-affinity column (Methods). An example SDS-PAGE analysis of a full solubilization and purification profile is shown for IolF in . All three proteins were successfully isolated in 0.05% (w/v) DDM at a purity of greater than 90% as measured by densitometric analysis of the Coomassie-stained stained SDS-PAGE separations (). The identity and C-terminal integrity of the purified proteins was confirmed by Western blotting analysis under conditions that detect the His6-tag (); taken with the correct results for N-terminal sequencing of all three proteins, this confirmed full integrity of the expected protein sequences. All three proteins gave a yield from the IMAC purification that equates to around 0.5–0.6 mg of protein per litre of cell culture, which is at the lower end of the quantity that we would normally accept for going forward to crystallization trials, though we would envisage to scale up expression and purification procedures in cases where monodisperse and stable protein was being achieved.
Figure 5. Solubilization and purification of the proteins from E. coli inner membranes. (A) A full SDS-PAGE analysis of the solubilization and purification procedure for IolF(His6) is shown, where the lanes contain: (1) molecular weight markers; (2) IolF(His6) inner membranes; (3) unsolubilized fraction (pellet); (4) solubilized fraction (supernatant); (5) unbound fraction (from column); (6) column wash; (7) eluted and concentrated protein (5 μg); (8) eluted and concentrated protein (10 μg). Coomassie-stained SDS-PAGE (B) and Western blot (C) analyses of IolT(His6), IolF(His6) and YfiG(His6) proteins that had been solubilized from inner membrane preparations, purified on a Ni-affinity column and reconstituted into DDM detergent micelles. The SDS-PAGE lanes were loaded with 10 μg of total protein and the blot came from a gel that was loaded with 5 μg of protein per lane. MW, molecular weight markers.
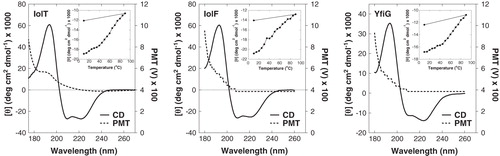
The retention of secondary structure of the IMAC-purified proteins was analyzed by synchrotron radiation circular dichroism (SRCD) spectroscopy in the far-UV region (180–260 nm); this yielded the classical spectra expected for proteins with a high α-helix content of above 80% that are intact and fully-folded (). The thermal stability of the proteins was investigated by monitoring the SRCD spectra over a range of temperatures from 10–90°C and then back to 10°C at a wavelength of 222 nm (). All three proteins showed a relatively sharp decline in structural integrity with increasing temperature and this was not recovered when the temperature was lowered back to 10°C. The fact that there was some loss of structural integrity even below a temperature of 25 °C would be of some concern for crystallization trials with these proteins.
Figure 6. Analysis of secondary structure in the purified proteins. Synchrotron radiation circular dichroism (SRCD) spectra at 20°C in the far-UV region are shown for the purified IolT(His6), IolF(His6) and YfiG(His6) proteins at a concentration of 20 μM in a buffer containing 0.05% DDM and 10 mM potassium phosphate (pH 7.6) using a 0.2-mm path length cell and acquiring spectra with an integration time of sec, slit 0.5 mm equivalent to 1.2 nm bandwidth, scan speed of 34 nm/min. The spectra are buffer-subtracted and are the average of 4 scans. The plots show the CD spectrum (CD) and the photomultiplier tube (PMT) voltage values. Inset are thermal stability profiles at a wavelength of 222 nm from CD spectra recorded over a range of temperatures (10–90°C and then back to 10°C) for each of the proteins.
Further purification of the proteins was performed by gel filtration chromatography with analysis for monodispersity as the next step to investigate their suitability for crystallization trials. For IolT, most of the protein eluted in the void volume from the gel filtration column (Supplementary Figure S7, online) indicating a tendency to aggregate and the recovery of monomeric and monodisperse protein was negligible. N-terminal sequencing of the monomeric protein revealed a susceptibility to truncation as two species in a ratio of 40:60 were identified, the minor one being consistent with the full-length protein and the major one with protein that had lost twelve amino acid residues from the N-terminus. Together with the fact that this protein had also shown a tendency to precipitate out of solution on concentrating to a smaller volume before loading onto the gel filtration column and that a 30-l fermenter culture had produced only a poor cell yield, moving IolT forward to crystallization trials was considered not suitable with this protein. YfiG showed an even greater tendency to precipitate out of solution on concentrating to a smaller volume before loading onto the gel filtration column, so eliminating its suitability for moving forward to crystallization trials.
In contrast, IolF has showed no tendency to precipitate out of solution. The gel filtration profile for IolF (Supplementary Figure S8A) shows a majority of the protein to be aggregated under the conditions tested so far, but does show some promise as the eluted protein appears to be highly pure and undegraded as shown by SDS-PAGE and Western blot analysis (Supplementary Figure S8, B and C). Further investigation of detergent reconstitution conditions with IolF may lead to a monodisperse form of the protein for moving forward into crystallization trials.
Conclusions
This work has demonstrated a systematic approach for the cloning, functional tests, amplified expression, purification and analysis of structural integrity and stability of three inositol transport proteins from B. subtilis, thereby illustrating the important factors to consider before using any membrane proteins in crystallization trials. Since IolT and YfiG both tended to precipitate from solution and the former even degraded as well, these are eliminated from further work towards crystallization trials. Even though the elution profile of IolF shows several peaks, the SEC-purified protein is nevertheless very pure and has shown no detectable degradation. Since the elution buffer simply contains 10 mM KPi (pH 7.5), 5% glycerol and 0.05% DDM, there is ample scope for optimizing pH, salt, different detergents and other stabilizing additives to improve its potential for crystallization trials.
Also, we have confirmed that IolT is the most active transport protein for myo-inositol in B. subtilis and found that it also recognizes D-chiro-inositol. IolF was confirmed to be a relatively inefficient transporter of myo-inositol with a preference for recognizing D-chiro-inositol. YfiG was identified as a transporter of myo-inositol that also recognizes D-chiro-inositol and, surprisingly, L-chiro-inositol. This appears to be the first evidence for the recognition of L-chiro-inositol by any protein. It will be useful to perform further investigations of ligand recognition and transport with these proteins, including the use of a range of different radiolabelled inositol stereoisomers, to improve understanding of the molecular mechanisms of their function and relate the information to inositol transporters in humans.
Acknowledgements
This work was funded by the European Drug Initiative for Channels and Transporters consortium (EDICT, contract 201924). The authors thank the Diamond Light Source for supporting time on Beamline B23 for SRCD experiments and Dr Andrea Rawlings (University of Leeds) for assistance with size-exclusion chromatography. Protein N-terminal sequencing was performed by Dr Jeff Keen (University of Leeds).
Declaration of interest: The authors report no conflicts of interest. The authors alone are responsible for the content and writing of the paper.
References
- Abramson J, Smirnova I, Kasho V, Verner G, Kaback HR, Iwata S. 2003. Structure and mechanism of the lactose permease of Escherichia coli. Science 301:610–615.
- Augustin R. 2010. The protein family of glucose transport facilitators: It's not only about glucose after all. IUBMB Life 62:315–333.
- Chung CT, Niemela SL, Miller RH. 1989. One-step preparation of competent Escherichia coli: Transformation and storage of bacterial cells in the same solution. Proc Natl Acad Sci USA 86:2172–2175.
- Dang S, Sun L, Huang Y, Lu F, Liu Y, Gong H, 2010. Structure of a fucose transporter in an outward-open conformation. Nature 467:734–738.
- Di Daniel E, Mok MHS, Mead E, Mutinelli C, Zambello E, Caberlotto LL, 2009. Evaluation of expression and function of the H+/myo-inositol transporter HMIT. BMC Cell Biol 10:54.
- Fenili D, Weng Y-Q, Aubert I, Nitz M, McLaurin J. 2011. Sodium/myo-inositol transporters: Substrate transport requirements and regional brain expression in the TgCRND8 mouse model of amyloid pathology. PLoS One 6:e24032.
- Findlay HE, Rutherford NG, Henderson PJ, Booth PJ. 2010. Unfolding free energy of a two-domain transmembrane sugar transport protein. Proc Natl Acad Sci USA 107:18451–18456.
- Fux M, Levine J, Aviv A, Belmaker RH. 1996. Inositol treatment of obsessive-compulsive disorder. Am J Psychiatry 153:1219–1221.
- Goswami D, Kaur J, Surade S, Grelland E, Michel H. 2012. Heterologous production, functional and thermodynamic characterization of cation diffusion facilitator (CDF) transporters of mesophilic and hyperthermophilic origin. Biological Chemistry. 393:617–629.
- Henderson PJF, Giddens RA, Jones-Mortimer MC. 1977. Transport of galactose, glucose and their molecular analogues by Escherichia coli K12. Biochem J 162:309–320.
- Henderson PJF, Macpherson AJ. 1986. Assay, genetics, proteins and reconstitution of proton-linked galactose, arabinose and xylose transport systems of Escherichia coli. Methods Enzymol 125:387–429.
- Huang Y, Lemieux MJ, Song J, Auer M, Wang DN. 2003. Structure and mechanism of the glycerol-3-phosphate transporter from Escherichia coli. Science. 301:616–620.
- Inouea H, Nojimab H, Okayama H. 1990. High efficiency transformation of Escherichia coli with plasmids. Gene 96:23–28.
- Iuorno MJ, Jakubowicz DJ, Baillargeon JP, Dillon P, Gunn RD, Allan G, 2002. Effects of D-chiro-inositol in lean women with the polycystic ovary syndrome. Endocr Pract 8:417–423.
- Laemmli UK. 1970. Cleavage of structural proteins during the assembly of the head of bacteriophage T4. Nature 227:680–685.
- Ma P, Yuille HM, Blessie V, Göhring N, Iglói Z, Nishiguchi K, 2008. Expression, purification and activities of the entire family of intact membrane sensor kinases from Enterococcus faecalis. Mol Membr Biol 25:449–473.
- McLaurin J, Kierstead ME, Brown ME, Hawkes CA, Lambermon MH, Phinney AL, 2006. Cyclohexanehexol inhibitors of Abeta aggregation prevent and reverse Alzheimer phenotype in a mouse model. Nat Med 12:801–808.
- Michell RH. 2008. Inositol derivatives: Evolution and functions. Nat Rev Mol Cell Biol 9:151–161.
- Morinaga T, Matsuse T, Ashida H, Yoshida K. 2010. Differential substrate specificity of two inositol transporters of Bacillus subtilis. Biosci Biotechnol Biochem 74:1312–1314.
- Morrison S, Ward A, Hoyle CJ, Henderson PJF. 2003. Cloning, expression, purification and properties of a putative multidrug resistance efflux protein from Helicobacter pylori. Int J Antimicrob Agents 22:242–249.
- Ostlund RE, Seemayer R, Gupta S, Kimmel R, Ostlund EL, Sherman WR. 1996. A stereospecific myo-inositol/D-chiro-inositol transporter in HepG2 liver cells: Identification with D-chiro-[3-3H]inositol. J Biol Chem 271:10073–10078.
- Patching SG, Edara S, Ma P, Nakayama J, Hussain R, Siligardi G, 2012. Interactions of the intact FsrC membrane histidine kinase with its pheromone ligand GBAP revealed through synchrotron radiation circular dichroism. Biochim Biophys Acta – Biomem 1818:1595–1602.
- Potter CA, Ward A, Laguri C, Williamson MP, Henderson PJF, Phillips-Jones MK. 2002. Expression, purification and characterisation of full-length histidine protein kinase RegB from Rhodobacter sphaeroides. J Mol Biol 320:201–213.
- Saidijam M, Psakis G, Clough JL, Meuller J, Suzuki S, Hoyle CJ, 2003. Collection and characterisation of bacterial membrane proteins. FEBS Lett 555:170–175.
- Saidijam M, Bettaney KE, Szakonyi G, Psakis G, Shibayama K, Suzuki S, 2005. Active membrane transport and receptor proteins from bacteria. Biochem Soc Trans 33:867–872.
- Salloway S, Sperling R, Keren R, Porsteinsson AP, van Dyck CH, Tariot PN, 2011. A phase 2 randomized trial of ELND005, scyllo-inositol, in mild to moderate Alzheimer disease. Neurology 77:1253–1262.
- Schaffner W, Weissmann C. 1973. A rapid, sensitive, and specific method for the determination of protein in dilute solution. Anal Biochem 56:502–514.
- Stark MJR. 1987. Multicopy expression vectors carrying the lac repressor gene for regulated high-level expression of genes in Escherichia coli. Gene 51:255–267.
- Surade S, Klein M, Stolt-Bergner PC, Muenke C, Roy A, Michel H. 2006. Comparative analysis and ‘expression space' coverage of the production of prokaryotic membrane proteins or structural genomics. Prot Sci 15:2178–2189.
- Suzuki S, Henderson PJF. 2006. The hydantoin transport protein from Microbacterium liquefaciens. J Bacteriol 188:3329–3336.
- Szakonyi G, Leng D, Ma P, Bettaney KE, Saidijam M, Ward A, 2007. A genomic strategy for cloning, expressing and purifying efflux proteins of the Major Facilitator Superfamily. J Antimicrob Chemother 59:1265–1270.
- Uldry M, Ibberson M, Horisberger JD, Chatton J-Y, Riederer BM, Thorens B. 2001. Identification of a mammalian H+-myo-inositol symporter expressed predominantly in the brain. EMBO J 20:4467–4477.
- Uldry M, Thorens B. 2004. The SLC2 family of facilitated hexose and polyol transporters. Pflugers Arch – Eur J Physiol 447:480–489.
- Ward A, O'Reilly J, Rutherford NG, Ferguson SM, Hoyle CK, Palmer SA, 1999. Expression of prokaryotic membrane transport systems in Escherichia coli. Biochem Soc Trans 27:893–899.
- Ward A, Sanderson NM, O'Reilly J, Rutherford NG, Poolman B, Henderson PJF. 2000. The amplified expression, identification, purification, assay and properties of hexahistidine-tagged bacterial membrane transport proteins. In: Baldwin SA, editor. Membrane transport – a practical approach. Oxford: Blackwell. pp 141–166.
- Witholt B, Boekhout M, Brock M, Kingma J, van Heerikhuizen H, de Leij L. 1976. An efficient and reproducible procedure for the formation of spheroplasts from variously grown Escherichia coli. Anal Biochem 74:160–170.
- Xie H, Patching SG, Gallagher MP, Litherland GJ, Brough AR, Venter H, 2004. Purification and properties of the Escherichia coli nucleoside transporter NupG, a paradigm for a major facilitator transporter sub-family. Mol Membr Biol 21:323–336.
- Yamamoto H, Uchiyama S, Fajar AN, Sekiguchi J. 1996a. The Bacillus subtilis chromosome region near 78° contains the genes encoding a new two-component system, three ABC transporters and a lipase. Gene 181:147–151.
- Yamamoto H, Uchiyama S, Fajar AN, Ogasawara N, Sekiguchi J. 1996b. Determination of a 12 kb nucleotide sequence around the 76° region of the Bacillus subtilis chromosome. Microbiology 142:1417–1421.
- Yamaoka M, Osawa S, Morinaga T, Takenaka S, Yoshida K. 2011. A cell factory of Bacillus subtilis engineered for the simple bioconversion of myo-inositol to scyllo-inositol, a potential therapeutic agent for Alzheimer's disease. Microb Cell Fact 10:69.
- Yoshida K, Aoyama D, Ishio I, Shibayama T, Fujita Y. 1997. Organization and transcription of the myo-inositol operon, iol, of Bacillus subtilis. J Bacteriol 179:4591–4598.
- Yoshida K, Yamamoto Y, Omae K, Yamamoto M, Fujita Y. 2002. Identification of two myo-inositol transporter genes of Bacillus subtilis. J Bacteriol 184:983–991.
- Yoshida K, Yamaguchi M, Morinaga T, Kinehara M, Ikeuchi M, Ashida H, 2008. Myo-Inositol catabolism in Bacillus subtilis. J Biol Chem 283:10415–10424.