
Abstract
Like other integral membrane proteins, the activity of the Sarco/Endoplasmic Reticulum Ca2+-ATPase (SERCA) is regulated by the membrane environment. Cholesterol is present in the endoplasmic reticulum membrane at low levels, and it has the potential to affect SERCA activity both through direct, specific interaction with the protein or through indirect interaction through changes of the overall membrane properties. There are experimental data arguing for both modes of action for a cholesterol-mediated regulation of SERCA. In the current study, coarse-grained molecular dynamics simulations are used to address how a mixed lipid-cholesterol membrane interacts with SERCA. Candidates for direct regulatory sites with specific cholesterol binding modes are extracted from the simulations. The binding pocket for thapsigargin, a nanomolar inhibitor of SERCA, has been suggested as a cholesterol binding site. However, the thapsigargin binding pocket displayed very little cholesterol occupation in the simulations. Neither did atomistic simulations of cholesterol in the thapsigargin binding pocket support any specific interaction. The current study points to a non-specific effect of cholesterol on SERCA activity, and offers an alternative interpretation of the experimental results used to argue for a specific effect.
Introduction
Deciphering how integral membrane proteins interact with the surrounding lipid environment is key to the understanding of how biological membranes work. However, membranes are complex, dynamic structures and the effects of individual membrane components on membrane proteins can either be of a specific or a non-specific nature. Non-specific regulation can arise from changes in the bulk properties of the membrane such as thickness, curvature and fluidity or from the membrane as a general solution environment to the protein. The lipids interacting directly (but non-specifically) with an integral membrane protein constitute a general solution environment for the hydrophobic surface of the protein. They are termed annular lipids as they form a lipid annulus around the membrane protein (Lee, Citation2011). However, lipid membrane components such as anionic lipids or cholesterol may also interact specifically with membrane proteins (Connolly et al., Citation1985; Cherezov et al., Citation2007; Fan & Makielski, Citation1997; Heginbotham et al., Citation1998; Jones & McNamee, Citation1988; Lifshitz et al., Citation2007; Ryan et al., Citation1996; Shinzawa-Itoh et al., Citation2007). Specific protein-lipid interactions might serve to stabilize the protein structure or regulate its activity, and as such, this type of lipid is not considered as a part of the lipid annulus. Instead, these lipids are termed non-annular, expected to be more tightly bound and typically found between protein subunits or individual transmembrane (TM) α-helices (Lee, Citation2003).
Cholesterol plays a central role in cell biology. Its presence in cell membranes introduces orientational order and increases the hydrophobic thickness of the bilayer (Yeagle et al., Citation1990). The cellular level of cholesterol in mammals is therefore carefully controlled to retain it within a specific, narrow range for each cellular compartment; e.g. the cholesterol level is relatively high in the plasma membrane yielding a highly organized membrane, while it is significantly lower in the more disordered and fluid-like Sarco/Endoplasmic Reticulum (SR and ER) membrane, despite the fact that cholesterol is synthesized in the ER (van Meer et al., Citation2008). As cholesterol is also known to interact with membrane proteins in a specific manner (Hong & Amara, Citation2010; Jones & McNamee, Citation1988; Shinoda et al., Citation2009; Yeagle et al., Citation1988; Zocher et al., Citation2012), it can be difficult to distinguish from non-specific effects when interpreting the basis for the effect of cholesterol on protein activity.
The Sarco/Endoplasmic Reticulum Ca2+-ATPase (SERCA) from fast-twitch skeletal muscle has been a widely used model in biophysical studies of the interaction between integral membrane proteins and the lipid component of their cellular membranes. By now, it is well-established that the function of SERCA is highly dependent on lipids through indirect, non-specific membrane effects such as the hydrophobic thickness and the fluidity of the surrounding bilayer (Gustavsson et al., Citation2011; Johannsson et al., Citation1981; Starling et al., Citation1993; Sonntag et al., Citation2011). However, it is evident from X-ray diffraction studies that SERCA is endowed with several intramembranous sites for specific binding of native lipids and other hydrophobic compounds (Clausen et al., Citation2013; Drachmann et al., Citation2014; Obara et al., Citation2005; Toyoshima et al., Citation2004, Citation2011; Takahashi et al., Citation2007; Winther et al., Citation2010). A particularly well-studied example is that of thapsigargin, a plant sesquiterpene lactone, which is a high-affinity specific inhibitor of SERCA (Davidson & Varhol, Citation1995), that in the past few years has gained attention as the core compound of a pro-drug strategy for treatment of prostate cancer (Denmeade et al., Citation2012).
Integral membrane proteins co-evolve with the lipids in the membranous environment in which they operate (Lee, Citation2002), and it appears that SERCA has adapted to function in the thin, cholesterol-poor (4–8 molar percentage in fast-twitch skeletal muscle (Borchman et al., Citation1982, Citation1999; Meissner & Fleischer, Citation1971)) and highly fluid environment of the ER/SR membrane (Davis & Poznansky, Citation1987). Thus, SERCA is likely to be sensitive to changes in cholesterol levels in the ER membrane. For instance, in advanced atherosclerotic lesions, enrichment of cholesterol in the ER membranes of macrophages has been observed to result in inhibition of SERCA2b (Brown & Goldstein, Citation1983; Li et al., Citation2004). In general, SERCA inhibition causes depletion of the ER stores of Ca2+, followed by ER stress and increased cytosolic Ca2+ levels, circumstances that can lead to apoptosis, as observed for thapsigargin inhibition of SERCA1a (Papp et al., Citation1991; Thastrup et al., Citation1990). An unsettled question is whether cholesterol can affect SERCA through specific, direct interaction similar to thapsigargin, or if its effect is purely non-specific through changes of the physical properties of the membrane.
Based mainly on a number of fluorometric studies, Lee and colleagues favor a model of direct, specific cholesterol inhibition of SERCA activity through non-annular sites located between TM α-helices of SERCA (Ding et al., Citation1994; East & Lee, Citation1982; Simmonds et al., Citation1982, Citation1984). However, other studies have supported an indirect and non-specific, inhibitory effect of cholesterol through a decrease in membrane fluidity and other physicochemical parameters (Borchman et al., Citation1999; Cheng et al., Citation1986; Li et al., Citation2004; Moore et al., Citation1978; Whiting et al., Citation2000). With the current study, we address the roles of specific or non-specific regulation of SERCA by cholesterol through molecular dynamics (MD) simulations, an approach which has not previously been used in addressing the effects of cholesterol on SERCA. With the MD simulations we analyze the dynamics of the lipid annulus components and explore, to what extent SERCA possesses regions that can serve as candidates for specific, regulatory sites for binding of cholesterol. Special attention is paid to the thapsigargin binding pocket, which is a well-documented, inhibitory site of SERCA (Skytte et al., Citation2010; Winther et al., Citation2010). The MD simulations were set up by coarse-grained (CG) procedures, and for the thapsigargin site also at the atomistic (AT) level, to obtain detailed information as to how cholesterol might fit into the thapsigargin binding pocket. The simulations provide detailed insight into how both phosphatidylcholine lipids and cholesterol molecules interact with SERCA, and may serve as a general model for assessing interactions of membrane proteins with non-annular lipids as well as a means to investigate the importance of binding of cholesterol at specific protein sites.
Experimental procedures
All simulation set-ups encompassed the SERCA monomer embedded in a membrane and solvated with water on each side of the membrane. Since one of the aims of the study was to uncover if cholesterol could interact with SERCA in a manner similar to thapsigargin, a SERCA1a structure in the E2 state (PDB ID 2C8K (Jensen et al., Citation2006)) from which the co-crystallized thapsigargin had been removed, was used as the initial protein model. The membrane surrounding the ATPase was composed of either 1-palmitoyl-2-oleoyl-sn-glycero-3-phosphocholine (POPC) lipids, or of a mixture of POPC and cholesterol, present in a molar ratio of 10:1, slightly higher than the reported 4–8% content of cholesterol in ER membranes (Borchman et al., Citation1982, Citation1999; Meissner & Fleischer, Citation1971).
CG MD simulations
The CG simulations were set up and carried out using the Gromacs v. 4.5.5 simulating package (Van Der Spoel et al., Citation2005) with POPC lipid and cholesterol models from MARTINI v.2.0 and protein and water models from MARTINI v.2.1 (Marrink et al., Citation2007; Monticelli et al., Citation2008). The mapping is four-to-one in MARTINI, meaning that four heavy atom groups are mapped into a single interaction center on average. The coarser resolution does not allow for specific atom interaction insights to be achieved from the simulations, however, the fewer degrees of freedom (DOF) permit a significant increase in the spatial and temporal limitations for the MD simulation. The CG mapping of cholesterol and POPC is illustrated in . The CG model for proteins maps each amino acid into one to five CG beads, of which one represents the backbone atoms. The CG bead type is assigned based on the physiochemical properties of the atom group that it represents, which in turn determines its interaction strength with other beads. To maintain a stable tertiary structure of SERCA, the MARTINI CG protein model was augmented with an elastic network model, ElNeDyn (Periole et al., Citation2009). The elastic network bonds were maintained by a force constant of KS = 1000 kJ mol−1 nm−2 between all backbone beads, separated by at least two positions in the protein sequence, and with a distance to each other of less than the cut-off RC = 0.7 nm (Scott et al., Citation2008). While the elastic network maintains the protein structure in the initial conformation, it still allows for local rearrangements of beads to accommodate different interactions with surrounding molecules. The CG set-up is therefore not appropriate for studying protein structure changes or atom interactions, but suited for molecule interaction studies.
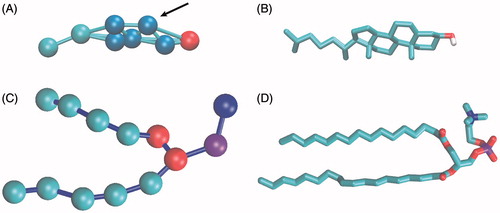
Figure 1. Representation of cholesterol and POPC molecules in CG and AT. (A) CG structure of cholesterol. Polar head-group bead (ROH) is shown in red, ring beads (R1–R5) in blue, tail beads (C1–C2) in cyan. Connectivity between beads is shown with sticks. The arrow marks the position (R2 site) which would correspond to the brominated site. (B) AT structure of cholesterol in stick representation. Non-polar hydrogens are not shown, oxygen is shown in red and carbons in cyan. (C) CG structure of POPC. Choline bead is shown in blue, phosphate bead in purple, glycerol linkage beads in red and hydrophobic tail beads in cyan. (D) AT structure of POPC in stick representation. Hydrogens are not shown, oxygen in red, nitrogen in blue, phosphorus in purple and carbons in cyan.
In CG simulations, the heavier bead-particles with a reduced number of DOF, smooth the energy surface and accelerate the dynamics compared to AT simulations in which each particle represents a single atom. It has been shown that the simulated time should typically be multiplied by a speedup factor of 4, to roughly account for the increase in diffusion observed for CG water beads (Marrink & Mark, Citation2004; Marrink et al., Citation2007). This converted time is referred to as the “real time”, and is the time used in the analyses throughout the study.
Thirty independent MD simulations were produced from the same initial set-up, using different random seeds for the initial velocities. POPC and cholesterol molecules in a molar ratio of 10:1 were evenly distributed in the simulation box with random positions and orientations (resulting in 370 POPC molecules and 37 cholesterol molecules) (). The molar ratio of POPC and cholesterol was set slightly higher than experimental values for the SR to increase the sampling. Counter ions (12 Na+) were added to neutralize the system, and standard CG water beads, each representing four water molecules, were added to solvate the system (Marrink et al., Citation2007). The resulting simulation box had a dimension of 117 × 120 × 184 Å, and periodic boundary conditions were applied. Neither thapsigargin nor the ATP analog present in the 2C8K structure were included in the set-up.
Figure 2. SERCA-bilayer self-assembly during the CG simulations. SERCA is shown as a backbone trace and colored by domains as follows: A-domain in yellow, N-domain in red, P-domain in blue, TM1–2 in pink, TM3–4 in green, TM5–6 in violet and TM7–10 in ochre. Lipids are shown as cyan sticks with the phosphate bead as a purple sphere. Water and ion beads are omitted for clarity. Cholesterol is shown as blue sticks with the polar head bead as a red sphere. (A) Starting structure with the CG representation of SERCA positioned in the middle of the box and lipids and cholesterol scattered around with random positions and orientations. (B) Snapshot after 120 ns of simulation, just before release of the position restraints on the protein backbone beads. (C) Snapshot after 1.32 μs of simulation of which the last 1.2 μs were run without position restraints and the protein represented with a MARTINI-ELNEDYN model (Periole et al., Citation2009). For more snapshots from the self-assembly process, see Figure S1 in the Supplementary Material, available online.
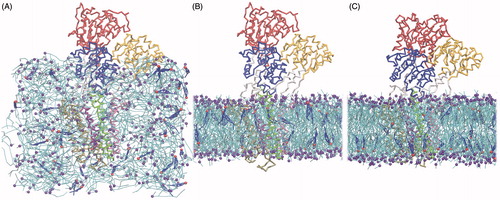
The simulations were run using 15 fs time steps. Non-bonded interactions were shifted to zero using the standard cutoff schemes in MARTINI; The Lennard-Jones interactions were shifted in the range of 0.9–1.2 nm and the electrostatic interactions in the range of 0.0–1.2 nm. The neighbor list was updated every 10 steps and the temperature was kept constant at 323 K. The pressure coupling was set to isotropic during the bilayer self-assembly and kept constant at 1 bar. After bilayer formation, the pressure coupling was changed to semi-isotropic. The temperature and pressure were controlled by the Berendsen coupling algorithm (Berendsen et al., Citation1984) with time constants τt = 0.3 ps for temperature and τp = 3 ps for pressure. Following a short minimization of the system, 30 ns of MD simulation (120 ns in “real time”) were carried out with position restraints (1000 kJ mol−1 nm−2) applied to all protein beads, to allow the bilayer to self-assemble around the protein ( and Supplementary Figure S1, available online). The simulation was then extended for another 300 ns (1.2 μs in “real time”) with all position restraints removed ().
For each of the 30 simulations, 202 snapshots evenly spread over the last 600 ns of the simulation were used for analysis of SERCA-cholesterol interactions. Cholesterol was considered to form a contact with SERCA if a sterol bead was found within 7 Å of a protein bead. Furthermore, a sterol was considered to interact with SERCA if at least 35% of the molecule (three beads) were in contact with protein beads. Interactions shorter than 12 ns (4 snapshots) were ignored. Likewise, if an interaction was broken for less than 12 ns, it was not registered as a break. Similar definitions were applied to POPC lipids of the annulus.
The fluorometric studies discussed in this paper (Ding et al., Citation1994; East & Lee, Citation1982; Simmonds et al., Citation1982, Citation1984) are based on a technique which employs the fluorescence quenching properties of either brominated cholesterol or phospholipids to detect the displacement of sterol or lipids from the annulus around SERCA (Simmonds et al., Citation1982). Fluorescence quenching of a tryptophan residue in SERCA by a brominated molecule requires that the tryptophan residue is at the lipid-protein interface or that it is connected by energy transfer to a tryptophan residue at the interface (Ding et al., Citation1994). The tryptophan fluorescence quenching efficiency, E, exerted by a particular cholesterol binding mode observed in the CG simulations was estimated by the Förster energy transfer theory (Marius et al., Citation2008):
(1)
where r is the distance between the tryptophan residue and the dibromide group of the brominated molecule, and R0 is the distance at which the energy transfer efficiency is 50%. For tryptophan quenching, R0 is set to 8 Å (Bolen & Holloway, Citation1990). In the fluorometric studies discussed in this paper, the studied sterols are brominated at the double bond present in the cholesterol skeleton. In the CG model of cholesterol, the position of the double bond would correspond to the R2 site, marked by an arrow in . The distance, r, between the R2 site of a bound cholesterol and the center-of-mass of a tryptophan side chain (comprised by four beads) was therefore used to calculate the quenching capabilities of a particular cholesterol binding mode relative to a particular tryptophan residue in the current study (Figures S2 and S4 in the online Supplementary Material).
Atomistic MD simulations
In total, six AT MD simulations were run; four simulations of SERCA with a cholesterol molecule positioned in the thapsigargin binding pocket (thaps_0deg#1; -2; thaps_180deg#1; -2) and two control simulations without cholesterol present (Ref#1-2).
SERCA-bound thapsigargin was used as a guide for manual positioning of cholesterol in the four simulations with cholesterol placed in the thapsigargin pocket. The ring system and the aliphatic tail are common features of both cholesterol and thapsigargin and were superimposed (Figure S5 in Supplementary Material depicts an overlay of the two). Alignment of the ring planes in the two molecules allows two different binding orientations for cholesterol, interrelated by 180° along the longitudinal axis, and therefore two simulations were run, starting with cholesterol in each of the two orientations.
The SERCA structure used was determined with Na+ bound in what was later determined to be a K+ binding site in the P-domain (PDB ID 2C8K), and the ion was changed to K+ accordingly. The Mg2+ ion in the nucleotide binding site was left unchanged, while the ATP analog adenosine-(β-γ methylene)-triphosphate (AMPPCP) was converted into ATP. Residues Glu309, Glu771 and Glu908 were protonated according to studies by Musgaard et al. (Citation2011), and a disulphide bond was added between residues Cys876 and Cys888. SERCA was embedded in a 125 × 130 Å POPC membrane slab generated with the membrane builder plugin in VMD (Humphrey et al., Citation1996) and positioned according to the OPM (Orientations of Proteins in Membranes) database (Lomize et al., Citation2006). Lipids comprising atoms within 0.8 Å of any protein atom were deleted. Finally, the protein-membrane systems were further solvated with TIP3P water and ionized with 0.2 M KCl.
All simulations were run using the NAMD 2.8 program (Phillips et al., Citation2005) employing the CHARMM22 force field for proteins (MacKerell et al., Citation1998) and the CHARMM36 force field for lipids and cholesterol (Klauda et al., Citation2010). Prior to simulation, the systems were subjected to 1,500 steps of conjugate gradient minimization. Then, a 0.5 ns MD simulation followed, where everything but the lipid tails was kept fixed in space (NVT ensemble, T = 310 K), allowing the lipids to undergo an initial adaptation to the protein. Finally, all atoms were allowed to move freely in a production run of 100 ns (NPT ensemble, T = 310 K, P = 1 atm). The temperature was controlled by Langevin dynamics, and the Nosé-Hoover Langevin piston method was used for controlling the pressure (Feller et al., Citation1995; Martyna et al., Citation1994). Electrostatics were fully accounted for by applying the Particle Mesh Ewald method with periodic boundary conditions (Essmann et al., Citation1995). The van der Waals (vdW) interactions were truncated at 12 Å, applying a switching function at 10 Å. The neighbor-list containing all pairs of atoms for which non-bonded interactions were calculated, included atoms within 14 Å of each other and was updated for every 20 steps. Bonded interactions were evaluated every 1 fs, while electrostatic and vdW interactions were evaluated every 4 and 2 fs, respectively. Each simulation was run for 100 ns, and 2500 frames, evenly spread over the simulation, were used for analysis.
Results and discussion
CG MD simulations were carried out to sample the composition of the lipid annulus of SERCA, as well as to identify putative sites for specific cholesterol interaction at its membrane-embedded surface. This approach has previously been successfully in predicting phosphatidylinositol bisphosphate binding sites on Kir channels (Stansfeld et al., Citation2009) and cardiolipin (CL) interaction sites on Cytochrome bc1 (Arnarez et al., Citation2013) to mention a few examples.
In the following, the composition of the lipid annulus surrounding SERCA is analyzed. It is discussed how to distinguish between dynamic solvent-like interactions and specific binding events, i.e. between non-specific, short-lived interactions and specific, long-lived interactions. Furthermore, cholesterol binding modes that are stable for at least 600 ns of a simulation are particularly considered. Finally, we have studied in atomic detail whether the structural features shared between cholesterol and thapsigargin could result in a stable binding mode for cholesterol in the thapsigargin pocket.
The lipid annulus
Electron spin resonance (ESR) experiments with spin-labeled phospholipids have previously indicated that there is a group of phospholipids which exhibits a reduced motion or restricted mobility compared to that of the bulk lipids in the presence of SERCA (Lee, Citation2003; Jost & Griffith, Citation1978, Citation1980; Silvius et al., Citation1984). This group of lipids is considered to form an annulus around the membrane protein, analogous to the solvent layer surrounding a water-soluble protein (Ding et al., Citation1994; Simmonds et al., Citation1982, Citation1984). For SERCA, the number of lipids forming the annulus has been estimated to be 18–40 molecules per ATPase, depending on the experimental method applied (Marsh & Pali, Citation2004; Silvius et al., Citation1984; Simmonds et al., Citation1984; Villamil Giraldo et al., Citation2006; Warren et al., Citation1975).
The CG MD simulations conducted in the current study demonstrate why it is non-trivial to settle on a particular number of annular lipid positions. In the CG simulations, the phospholipid membrane components were observed to pack tightly around the protein, and on average, the SERCA surface was in contact with 57 lipids and seven cholesterol molecules, forming a boundary layer (considering beads within 7 Å) around the protein. However, further inspection revealed that many of these molecules were only transiently in contact with the protein via a minute interaction surface, and therefore more rightfully belonged to the bulk than the annulus. Accordingly, the definition of annular protein interaction was further restricted by imposing a criteria both for the contact surface (minimum 35% of molecule within 7 Å of protein) and for the longevity of the protein interaction time (minimum 12 ns). According to these criteria, the lipid annulus comprised an average of 32.3 ± 2.3 POPC lipids and 6.5 ± 1.7 cholesterol molecules. An example of a lipid annulus adhering to this definition is shown in . Modifying the criteria for the longevity of the protein contact time to values between 0 and 18 ns did not significantly affect the annulus composition. Likewise, modifying the contact surface criteria between ∼ 10 and 50% of cholesterol did not bring the number of annular cholesterol molecules outside the standard deviation given above. However, the number of annular POPC lipids was sensitive to this criteria resulting in annulus compositions ranging from 20–50 lipids. This observation matches well with the range of the lipid annulus compositions evaluated by different experimental methods (Marsh & Pali, Citation2004; Silvius et al., Citation1984; Simmonds et al., Citation1984; Villamil Giraldo et al., Citation2006; Warren et al., Citation1975) and together these observations propose that there is not a single correct definition of annular lipids, but rather it depends on the technique employed in the measurements.
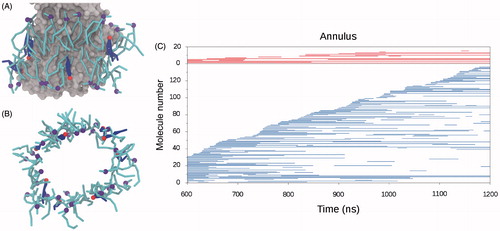
Figure 3. Membrane components interacting with SERCA. (A) and (B) Snapshots of lipid and cholesterol molecules in direct interaction with SERCA, defining an annulus around the TM part of the protein. (A) The SERCA TM domain is shown as gray surface representation. Lipids are represented as cyan sticks with the phosphate beads as purple spheres. Cholesterol molecules are shown as blue sticks with the polar head as red spheres. (B) The same snapshot as in A, but viewed along the membrane normal and omitting the protein. (C) Graph displaying protein interaction events for lipids (blue) and cholesterol (red) in the last 600 ns of one of the CG simulations. The vertical axis reflects the number of different lipid and cholesterol molecules interacting with SERCA in the analyzed time frame. The molecules are ordered according to their first encounter with SERCA. A horizontal line is made for the period where a specific molecule is interacting with SERCA, the lengths of the lines thus indicate the longevity of the interactions.
Previous interpretations of experimental data have assumed that cholesterol and phospholipids surrounding SERCA dynamically replace each other in a 1:1 manner (Simmonds et al., Citation1982), reasoned by similar molecular masses and volumes of cholesterol and the hydrophobic part of the phospholipids. However, cholesterol stabilizes lipid packing when mixed into a membrane, which is known as the “condensing effect” of cholesterol (Leathes, Citation1925; McConnell &Radhakrishnan, Citation2003). Based on measurements of the ratio in bulk between partial-specific areas derived for phospholipids (0.59–0.64 nm2) and cholesterol (0.24–0.28 nm2) (Alwarawrah et al., Citation2010; Edholm & Nagle, Citation2005), it could be argued that cholesterol and phospholipid would rather replace each other in a 2:1 manner. As an attempt to evaluate how cholesterol affected the annulus composition in the simulations, an additional simulation was set up in which a pure POPC bilayer was allowed to self-assemble around SERCA. The simulation procedure was identical to the POPC-cholesterol CG MD simulations, except that the cholesterol molecules were replaced by POPC lipids. In this simulation with a pure bilayer, the lipid annulus contained 34 lipids on average, which is within the standard deviation of the average number of lipids in the annulus observed for the simulations with POPC-cholesterol mixed membranes (32.3 ± 2.3) and suggests that the cholesterol molecules can pack effectively with lipids around SERCA, without dislocating the lipids significantly.
As the motional restriction of annular phospholipids occurs at a rate that exceeds NMR sampling, the composition of the annulus is expected to be highly dynamic (Jost & Griffith, Citation1980; Lee, Citation2003). illustrates how the components of the lipid annulus were exchanged with bulk molecules over the final 600 ns of one of the simulations (0.6–1.2 μs); A horizontal line in the graph indicates when a particular lipid or cholesterol molecule was part of the annulus. For the simulation represented by the graph in , the annulus comprised 31 POPC lipids (blue lines) and five cholesterol molecules (red lines) in the beginning of the assessed time span. A total of 15 different cholesterol molecules participated in the annulus during the analyzed 600 ns, and three of these either maintained or reestablished their annular position throughout the simulation. Of 136 different lipid molecules participating in the annulus during the 600 ns simulation, only three remained in the annulus throughout.
As an attempt to distinguish non-annular binding events from the solvent like annulus interactions, protein interaction events were registered for both cholesterol and POPC in the 30 MD simulations. In , each line in the graph indicates a protein interaction event. The events were grouped based on their protein interaction time (the length of the lines in the graph). With a resolution of 3 ns, the number of registered events with a particular protein interaction time was found (Figure S6 in Supplementary Material). For POPC lipids, the distribution has a broad peak around protein interactions of length 60–120 ns, which fits nicely with the experimentally deduced exchange time for phospholipids between the bulk phase and annular sites on SERCA of approximately 100 ns (Simmonds et al., Citation1982). The distribution flattens out towards the maximum measured interaction time length of 600 ns, and out of the 5314 registered interaction events for POPC, only ∼1% had an interaction time longer than 600 ns. These are the interactions that could be non-annular binding events, as a specific interaction between protein and lipid would stabilize the interaction for a longer time than would otherwise be the case. Cholesterol has a clear tendency to stay longer with the protein than the lipids do, and in ∼10% of the 612 registered interaction events for cholesterol, the interaction time is longer than 600 ns. However, the distribution for cholesterol does not show any recognizable trend for the measured interaction event lengths between 12 and 600 ns (Figure S6 in Supplementary Material).
Cavities in the membrane domain of SERCA
The crystal structure of SERCA reveals a number of cavities that may serve as non-annular binding sites (). One of these pockets is the thapsigargin binding pocket which is located between TM3, TM5 and TM7 and has the L6-7 loop shielding it from the cytoplasm (). Thapsigargin binds with sub-nanomolar affinity to this pocket (Thastrup et al., Citation1990) and stabilizes the enzyme in an E2 conformation incompatible with Ca2+ binding, and thus effectively inhibits protein function. Thapsigargin exhibits a tight fit to the binding site, which is dominated by hydrophobic interactions and only few hydrogen bonds, including water-mediated networks (Bublitz et al., Citation2013; Paulsen et al., Citation2013).
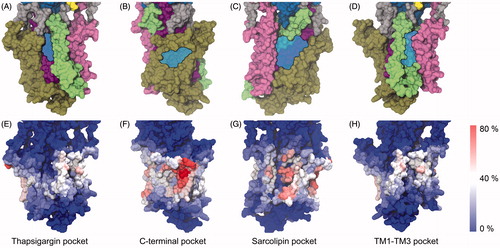
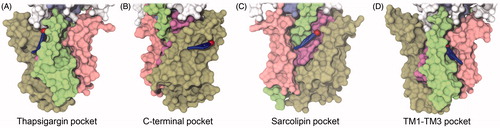
Figure 4. (A–D) Potential binding pockets on the TM surface of SERCA (PDB ID 2C8K). SERCA is shown in surface representation with TM1-2 colored pink, TM3–4 green, TM5–6 purple and TM7–10 brown. Blue, transparent patches indicate the cavities. (E–H) Residues in SERCA colored based on their level of interaction with cholesterol. The view angles as the same as those in panels A–D. The color scale goes from red (cholesterol contact registered in 80% of the ∼6000 analyzed snapshots) over white to blue (no cholesterol contact registered in the ∼6000 analyzed snapshots). Panels (A) and (E) The thapsigargin binding pocket; (B) and (F) The C-terminal pocket; (C) and (G) The sarcolipin binding pocket; (D) and (H) The TM1–TM3 pocket.
In addition to the thapsigargin site, another three cavities can be found on the membrane surface of SERCA by visual inspection. Firstly, a pocket between TM8, TM9 and TM10 is positioned in the membrane-water interface on the cytoplasmic side of the membrane, capped by the loop between TM8 and TM9. This pocket is referred to as the C-terminal pocket (). Another cavity is formed by TM2, TM4, TM6, and TM9 (), which harbors the binding site for the regulatory polypeptides sarcolipin and phospholamban (Akin et al., Citation2013; Asahi et al., Citation2003; Sasaki et al., Citation1992; Tupling et al., Citation2002; Toyoshima et al., Citation2003, Citation2013; Winther et al., Citation2013). Several crystal structures also show phosphatidylethanolamine (PE) lipids modelled in this cavity between TM2 and TM4 (Obara et al., Citation2005; Paulsen et al., Citation2013; Toyoshima et al., Citation2007; Winther et al., Citation2010) in the ion-depleted, E2 state of SERCA. Finally, a cavity is formed by TM1, TM3 and TM4, referred to as the TM1-TM3 pocket (). In the following two sections, short and long-lived binding events of lipid and cholesterol in the above-mentioned pockets of SERCA are presented and discussed.
Cholesterol interaction hotspots
In , the surface of SERCA is colored as to reflect the level of cholesterol interaction per residue observed in the 30 CG MD simulations. It has previously been suggested (Simmonds et al., Citation1982; Warren et al., Citation1975) that cholesterol is excluded from the surface of SERCA by POPC, and only interacts with SERCA from non-annular binding positions. However, according to the simulations it appeared that cholesterol generally had a considerable level of contact with the entire TM surface of SERCA (), and not only its cavities. Cholesterol was particularly disposed to interact with the upper part of the C-terminal pocket (). A second cholesterol interaction hot-spot was found in the wide sarcolipin pocket () with a slight preference for the luminal side of the pocket.
The two remaining TM pockets displayed a lower degree of cholesterol interaction (). For the TM1-TM3 pocket there was a higher level of cholesterol interaction at the rim of the pocket rather than inside the pocket itself (). The thapsigargin binding pocket (), which as a first approximation appeared to provide a good fit for cholesterol (Lee, Citation2003; Winther et al., Citation2010), displayed a remarkably low disposition towards interaction with cholesterol during the simulations. Instead, a phospholipid molecule was observed to enter and stay bound to the thapsigargin pocket in the majority of the simulations. The moderate level of cholesterol interaction observed for this site could as well be due to competition with favorable lipid interactions rather than a poor cholesterol interaction per se, as hypothesized by Silvius et al. (Citation1984) and further discussed in the final section.
Potential non-annular binding modes of cholesterol
Non-annular binding events are expected to display a specific binding mode and significantly longer protein interaction times than the solvent-like annular interactions. Based on Figure S6 in the Supplementary Material, it seems fair to expect specific, non-annular events to last longer than 600 ns. Thus, molecules interacting with SERCA throughout a full recording (i.e. with protein interaction times ≥ 600 ns) were studied in further detail. From the total of 30 simulations, 57 cholesterol and 50 lipid molecules showed such long-term interactions with SERCA and each of these instances were visually inspected. Eighteen of the 57 long-term cholesterol interactions maintained their mode of binding to SERCA throughout the 600 ns, as did 19 of the 50 inspected POPC lipids. On the contrary, the remaining long-term interactions represented non-specific “surfing” along the protein surface. Snapshots of all the potential non-annular binders at the four pockets on the surface of SERCA are collected in Figure S2 and S3 in the Supplementary Material, and representatives are depicted in .
Figure 5. Examples of potential non-annular binding modes of cholesterol in the four pockets on the surface of SERCA. Snapshots are from the end of the CG simulations showing molecules which have stayed in a stable binding mode for the last 600 ns of simulation. SERCA is shown in surface representation with TM1–TM2 colored pink, TM3–TM4 colored green, TM5–TM6 colored violet and TM7-TM10 colored light brown. Cholesterol is shown as blue sticks with the polar head as a red sphere. (A) Binding in the thapsigargin pocket; (B) binding in the TM1–TM3 pocket; (C) binding in the sarcolipin pocket; (D) binding in the C-terminal pocket.
On only a single occasion was a cholesterol molecule observed to stably bind in the thapsigargin pocket ( and Figure S7 B in Supplementary Material). On the other hand, in 12 out of the 30 simulations, the thapsigargin binding pocket was observed to be occupied by a phospholipid. The lipid binding mode was characteristic and consistent between simulations, with the phosphate head group interacting with either Ser830 or Lys252 in the upper part of the pocket and one aliphatic tail immobilized inside the pocket, while the second tail was flexible, tumbling around outside of the pocket. Interestingly, a crystal structure of a similar E2 state of SERCA stabilized by cyclopiazonic acid (CPA), indeed shows a non-annular PE lipid in the vacant thapsigargin site (PDB ID 2EAU (Takahashi et al., Citation2007)), although with its head-group more deeply buried than observed here in the simulations with PC lipids (Figure S7 D and E in Supplementary Material).
In six of the simulations, a cholesterol molecule was found in a stable binding mode at or near the pocket between TM1 and TM3 ( and Figure S3 A in Supplementary Material). In three of these cases, cholesterol displayed a binding mode like that represented in , with the polar head of cholesterol tightly inserted between the helices, interacting with the backbone beads of Ile64 (TM1), Ser261 and Ile264 (TM3) and Ala303 (TM4). In five other simulations, a phospholipid, instead of cholesterol, was bound to this cavity with one tail held fixed, while the rest of the lipid was free to move (Figure S3 A in Supplementary Material).
The sarcolipin binding pocket is a large cavity, where several cholesterol molecules might fit at the same time, and in fact this was frequently observed. Contrarily, in only two of the 30 simulations, lipids were observed to find a stable binding mode in the sarcolipin pocket; one with its head-group between TM2 and TM4 and another between TM4 and TM9. Interestingly, binding of PE between TM2 and TM4 has previously been observed in several crystal structures of SERCA and a comparison between the PC molecule observed in the simulations and PE modelled in PDB ID 3NAM (Winther et al., Citation2010) can be seen in Figure S8 in Supplementary Material. Out of the eight cases where a cholesterol molecule was caught in the sarcolipin pocket, four shared almost identical binding modes, exemplified by the snapshot in . The four other cases showed distinctly different positions, one of which interacted with one of the two cholesterol interaction hotspots ().
The C-terminal pocket found between TM9 and TM10 contained the second of the observed cholesterol interaction hot-spots (); in two instances cholesterol was found to have a stable binding mode at this location, with the long axis of the molecule almost perpendicular to the membrane normal (). It seemed that this cavity fits a hydrophobic molecule like cholesterol nicely, whereas no phospholipids displayed a stable binding mode in this pocket. However, as this cavity is a result of the protein position in the membrane, and not a grove between helices, it does not seem likely that cholesterol would affect conformational changes and thereby regulate SERCA as a non-annular binder from this position.
From a series of tryptophan fluorescence quenching studies involving SERCA, dioleoylphosphatidylcholine (DOPC) and cholesterol analogs (Ding et al., Citation1994; Simmonds et al., Citation1982, Citation1984), it was concluded that the sterols do not exchange with lipids in the annulus to any considerable degree, but instead find non-annular binding sites, which are inaccessible to phospholipids. At the time the studies were conducted, the atomistic structure of SERCA was yet to be determined. By examining the SERCA structure interacting with cholesterol molecules in the simulations it is now possible to verify if the tryptophan fluorescence quenching observed in the previous studies could arise solely from cholesterol molecules in non-annular positions (Figure S2 in Supplementary Material).
The efficiency of fluorescence quenching depends on the distance between a given tryptophan residue and the dibromide group of the brominated molecule, with a quenching efficiency of 50% at a distance of 8 Å (Bolen & Holloway, Citation1990), less than 20% for distances larger than 10 Å and negligible when the distance to the dibromide group is more than 14 Å (see earlier section entitled Experimental procedures). From the potential non-annular binding modes observed in our simulations, the fluorescence quenching contributed from each binding mode can be estimated (Figures S2 and S3 in Supplementary Material). One of the binding modes observed in the TM1–TM3 pocket quenches 75% of Trp272 (Figure S2 B in Supplementary Material) and four of the binding modes observed in the sarcolipin pocket give rise to 20–35% quenching of Trp794 (Figure S2 A in Supplementary Material). The potential non-annular binding modes observed in the C-terminal pocket and the thapsigargin pocket do not give rise to any considerable quenching; in particular, the thapsigargin pocket is too far from any tryptophan residue for a binding event to have a drastic effect on the fluorescence. As is clear from Figure S4 and Figure S10 in Supplementary Material, several of the 13 tryptophan residues are positioned such that cholesterol molecules in both annular positions and non-annular positions be within quenching distance. Analyzing the last snapshots of the 30 CG MD simulations, 46 cholesterols were at an interaction site that would result in more than 30% quenching of a tryptophan. Of the 46, only four were non-annular binders. Figure S10 in Supplementary Material shows an example where three clearly annular cholesterol molecules quench a tryptophan residue with 65–76%. From the structure of SERCA and the simulations it is thus clear that the observed fluorescence quenching (Froud et al., Citation1986; Lee, Citation2003; Simmonds et al., Citation1982) could not arise solely from non-annular binding cholesterol molecules.
A reason for previous experimental studies concluding that cholesterol is excluded from the lipid annulus surrounding SERCA with a relative binding constant for sterol over DOPC of around 0.6 or less (Ding et al., Citation1994; East & Lee, Citation1982; Simmonds et al., Citation1982, Citation1984; Silvius et al., Citation1984) could be the underlying assumption that cholesterol replaces lipids in the annulus in a 1:1 manner. As discussed previously, cholesterol and phospholipid would rather replace each other in a 2:1 manner. The relative binding constant would in that case be around one for DOPC and sterol, based on the same experimental data, and this would in fact support that cholesterol is found in the annulus together with phospholipids. The condensing effect of cholesterol, that allows an efficient packing of cholesterol and lipids around the surface of SERCA as observed in the simulations, would also explain the observation from the fluorescence studies that cholesterol cannot exclude brominated lipids from the surface of SERCA to a degree that results in a decreased quenching (Ding et al., Citation1994; East & Lee, Citation1982; Simmonds et al., Citation1982, Citation1984).
Can cholesterol substitute for thapsigargin?
Cholesterol and thapsigargin share several structural features; they both consist of a central ring system with a substituted aliphatic tail and they have approximately the same longitudinal length. However, while cholesterol only has a single polar interaction group, thapsigargin contains several side chains with hydrogen bonding potential that contribute to interaction with the protein through water mediated hydrogen bonds (Bublitz et al., Citation2013; Paulsen et al., Citation2013). To study how cholesterol might fit in the thapsigargin binding pocket with atomistic detail, AT MD simulations with cholesterol positioned in the pocket were carried out. In the set-up, cholesterol was positioned according to the best possible superposition with thapsigargin in the crystal structure (PDB ID 2C8K (Jensen et al., Citation2006)). Two different orientations of cholesterol were tested, rotated 180° around the longitudinal axis with respect to each other (Figure S5 in Supplementary Material). Both positions fulfilled the expectation that the hydroxyl group would prefer to be located in the cytoplasmic part of the pocket, where it might interact with the solvent and polar head groups of the phospholipids, while the bulky steroid is embedded in the tail section. Two repeated simulations of each of the two starting structures were carried out in addition to two control simulations without cholesterol present.
It was expected that having cholesterol in the position where thapsigargin is known to stabilize SERCA in the so-called E2 conformation (Thastrup et al., Citation1990) and prevent it from changing conformation, would result in a more stable protein structure than with only lipids packing around the protein. However, this trend was not observed. The protein structure was more or less equally stable in all simulations, with a root-mean square deviation (RMSD) of around 1.3–2.1 Å for the membrane-embedded part, regardless of how the cholesterol was positioned in the thapsigargin pocket, or if the pocket was occupied by lipid instead, as in the Ref #1 and Ref #2 simulations (Figure S9 in Supplementary Material).
In the four AT simulations with cholesterol, the molecule assumed various positions in the pocket during the 100 ns of simulation mainly by dislocating along the membrane normal and rotating around the longitudinal axis of the molecule (see for final snapshots). No specific, preferred interaction between the cholesterol hydroxyl group and the protein was observed; rather, the group interacted with several different residues in the cytoplasmic part of the thapsigargin pocket. Notably, the two different starting orientations of cholesterol exhibited distinct hydrogen bonding preferences. In Thaps_0deg#1 and #2, cholesterol was observed to form hydrogen bonds to either the backbone amines of Leu828 and Ile829 (TM6-TM7 cytoplasmic loop) or to the side chains of Lys252 and Glu255 (TM3). These residues line the sides of the cytoplasmic part of the thapsigargin pocket. In contrast, the hydroxyl group in cholesterol seemed to prefer water over protein as a direct hydrogen bonding partner in Thaps_180deg#1 and #2. The cholesterol hydroxyl group was in contact with mostly two water molecules on the cytoplasmic side of the membrane in Thaps_180deg#1 and #2. Only transient interactions with lipid head groups were observed in all four simulations, although the hydroxyl group was at the proper position to establish such interactions in the majority of the simulations. One of the AT simulations stood out from the rest (Thaps_180deg#1), in which an interaction between a neighboring lipid tail and the aliphatic tail of cholesterol pulled in the sterol causing it to undergo a tilt with respect to the membrane normal, while a water-mediated hydrogen bond was established to the side chain of Asn768 (TM5) in the calcium binding site ().
Figure 6. Comparison of cholesterol (cyan carbon atoms) and thapsigargin (yellow carbon atoms) in the thapsigargin pocket after 100 ns, aligned according to Cα positions in the membrane spanning part of the TM helices. Oxygen atoms are colored red, SERCA is represented by a gray surface. (A) Thapsigargin in the crystal structure and a collection of the final snapshots of cholesterol in (B) Thaps_0deg#1 (C) Thaps_0deg#2 (D) Thaps_180deg#1 (E) Thaps_180deg#2.
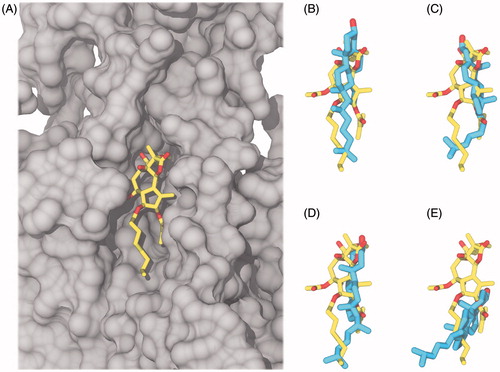
The final positions of the cholesterol molecules obtained from the four simulations as compared to the position of thapsigargin in the crystal structure can be seen in and illustrate that the spatial location of the structures overlapped to a large extent. However, from a detailed visual inspection of the simulations it was clear that cholesterol was unable to engage in a specific, well-defined binding mode in the thapsigargin pocket during the 100 ns, although the pocket was well-sampled by both rotation around the longitudinal axis of the molecule and dislocations in the pocket. It is also clear that, although the simulations were biased towards establishing binding modes comparable to that of thapsigargin, the features shared between the molecules were insufficient to compensate for their differences, and cholesterol is clearly not suited to occupy the pocket in a thapsigargin-like manner. Indeed, the ring system substituents of thapsigargin play a role in filling out the cavities and crevices in the pocket between TM3, TM5 and TM7, as previously verified by exhaustive structure-activity studies (Skytte et al., Citation2010). Taken together, cholesterol was capable to form direct as well as water-mediated hydrogen bonds with SERCA during the simulations, however, it is clear that they were too non-specific and sparse to anchor cholesterol to the protein.
Conclusions
Cholesterol can be a regulator of membrane protein activity, either through specific or non-specific effects. Regulation through specific interactions require binding of cholesterol to a particular TM site of the protein, while the non-specific regulation occurs through a change of the overall bulk properties of the membrane by introducing order and increasing the hydrophobic thickness or through interactions with annular lipids forming a shell around the protein. When measuring the effect of cholesterol on protein activity in an experimental setup, it is particularly difficult to separate specific from non-specific effects.
Previous experimental assessments of the roles of specific or non-specific regulation of SERCA by cholesterol did not achieve mutually exclusive possibilities. Thus, in the current study, MD simulations at the CG and AT levels were used to monitor specific and non-specific, direct interactions between SERCA and the membrane components in a mixed bilayer of lipid and cholesterol. This approach is particularly suitable for assessing the exchange of lipids between the annulus and bulk, as these events take place on the nanosecond time scale. The composition and exchange properties of the phospholipid and cholesterol molecules surrounding SERCA were evaluated and the definition of the lipid annulus discussed. It was found that the annulus of SERCA is slightly enriched with cholesterol, composed of approximately 32 lipids and 6.5 cholesterol molecules, despite an overall molar ratio of 10:1 of POPC and cholesterol.
Based on the CG MD simulations, cholesterol interaction with the SERCA TM surface was quantified at the residue level, and interaction hotspots were observed in a pocket located near the C-terminus as well as in the pocket recently verified as that binding sarcolipin (Toyoshima et al., Citation2013; Winther et al., Citation2013). Looking exclusively at long-term stable cholesterol binding modes (>0.6 μs) with SERCA it cannot be ruled out that one of the binding modes in the sarcolipin pocket or in the pocket between TM1 and TM3 could be in a position to affect conformational changes and thus take part in regulating SERCA activity. However, lipids with equally stable binding modes were also observed in these pockets, and nothing in the simulations thus suggested that cholesterol could serve as a regulator in the pockets any more than the lipids present in the membrane. Furthermore, the assumptions and hypotheses in the experimental studies supporting a specific, non-annular regulation of SERCA by cholesterol (Ding et al., Citation1994; Simmonds et al., Citation1982, Citation1984) were clearly not supported by the simulations conducted in the current study. Based on the observed packing of lipids and cholesterol around the protein, another interpretation of the experimental results was offered, consistent with the MD simulations in this study as well as other experimental data supporting regulation through non-specific, indirect effects (Borchman et al., Citation1999; Cheng et al., Citation1986; Li et al., Citation2004; Moore et al., Citation1978; Whiting et al., Citation2000).
The binding pocket known to bind thapsigargin, a nanomolar inhibitor of SERCA sharing structural features with cholesterol, was primarily occupied by lipids in the CG MD simulations. AT MD simulations of cholesterol positioned in the thapsigargin binding pocket further corroborated that cholesterol is in fact not particularly well suited to occupy the thapsigargin pocket, as cholesterol was not observed to bind in a single, stable orientation within the pocket.
In summary, the MD simulations undertaken in this study, which addressed the interactions between SERCA and cholesterol at a sub-residue (CG) and atomic (AT) resolution, provide new insight into the regulation of SERCA and support the proposition that cholesterol-mediated regulation of SERCA is exclusively a non-specific effect.
Supplementary material available online
Supplementary Figures S1-S10.
IMBC_1073382_Supp.pdf
Download PDF (5.3 MB)Acknowledgements
The authors of this article thank Dr Maike Bublitz for corrections to the final version.
Declaration of interest
The authors report no conflicts of interest. The authors alone are responsible for the content and writing of the paper.
References
- Akin BL, Hurley TD, Chen Z, Jones LR. 2013. The structural basis for phospholamban inhibition of the calcium pump in sarcoplasmic reticulum. J Biol Chem 288:30181–30191
- Alwarawrah M, Dai J, Huang J. 2010. A molecular view of the cholesterol condensing effect in DOPC lipid bilayers. J Phys Chem B 114:7516–7523
- Arnarez C, Mazat JP, Elezgaray J, Marrink SJ, Periole X. 2013. Evidence for cardiolipin binding sites on the membrane-exposed surface of the cytochrome bc1. J Am Chem Soc 135:3112–3120
- Asahi M, Sugita Y, Kurzydlowski K, De Leon S, Tada M, Toyoshima C, Maclennan DH. 2003. Sarcolipin regulates sarco(endo)plasmic reticulum Ca2+-ATPase (SERCA) by binding to transmembrane helices alone or in association with phospholamban. Proc Natl Acad Sci USA 100:5040–5045
- Berendsen HJC, Postma JPM, Van Gunsteren WF, Dinola A, Haak JR. 1984. Molecular dynamics with coupling to an external bath. J Chem Phys 81:3684–3690
- Bolen EJ, Holloway PW. 1990. Quenching of tryptophan fluorescence by brominated phospholipid. Biochemistry 29:9638–9643
- Borchman D, Simon R, Bicknell-Brown E. 1982. Variation in the lipid composition of rabbit muscle sarcoplasmic reticulum membrane with muscle type. J Biol Chem 257:14136–14139
- Borchman D, Tang D, Yappert MC. 1999. Lipid composition, membrane structure relationships in lens and muscle sarcoplasmic reticulum membranes. Biospectroscopy 5:151–167
- Brown MS, Goldstein JL. 1983. Lipoprotein metabolism in the macrophage: Implications for cholesterol deposition in atherosclerosis. Annu Rev Biochem 52:223–261
- Bublitz M, Musgaard M, Poulsen H, Thogersen L, Olesen C, Schiott B, et al. 2013. Ion pathways in the sarcoplasmic reticulum Ca2+-ATPase. J Biol Chem 288:10759–10765
- Cheng KH, Lepock JR, Hui SW, Yeagle PL. 1986. The role of cholesterol in the activity of reconstituted Ca-ATPase vesicles containing unsaturated phosphatidylethanolamine. J Biol Chem 261:5081–5087
- Cherezov V, Rosenbaum DM, Hanson MA, Rasmussen SG, Thian FS, Kobilka TS, et al. 2007. High-resolution crystal structure of an engineered human beta2-adrenergic G protein-coupled receptor. Science 318:1258–1265
- Clausen JD, Bublitz M, Arnou B, Montigny C, Jaxel C, Moller JV, et al. 2013. SERCA mutant E309Q binds two Ca(2+) ions but adopts a catalytically incompetent conformation. EMBO J 32:3231–3243
- Connolly TJ, Carruthers A, Melchior DL. 1985. Effects of bilayer cholesterol on human erythrocyte hexose transport protein activity in synthetic lecithin bilayers. Biochemistry 24:2865–2873
- Davidson GA, Varhol RJ. 1995. Kinetics of thapsigargin-Ca(2+)-ATPase (sarcoplasmic reticulum) interaction reveals a two-step binding mechanism and picomolar inhibition. J Biol Chem 270:11731–11734
- Davis PJ, Poznansky MJ. 1987. Modulation of 3-hydroxy-3-methylglutaryl-CoA reductase by changes in microsomal cholesterol content or phospholipid composition. Proc Natl Acad Sci USA 84:118–121
- Denmeade SR, Mhaka AM, Rosen DM, Brennen WN, Dalrymple S, Dach I, et al. 2012. Engineering a prostate-specific membrane antigen-activated tumor endothelial cell prodrug for cancer therapy. Sci Translational Med 4:140ra86 (1–12)
- Ding J, Starling AP, East JM, Lee AG. 1994. Binding sites for cholesterol on Ca(2+)-ATPase studied by using a cholesterol-containing phospholipid. Biochemistry 33:4974–4979
- Drachmann ND, Olesen C, Møller JV, Guo Z, Nissen P, Bublitz M. 2014. Comparing crystal structures of the Ca2+-ATPase in different lipid: detergent mixtures. FEBS J 281:4249–4262
- East JM, Lee AG. 1982. Lipid selectivity of the calcium and magnesium ion dependent adenosinetriphosphatase, studied with fluorescence quenching by a brominated phospholipid. Biochemistry 21:4144–4151
- Edholm O, Nagle JF. 2005. Areas of molecules in membranes consisting of mixtures. Biophys J 89:1827–1832
- Essmann U, Perera L, Berkowitz ML, Darden T, Lee H, Pedersen LG. 1995. A smooth particle mesh Ewald method. J Chem Phys 103:8577–8593
- Fan Z, Makielski JC. 1997. Anionic phospholipids activate ATP-sensitive potassium channels. J Biol Chem 272:5388–5395
- Feller SE, Zhang YH, Pastor RW, Brooks BR. 1995. Constant-pressure molecular-dynamics simulation – the Langevin piston method. J Chem Phys 103:4613–4621
- Froud RJ, East JM, Jones OT, Lee AG. 1986. Effects of lipids and long-chain alkyl derivatives on the activity of (Ca2+-Mg2+)-ATPase. Biochemistry 25:7544–7552
- Gustavsson M, Traaseth NJ, Veglia G. 2011. Activating and deactivating roles of lipid bilayers on the Ca(2+)-ATPase/phospholamban complex. Biochemistry 50:10367–10374
- Heginbotham L, Kolmakova-Partensky L, Miller C. 1998. Functional reconstitution of a prokaryotic K+ channel. J Gen Physiol 111:741–749
- Hong WC, Amara SG. 2010. Membrane cholesterol modulates the outward facing conformation of the dopamine transporter and alters cocaine binding. J Biol Chem 285:32616–32626
- Humphrey W, Dalke A, Schulten K. 1996. VMD: Visual molecular dynamics. J Mol Graph 14:33–38, 27–28
- Jensen AM, Sorensen TL, Olesen C, Moller JV, Nissen P. 2006. Modulatory and catalytic modes of ATP binding by the calcium pump. EMBO J 25:2305–2314
- Johannsson A, Keightley CA, Smith GA, Richards CD, Hesketh TR, Metcalfe JC. 1981. The effect of bilayer thickness and n-alkanes on the activity of the (Ca2+ + Mg2+)-dependent ATPase of sarcoplasmic reticulum. J Biol Chem 256:1643–1650
- Jones OT, Mcnamee MG. 1988. Annular and nonannular binding sites for cholesterol associated with the nicotinic acetylcholine receptor. Biochemistry 27:2364–2374
- Jost PC, Griffith OH. 1978. The spin-labeling technique. Methods Enzymol 49:369–418
- Jost PC, Griffith OH. 1980. The lipid-protein interface in biological membranes. Ann N Y Acad Sci 348:391–407
- Klauda JB, Venable RM, Freites JA, O’Connor JW, Tobias DJ, Mondragon-Ramirez C, et al. 2010. Update of the CHARMM all-atom additive force field for lipids: Validation on six lipid types. J Phys Chem B 114:7830–7843
- Leathes JB. 1925. Croonian Lectures on the role of fats in vital phenomena. Lancet 1:1019–1022
- Lee AG. 2002. Ca2+ -ATPase structure in the E1 and E2 conformations: Mechanism, helix-helix and helix-lipid interactions. Biochim Biophys Acta 1565:246–266
- Lee AG. 2003. Lipid-protein interactions in biological membranes: A structural perspective. Biochim Biophys Acta-Biomembranes 1612:1–40
- Lee AG. 2011. Lipid-protein interactions. Biochem Soc Trans 39:761–766
- Li Y, Ge M, Ciani L, Kuriakose G, Westover EJ, Dura M, et al. 2004. Enrichment of endoplasmic reticulum with cholesterol inhibits sarcoplasmic-endoplasmic reticulum calcium ATPase-2b activity in parallel with increased order of membrane lipids: Implications for depletion of endoplasmic reticulum calcium stores and apoptosis in cholesterol-loaded macrophages. J Biol Chem 279:37030–37039
- Lifshitz Y, Petrovich E, Haviv H, Goldshleger R, Tal DM, Garty H, Karlish SJ. 2007. Purification of the human alpha2 Isoform of Na,K-ATPase expressed in Pichia pastoris. Stabilization by lipids and FXYD1. Biochemistry 46:14937–14950
- Lomize MA, Lomize AL, Pogozheva ID, Mosberg HI. 2006. OPM: Orientations of proteins in membranes database. Bioinformatics 22:623–625
- Mackerell AD, Bashford D, Bellott M, Dunbrack RL, Evanseck JD, Field MJ, et al. 1998. All-atom empirical potential for molecular modeling and dynamics studies of proteins. J Phys Chem B 102:3586–3616
- Marius P, Zagnoni M, Sandison ME, East JM, Morgan H, Lee AG. 2008. Binding of anionic lipids to at least three nonannular sites on the potassium channel KcsA is required for channel opening. Biophys J 94:1689–1698
- Marrink SJ, Mark AE. 2004. Molecular view of hexagonal phase formation in phospholipid membranes. Biophys J 87:3894–3900
- Marrink SJ, Risselada HJ, Yefimov S, Tieleman DP, De Vries AH. 2007. The MARTINI force field: Coarse grained model for biomolecular simulations. J Phys Chem B 111:7812–7824
- Marsh D, Pali T. 2004. The protein-lipid interface: Perspectives from magnetic resonance and crystal structures. Biochim Biophys Acta 1666:118–141
- Martyna GJ, Tobias DJ, Klein ML. 1994. Constant-pressure molecular-dynamics algorithms. J Chem Phys 101:4177–4189
- Mcconnell HM, Radhakrishnan A. 2003. Condensed complexes of cholesterol and phospholipids. Biochim Biophys Acta 1610:159–173
- Meissner G, Fleischer S. 1971. Characterization of sarcoplasmic reticulum from skeletal muscle. Biochim Biophys Acta 241:356–378
- Monticelli L, Kandasamy SK, Periole X, Larson RG, Tieleman DP, Marrink S-J. 2008. The MARTINI coarse-grained force field: Extension to proteins. J Chem Theory Comput 4:819–834
- Moore BM, Lentz BR, Meissner G. 1978. Effects of sarcoplasmic reticulum Ca2+-ATPase on phospholipid bilayer fluidity: boundary lipid. Biochemistry 17:5248–5255
- Musgaard M, Thogersen L, Schiott B. 2011. Protonation states of important acidic residues in the central Ca(2)(+) ion binding sites of the Ca(2)(+)-ATPase: A molecular modeling study. Biochemistry 50:11109–11120
- Obara K, Miyashita N, Xu C, Toyoshima I, Sugita Y, Inesi G, Toyoshima C. 2005. Structural role of countertransport revealed in Ca(2+) pump crystal structure in the absence of Ca(2+). Proc Natl Acad Sci USA 102:14489–14496
- Papp B, Enyedi A, Kovacs T, Sarkadi B, Wuytack F, Thastrup O, et al. 1991. Demonstration of two forms of calcium pumps by thapsigargin inhibition and radioimmunoblotting in platelet membrane vesicles. J Biol Chem 266:14593–14596
- Paulsen ES, Villadsen J, Tenori E, Liu H, Bonde DF, Lie MA, et al. 2013. Water-mediated interactions influence the binding of thapsigargin to sarco/endoplasmic reticulum calcium adenosinetriphosphatase. J Med Chem 56:3609–3619
- Periole X, Cavalli M, Marrink S-J, Ceruso MA. 2009. Combining an elastic network with a coarse-grained molecular force field: Structure, dynamics, and intermolecular recognition. J Chem Theory Comput 5:2531–2543
- Phillips JC, Braun R, Wang W, Gumbart J, Tajkhorshid E, Villa E, et al. 2005. Scalable molecular dynamics with NAMD. J Comput Chem 26:1781–1802
- Ryan SE, Demers CN, Chew JP, Baenziger JE. 1996. Structural effects of neutral and anionic lipids on the nicotinic acetylcholine receptor. An infrared difference spectroscopy study. J Biol Chem 271:24590–24597
- Sasaki T, Inui M, Kimura Y, Kuzuya T, Tada M. 1992. Molecular mechanism of regulation of Ca2+ pump ATPase by phospholamban in cardiac sarcoplasmic reticulum. Effects of synthetic phospholamban peptides on Ca2+ pump ATPase. J Biol Chem 267:1674–1679
- Scott KA, Bond PJ, Ivetac A, Chetwynd AP, Khalid S, Sansom MS. 2008. Coarse-grained MD simulations of membrane protein-bilayer self-assembly. Structure 16:621–630
- Shinoda T, Ogawa H, Cornelius F, Toyoshima C. 2009. Crystal structure of the sodium-potassium pump at 2.4 A resolution. Nature 459:446–450
- Shinzawa-Itoh K, Aoyama H, Muramoto K, Terada H, Kurauchi T, Tadehara Y, et al. 2007. Structures and physiological roles of 13 integral lipids of bovine heart cytochrome c oxidase. EMBO J 26:1713–1725
- Silvius JR, Mcmillen DA, Saley ND, Jost PC, Griffith OH. 1984. Competition between cholesterol and phosphatidylcholine for the hydrophobic surface of sarcoplasmic reticulum Ca2+-ATPase. Biochemistry 23:538–547
- Simmonds AC, East JM, Jones OT, Rooney EK, Mcwhirter J, Lee AG. 1982. Annular and non-annular binding sites on the (Ca2+ + Mg2+)-ATPase. Biochim Biophys Acta 693:398–406
- Simmonds AC, Rooney EK, Lee AG. 1984. Interactions of cholesterol hemisuccinate with phospholipids and (Ca2+-Mg2+)-ATPase. Biochemistry 23:1432–1441
- Skytte DM, Moller JV, Liu H, Nielsen HO, Svenningsen LE, Jensen CM, et al. 2010. Elucidation of the topography of the thapsigargin binding site in the sarco-endoplasmic calcium ATPase. Bioorg Med Chem 18:5634–5646
- Sonntag Y, Musgaard M, Olesen C, Schiott B, Moller JV, Nissen P, Thogersen L. 2011. Mutual adaptation of a membrane protein and its lipid bilayer during conformational changes. Nat Commun 2:304 (1–7)
- Stansfeld PJ, Hopkinson R, Ashcroft FM, Sansom MS. 2009. PIP(2)-binding site in Kir channels: Definition by multiscale biomolecular simulations. Biochemistry 48:10926–10933
- Starling AP, East JM, Lee AG. 1993. Effects of phosphatidylcholine fatty acyl chain length on calcium binding and other functions of the (Ca(2+)-Mg2+)-ATPase. Biochemistry 32:1593–600
- Takahashi M, Kondou Y, Toyoshima C. 2007. Interdomain communication in calcium pump as revealed in the crystal structures with transmembrane inhibitors. Proc Natl Acad Sci USA 104:5800–5805
- Thastrup O, Cullen PJ, Drobak BK, Hanley MR, Dawson AP. 1990. Thapsigargin, a tumor promoter, discharges intracellular Ca2+ stores by specific inhibition of the endoplasmic reticulum Ca2(+)-ATPase. Proc Natl Acad Sci USA 87:2466–2470
- Toyoshima C, Asahi M, Sugita Y, Khanna R, Tsuda T, Maclennan DH. 2003. Modeling of the inhibitory interaction of phospholamban with the Ca2+ ATPase. Proc Natl Acad Sci USA 100:467–472
- Toyoshima C, Iwasawa S, Ogawa H, Hirata A, Tsueda J, Inesi G. 2013. Crystal structures of the calcium pump and sarcolipin in the Mg2+-bound E1 state. Nature 495:260–264
- Toyoshima C, Nomura H, Tsuda T. 2004. Lumenal gating mechanism revealed in calcium pump crystal structures with phosphate analogues. Nature 432:361–368
- Toyoshima C, Norimatsu Y, Tsueda J. 2007. Crystal structure of the calcium pump with amppcp in the absence of calcium. Available from: www.pdb.org. PDBID 2DQS
- Toyoshima C, Yonekura S, Tsueda J, Iwasawa S. 2011. Trinitrophenyl derivatives bind differently from parent adenine nucleotides to Ca2+-ATPase in the absence of Ca2+. Proc Natl Acad Sci USA 108:1833–1838
- Tupling AR, Asahi M, Maclennan DH. 2002. Sarcolipin overexpression in rat slow twitch muscle inhibits sarcoplasmic reticulum Ca2+ uptake and impairs contractile function. J Biol Chem 277:44740–44746
- Van Der Spoel D, Lindahl E, Hess B, Groenhof G, Mark AE, Berendsen HJ. 2005. GROMACS: Fast, flexible, and free. J Comput Chem 26:1701–1718
- Van Meer G, Voelker DR, Feigenson GW. 2008. Membrane lipids: Where they are and how they behave. Nat Rev Mol Cell Biol 9:112–124
- Villamil Giraldo AM, Castello PR, Gonzalez Flecha FL, Møller JV, Delfino JM, Rossi JP. 2006. Stoichiometry of lipid-protein interaction assessed by hydrophobic photolabeling. FEBS Lett 580:607–612
- Warren GB, Houslay MD, Metcalfe JC, Birdsall NJ. 1975. Cholesterol is excluded from the phospholipid annulus surrounding an active calcium transport protein. Nature 255:684–687
- Whiting KP, Restall CJ, Brain PF. 2000. Steroid hormone-induced effects on membrane fluidity and their potential roles in non-genomic mechanisms. Life Sci 67:743–757
- Winther AM, Bublitz M, Karlsen JL, Moller JV, Hansen JB, Nissen P, Buch-Pedersen MJ. 2013. The sarcolipin-bound calcium pump stabilizes calcium sites exposed to the cytoplasm. Nature 495:265–269
- Winther AM, Liu H, Sonntag Y, Olesen C, Le Maire M, Soehoel H, Olsen CE, et al. 2010. Critical roles of hydrophobicity and orientation of side chains for inactivation of sarcoplasmic reticulum Ca2+-ATPase with thapsigargin and thapsigargin analogs. J Biol Chem 285:28883–28892
- Yeagle PL, Albert AD, Boesze-Battaglia K, Young J, Frye J. 1990. Cholesterol dynamics in membranes. Biophys J 57:413–424
- Yeagle PL, Young J, Rice D. 1988. Effects of cholesterol on (Na+,K+)-ATPase ATP hydrolyzing activity in bovine kidney. Biochemistry 27:6449–6452
- Zocher M, Zhang C, Rasmussen SG, Kobilka BK, Muller DJ. 2012. Cholesterol increases kinetic, energetic, and mechanical stability of the human beta2-adrenergic receptor. Proc Natl Acad Sci USA 109:E3463–E3472